Host genetics and diet, but not immunoglobulin A expression, converge to shape compositional features of the gut microbiome in an advanced intercross population of mice - PubMed (original) (raw)
Host genetics and diet, but not immunoglobulin A expression, converge to shape compositional features of the gut microbiome in an advanced intercross population of mice
Larry J Leamy et al. Genome Biol. 2014.
Abstract
Background: Individuality in the species composition of the vertebrate gut microbiota is driven by a combination of host and environmental factors that have largely been studied independently. We studied the convergence of these factors in a G10 mouse population generated from a cross between two strains to search for quantitative trait loci (QTLs) that affect gut microbiota composition or ileal Immunoglobulin A (IgA) expression in mice fed normal or high-fat diets.
Results: We found 42 microbiota-specific QTLs in 27 different genomic regions that affect the relative abundances of 39 taxa, including four QTL that were shared between this G10 population and the population previously studied at G4. Several of the G10 QTLs show apparent pleiotropy. Eight of these QTLs, including four at the same site on chromosome 9, show significant interaction with diet, implying that diet can modify the effects of some host loci on gut microbiome composition. Utilization patterns of IghV variable regions among IgA-specific mRNAs from ileal tissue are affected by 54 significant QTLs, most of which map to a segment of chromosome 12 spanning the Igh locus. Despite the effect of genetic variation on IghV utilization, we are unable to detect overlapping microbiota and IgA QTLs and there is no significant correlation between IgA variable pattern utilization and the abundance of any of the taxa from the fecal microbiota.
Conclusions: We conclude that host genetics and diet can converge to shape the gut microbiota, but host genetic effects are not manifested through differences in IgA production
Figures
Figure 1
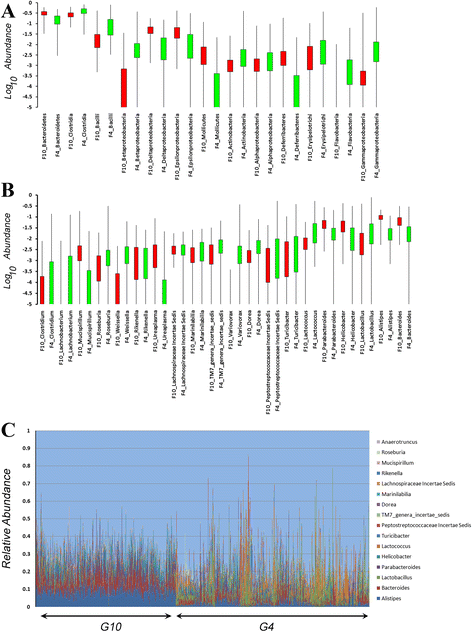
Comparison of microbiota composition between G 4 and G 10 populations. (A, B) Box and whisker plots for the Log10 relative abundances of taxa ((A) Class, (B) Genus) that are shared between the G4 (green) and G10 (red) populations. The boxes represent 75% of the data and whiskers indicate the range. (C) The relative abundances of the 16 shared genera between the G4 and G10 populations. G10 mice are shown on the left by cohort and G4 mice are on the right ordered by cohort.
Figure 2
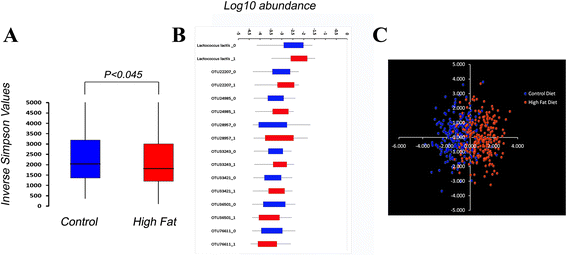
Effect of diet on the G 10 microbiota. (A) Box and whisker plots of the Inverse Simpson’s index for animals on the control or high-fat diet. The microbiota from animals fed the control (blue) or high-fat (red) diets show a significant effect of diet (one-sided _t_-test: P <0.045). **(B)** The distributions of eight taxa showing a statistically significant effect of diet (Bonferonni-adjusted _P_ <0.00000483) are depicted in box and whisker plots. The boxes define 75% of the data points. Blue = control diet, Red = high-fat diet. **(C)** The log-transformed abundances of 34 taxa with the smallest, non-adjusted ANOVA _P_ values were used as variables for Linear Discriminant Analysis (LDA) with diet and parity as factors. The first two LDA functions account for >60% (X axis) and >30% (Y-axis) of the variation in these taxa.
Figure 3
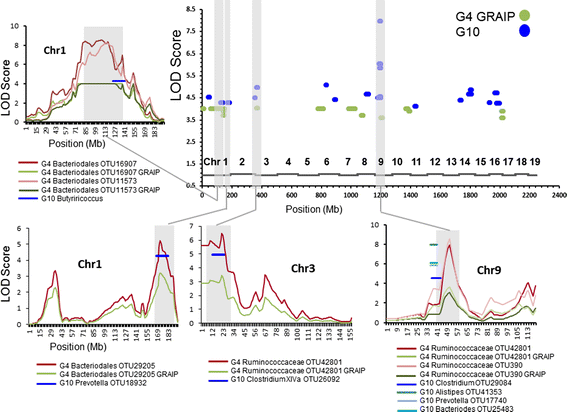
Relative positions of QTLs controlling gut microbial taxa from the G 4 and G 10 populations. In the graph on the top right (Whole Genome), peak positions of the QTLs from the G4 (green dots) and G10 (blue dots) generations are plotted along the length of the 19 mouse autosomes. The relative positions of each chromosome are indicated above the X axis. Regions where confidence intervals overlap from G4 and G10 QTLs are highlighted in gray and are plotted in the corresponding graphs to the left and below. Plots for the overlaps on the individual chromosomes show the chromosome positions (X axis) and naïve/GRAIP-adjusted LOD scores (Y axis) for the significant G4 QTLs with the confidence intervals of the G10 QTLs plotted as a single line at its corresponding position and peak LOD score. Individual taxa are color-coded below each graph.
Figure 4
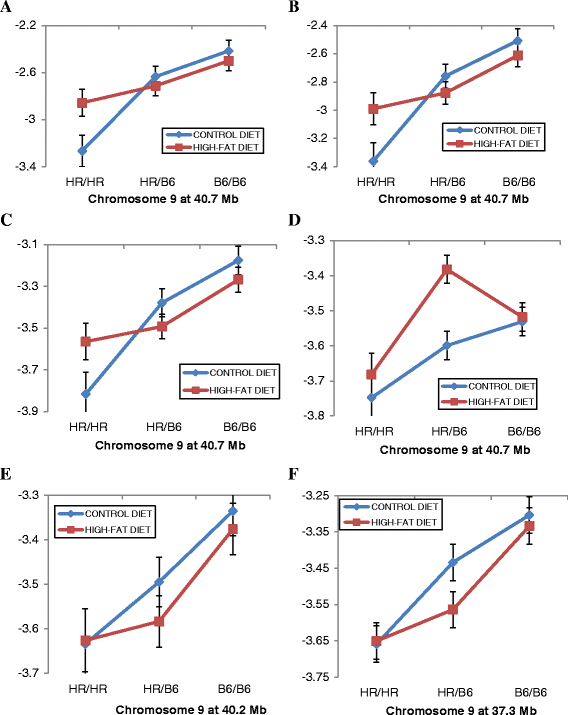
QTL on Chr 9 show complex interactions with diet. (A-F) Plots of genotypic values at the QTL peak (X axis) are shown for six different OTUs that have peaks at the same or similar location on Chr 9 and which show differential effects depending on whether the G10 mice were fed the control or the high-fat diet. Relative abundances of the OTUs for animals having the HR/HR parental, HR/B6 heterozygote, or B6/B6 parental genotypes at QTL peak are plotted on the Y-axis. (A) OTU17740. (B) OTU25269. (C) OTU25483. (D) OTU13989. (E) OTU29084. (F) OTU41353. Error bars based on standard error.
Figure 5
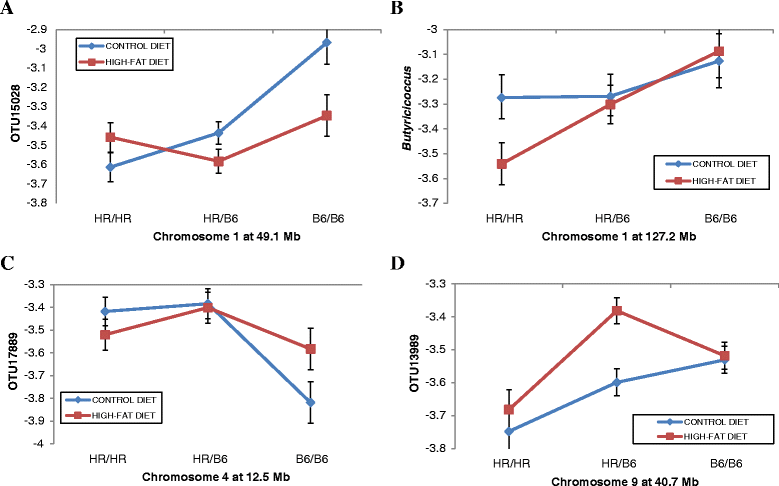
QTL on Chr 1, Chr 4, and Chr 9 show complex patterns of gene X diet interactions. (A-D) Plots of genotypic values at the QTL peak (X axis) are shown for four different OTUs where the QTL shows differential effects depending on whether the G10 mice were fed the control or the high-fat diet. Relative abundances of the OTUs for animals having the HR/HR parental, HR/B6 heterozygote, or B6/B6 parental genotypes at QTL peak are plotted on the Y-axis. (A) QTL for OTU15028 at 49.1 Mb on Chr 1. (B) QTL for Butyricoccus at 127 Mb on Chr 1. (C) QTL for OTU17889 at 12.5 Mb on Chr 4. (D) QTL for OTU13989 at 40.7 Mb on Chr 9. Error bars based on standard error.
Figure 6
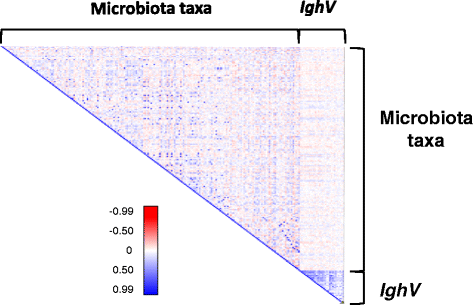
Correlation matrix between microbiota composition and IghV region expression. For each of 308 mice, the relative abundance of 67 IghV regions shared among the expressed IgA population of >75% of the animals and the relative abundance of the most abundant taxon of the microbiota were used to calculate the correlation coefficient (r). Red and blue coloring corresponds to the r value for each pair-wise comparison according to the color gradient.
Similar articles
- Individuality in gut microbiota composition is a complex polygenic trait shaped by multiple environmental and host genetic factors.
Benson AK, Kelly SA, Legge R, Ma F, Low SJ, Kim J, Zhang M, Oh PL, Nehrenberg D, Hua K, Kachman SD, Moriyama EN, Walter J, Peterson DA, Pomp D. Benson AK, et al. Proc Natl Acad Sci U S A. 2010 Nov 2;107(44):18933-8. doi: 10.1073/pnas.1007028107. Epub 2010 Oct 11. Proc Natl Acad Sci U S A. 2010. PMID: 20937875 Free PMC article. - Genome-Wide Association Studies of the Human Gut Microbiota.
Davenport ER, Cusanovich DA, Michelini K, Barreiro LB, Ober C, Gilad Y. Davenport ER, et al. PLoS One. 2015 Nov 3;10(11):e0140301. doi: 10.1371/journal.pone.0140301. eCollection 2015. PLoS One. 2015. PMID: 26528553 Free PMC article. - Influence of early life exposure, host genetics and diet on the mouse gut microbiome and metabolome.
Snijders AM, Langley SA, Kim YM, Brislawn CJ, Noecker C, Zink EM, Fansler SJ, Casey CP, Miller DR, Huang Y, Karpen GH, Celniker SE, Brown JB, Borenstein E, Jansson JK, Metz TO, Mao JH. Snijders AM, et al. Nat Microbiol. 2016 Nov 28;2:16221. doi: 10.1038/nmicrobiol.2016.221. Nat Microbiol. 2016. PMID: 27892936 - Elucidating the role of the host genome in shaping microbiome composition.
Davenport ER. Davenport ER. Gut Microbes. 2016;7(2):178-84. doi: 10.1080/19490976.2016.1155022. Gut Microbes. 2016. PMID: 26939746 Free PMC article. Review. - Gut bacterial microbiota and obesity.
Million M, Lagier JC, Yahav D, Paul M. Million M, et al. Clin Microbiol Infect. 2013 Apr;19(4):305-13. doi: 10.1111/1469-0691.12172. Epub 2013 Mar 2. Clin Microbiol Infect. 2013. PMID: 23452229 Review.
Cited by
- Effect of different genetic backgrounds on rumen microbiota and serum metabolic phenotypes in beef cattle.
Zhao Y, Chen H, Zhao P, Zhang C, Wu Y, Li X, Huangfu M, Chen Z, Wang C, Liu B, Simujide H, Chen A, Sun H. Zhao Y, et al. Sci Rep. 2024 Oct 14;14(1):24005. doi: 10.1038/s41598-024-74988-z. Sci Rep. 2024. PMID: 39402126 Free PMC article. - Risk of bias assessment tool for systematic review and meta-analysis of the gut microbiome.
Lampeter T, Love C, Tang TT, Marella AS, Lee HY, Oganyan A, Moffat D, Kareem A, Rusling M, Massmann A, Orr M, Bongiorno C, Yuan LL. Lampeter T, et al. Gut Microbiome (Camb). 2023 Aug 18;4:e13. doi: 10.1017/gmb.2023.12. eCollection 2023. Gut Microbiome (Camb). 2023. PMID: 39295908 Free PMC article. - The Role of Biogeography in Shaping Intestinal Flora and Influence on Fatty Acid Composition in Red Swamp Crayfish (Procambarus clarkii).
Chen M, Su S, Zhang C, Zhu J, Feng W, Chen H, Jiang J, Lu Z, Liu W, Gan J. Chen M, et al. Microb Ecol. 2023 Nov;86(4):3111-3127. doi: 10.1007/s00248-023-02298-4. Epub 2023 Oct 25. Microb Ecol. 2023. PMID: 37878052 - Analysis of strain, sex, and diet-dependent modulation of gut microbiota reveals candidate keystone organisms driving microbial diversity in response to American and ketogenic diets.
Salvador AC, Huda MN, Arends D, Elsaadi AM, Gacasan CA, Brockmann GA, Valdar W, Bennett BJ, Threadgill DW. Salvador AC, et al. Microbiome. 2023 Oct 3;11(1):220. doi: 10.1186/s40168-023-01588-w. Microbiome. 2023. PMID: 37784178 Free PMC article. - Using the collaborative cross to identify the role of host genetics in defining the murine gut microbiome.
Nagarajan A, Scoggin K, Gupta J, Threadgill DW, Andrews-Polymenis HL. Nagarajan A, et al. Microbiome. 2023 Jul 8;11(1):149. doi: 10.1186/s40168-023-01552-8. Microbiome. 2023. PMID: 37420306 Free PMC article.
References
Publication types
MeSH terms
Substances
LinkOut - more resources
Full Text Sources
Other Literature Sources
Molecular Biology Databases
Miscellaneous
