Network-based metaanalysis identifies HNF4A and PTBP1 as longitudinally dynamic biomarkers for Parkinson's disease - PubMed (original) (raw)
Network-based metaanalysis identifies HNF4A and PTBP1 as longitudinally dynamic biomarkers for Parkinson's disease
Jose A Santiago et al. Proc Natl Acad Sci U S A. 2015.
Abstract
Environmental and genetic factors are likely to be involved in the pathogenesis of Parkinson's disease (PD), the second most prevalent neurodegenerative disease among the elderly. Network-based metaanalysis of four independent microarray studies identified the hepatocyte nuclear factor 4 alpha (HNF4A), a transcription factor associated with gluconeogenesis and diabetes, as a central regulatory hub gene up-regulated in blood of PD patients. In parallel, the polypyrimidine tract binding protein 1 (PTBP1), involved in the stabilization and mRNA translation of insulin, was identified as the most down-regulated gene. Quantitative PCR assays revealed that HNF4A and PTBP1 mRNAs were up- and down-regulated, respectively, in blood of 51 PD patients and 45 controls nested in the Diagnostic and Prognostic Biomarkers for Parkinson's Disease. These results were confirmed in blood of 50 PD patients compared with 46 healthy controls nested in the Harvard Biomarker Study. Relative abundance of HNF4A mRNA correlated with the Hoehn and Yahr stage at baseline, suggesting its clinical utility to monitor disease severity. Using both markers, PD patients were classified with 90% sensitivity and 80% specificity. Longitudinal performance analysis demonstrated that relative abundance of HNF4A and PTBP1 mRNAs significantly decreased and increased, respectively, in PD patients during the 3-y follow-up period. The inverse regulation of HNF4A and PTBP1 provides a molecular rationale for the altered insulin signaling observed in PD patients. The longitudinally dynamic biomarkers identified in this study may be useful for monitoring disease-modifying therapies for PD.
Keywords: HNF4A; PTBP1; Parkinson's disease; blood biomarkers; network analysis.
Conflict of interest statement
The authors declare no conflict of interest.
Figures
Fig. 1.
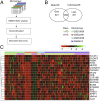
Network-based and transcriptomic metaanalysis. (A) Four independent microarray datasets were downloaded from the GEO and preprocessed in INMEX where metaanalysis was undertaken using the Fisher’s method. Datasets were subsequently uploaded into NetworkAnalyst to perform network and functional analysis and to identify key regulatory hub genes across the multiple microarray studies. Finally, the most significant genes were evaluated as biomakers for PD in blood samples obtained from two independent cohorts of patients. (B) Venn diagram of differentially expressed genes identified from the metaanalysis (Meta-DE) and those from each individual microarray analysis (Individual-DE). (C) Heat map representation of the top 20 differentially expressed genes across different microarrays identified from the metaanalysis (row-wise comparison). The heat map was rescaled to prevent domination by study-specific effects. HC, healthy controls; PD, Parkinson’s disease.
Fig. 2.
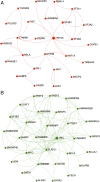
Network analysis of differentially expressed genes in blood of PD patients. (A) Zero-order interaction network of genes up-regulated in blood of PD patients (red). (B) Zero-order interaction network of genes down-regulated in blood of PD patients (green).
Fig. 3.
Evaluation of HNF4A and PTBP1 mRNAs as biomarkers for PD at baseline. (A) Relative abundance of HNF4A mRNA in blood of PD patients (black circles) compared with HCs (white circles) in samples from the PROBE cohort. (B) Replication of biomarker expression in an independent set of samples from patients enrolled in the HBS study. (C) Relative abundance of PTBP1 mRNA in blood of PD patients compared with HC in samples from the PROBE cohort. (D) Replication of PTBP1 mRNA expression in an independent set of samples from patients enrolled in the HBS study. Relative abundance of each biomarker was calculated using GAPDH as a reference gene and HC as calibrator. A Student t test (two-tailed) was used to estimate the significance between PD cases and controls. Error bars represent 95% confidence intervals.
Fig. 4.
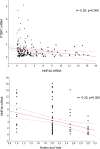
Biomarker correlation analysis. (Upper) Pearson correlation analysis between HNF4A mRNA and PTBP1 mRNA in blood of PD patients (black circles) and HC (white circles) in samples from PROBE and HBS. (Lower) Correlation analysis between HNF4A mRNA and Hoehn and Yahr scale in PD patients from both cohorts. Solid lines represent the linear regression of the data and dashed lines indicate the 95% confidence of intervals.
Fig. 5.
Longitudinal performance of HNF4A and PTBP1 mRNAs in the HBS study. (A) Individual trajectories for the relative abundance of HNF4A mRNA over time for HC (blue) and PD patients (red) in the HBS study. (B) Average HNF4A mRNA expression in PD patients compared with HCs calculated via linear mixed-effects regression analysis adjusting for sex, age, and BMI. (C) Individual trajectories for the relative abundance of PTBP1 mRNA over time for HCs and PD patients. (D) Average PTBP1 mRNA expression in PD patients compared with HCs calculated via linear mixed-effects regression analysis. Red and blue lines denote PD patients and HCs, respectively. T0 and T2 indicate baseline and 3-y follow-up period, respectively. Post hoc pair-wise comparisons were performed using a Tukey test (**P = 0.0001, *P = 0.001). Error bars represent SE.
Comment in
- Reply to Toker and Pavlidis: Blood biomarkers for Parkinson's disease.
Santiago JA, Potashkin JA. Santiago JA, et al. Proc Natl Acad Sci U S A. 2015 Jul 14;112(28):E3638. doi: 10.1073/pnas.1508415112. Epub 2015 Jun 23. Proc Natl Acad Sci U S A. 2015. PMID: 26106166 Free PMC article. No abstract available. - Metaanalysis of flawed expression profiling data leading to erroneous Parkinson's biomarker identification.
Toker L, Pavlidis P. Toker L, et al. Proc Natl Acad Sci U S A. 2015 Jul 14;112(28):E3637. doi: 10.1073/pnas.1507563112. Epub 2015 Jun 23. Proc Natl Acad Sci U S A. 2015. PMID: 26106167 Free PMC article. No abstract available. - Reply to Liu et al.: HNF4A and PTBP1 expression in the brain of neurodegenerative disease patients.
Santiago JA, Potashkin JA. Santiago JA, et al. Proc Natl Acad Sci U S A. 2015 Jul 28;112(30):E3976. doi: 10.1073/pnas.1510113112. Epub 2015 Jun 29. Proc Natl Acad Sci U S A. 2015. PMID: 26124150 Free PMC article. No abstract available. - Expression quantitative trait loci regulate HNF4A and PTBP1 expression in human brains.
Liu G, Bao X, Wang R. Liu G, et al. Proc Natl Acad Sci U S A. 2015 Jul 28;112(30):E3975. doi: 10.1073/pnas.1509048112. Epub 2015 Jun 29. Proc Natl Acad Sci U S A. 2015. PMID: 26124151 Free PMC article. No abstract available.
Similar articles
- Reply to Liu et al.: HNF4A and PTBP1 expression in the brain of neurodegenerative disease patients.
Santiago JA, Potashkin JA. Santiago JA, et al. Proc Natl Acad Sci U S A. 2015 Jul 28;112(30):E3976. doi: 10.1073/pnas.1510113112. Epub 2015 Jun 29. Proc Natl Acad Sci U S A. 2015. PMID: 26124150 Free PMC article. No abstract available. - Expression quantitative trait loci regulate HNF4A and PTBP1 expression in human brains.
Liu G, Bao X, Wang R. Liu G, et al. Proc Natl Acad Sci U S A. 2015 Jul 28;112(30):E3975. doi: 10.1073/pnas.1509048112. Epub 2015 Jun 29. Proc Natl Acad Sci U S A. 2015. PMID: 26124151 Free PMC article. No abstract available. - Metaanalysis of flawed expression profiling data leading to erroneous Parkinson's biomarker identification.
Toker L, Pavlidis P. Toker L, et al. Proc Natl Acad Sci U S A. 2015 Jul 14;112(28):E3637. doi: 10.1073/pnas.1507563112. Epub 2015 Jun 23. Proc Natl Acad Sci U S A. 2015. PMID: 26106167 Free PMC article. No abstract available. - PTBP1 as a potential regulator of disease.
Yu Q, Wu T, Xu W, Wei J, Zhao A, Wang M, Li M, Chi G. Yu Q, et al. Mol Cell Biochem. 2024 Nov;479(11):2875-2894. doi: 10.1007/s11010-023-04905-x. Epub 2023 Dec 22. Mol Cell Biochem. 2024. PMID: 38129625 Review. - Controversies and insights into PTBP1-related astrocyte-neuron transdifferentiation: neuronal regeneration strategies for Parkinson's and Alzheimer's disease.
McDowall S, Bagda V, Hodgetts S, Mastaglia F, Li D. McDowall S, et al. Transl Neurodegener. 2024 Dec 3;13(1):59. doi: 10.1186/s40035-024-00450-9. Transl Neurodegener. 2024. PMID: 39627843 Free PMC article. Review.
Cited by
- Prognosis prediction model for conversion from mild cognitive impairment to Alzheimer's disease created by integrative analysis of multi-omics data.
Shigemizu D, Akiyama S, Higaki S, Sugimoto T, Sakurai T, Boroevich KA, Sharma A, Tsunoda T, Ochiya T, Niida S, Ozaki K. Shigemizu D, et al. Alzheimers Res Ther. 2020 Nov 10;12(1):145. doi: 10.1186/s13195-020-00716-0. Alzheimers Res Ther. 2020. PMID: 33172501 Free PMC article. - Genome-wide expression and response to exposure-based psychological therapy for anxiety disorders.
Roberts S, Wong CCY, Breen G, Coleman JRI, De Jong S, Jöhren P, Keers R, Curtis C, Lee SH, Margraf J, Schneider S, Teismann T, Wannemüller A, Lester KJ, Eley TC. Roberts S, et al. Transl Psychiatry. 2017 Aug 29;7(8):e1219. doi: 10.1038/tp.2017.177. Transl Psychiatry. 2017. PMID: 28850109 Free PMC article. - Co-Expression Network Analysis Identifies Molecular Determinants of Loneliness Associated with Neuropsychiatric and Neurodegenerative Diseases.
Santiago JA, Quinn JP, Potashkin JA. Santiago JA, et al. Int J Mol Sci. 2023 Mar 21;24(6):5909. doi: 10.3390/ijms24065909. Int J Mol Sci. 2023. PMID: 36982982 Free PMC article. - dbMDEGA: a database for meta-analysis of differentially expressed genes in autism spectrum disorder.
Zhang S, Deng L, Jia Q, Huang S, Gu J, Zhou F, Gao M, Sun X, Feng C, Fan G. Zhang S, et al. BMC Bioinformatics. 2017 Nov 16;18(1):494. doi: 10.1186/s12859-017-1915-2. BMC Bioinformatics. 2017. PMID: 29145823 Free PMC article. - Biological and Clinical Implications of Comorbidities in Parkinson's Disease.
Santiago JA, Bottero V, Potashkin JA. Santiago JA, et al. Front Aging Neurosci. 2017 Dec 4;9:394. doi: 10.3389/fnagi.2017.00394. eCollection 2017. Front Aging Neurosci. 2017. PMID: 29255414 Free PMC article. Review.
References
Publication types
MeSH terms
Substances
Grants and funding
- P01 NS058793/NS/NINDS NIH HHS/United States
- U01 NS082157/NS/NINDS NIH HHS/United States
- R01 AG044113/AG/NIA NIH HHS/United States
- U01 AT000613/AT/NCCIH NIH HHS/United States
- R01 NS064155/NS/NINDS NIH HHS/United States
LinkOut - more resources
Full Text Sources
Other Literature Sources
Medical
Molecular Biology Databases
Research Materials


