Positive Selection Drives Preferred Segment Combinations during Influenza Virus Reassortment - PubMed (original) (raw)
. 2015 Jun;32(6):1519-32.
doi: 10.1093/molbev/msv044. Epub 2015 Feb 23.
Ping Liu 2, Nicholas Renzette 3, Matthieu Foll 4, Serena T Pham 2, Sergey V Venev 1, Glen R Gallagher 2, Daniel N Bolon 5, Evelyn A Kurt-Jones 2, Jeffrey D Jensen 4, Daniel R Caffrey 2, Celia A Schiffer 5, Timothy F Kowalik 3, Jennifer P Wang 6, Robert W Finberg 2
Affiliations
- PMID: 25713211
- PMCID: PMC4462674
- DOI: 10.1093/molbev/msv044
Positive Selection Drives Preferred Segment Combinations during Influenza Virus Reassortment
Konstantin B Zeldovich et al. Mol Biol Evol. 2015 Jun.
Abstract
Influenza A virus (IAV) has a segmented genome that allows for the exchange of genome segments between different strains. This reassortment accelerates evolution by breaking linkage, helping IAV cross species barriers to potentially create highly virulent strains. Challenges associated with monitoring the process of reassortment in molecular detail have limited our understanding of its evolutionary implications. We applied a novel deep sequencing approach with quantitative analysis to assess the in vitro temporal evolution of genomic reassortment in IAV. The combination of H1N1 and H3N2 strains reproducibly generated a new H1N2 strain with the hemagglutinin and nucleoprotein segments originating from H1N1 and the remaining six segments from H3N2. By deep sequencing the entire viral genome, we monitored the evolution of reassortment, quantifying the relative abundance of all IAV genome segments from the two parent strains over time and measuring the selection coefficients of the reassorting segments. Additionally, we observed several mutations coemerging with reassortment that were not found during passaging of pure parental IAV strains. Our results demonstrate how reassortment of the segmented genome can accelerate viral evolution in IAV, potentially enabled by the emergence of a small number of individual mutations.
Keywords: deep sequencing; evolution; influenza; mutations; reassortment.
© The Author 2015. Published by Oxford University Press on behalf of the Society for Molecular Biology and Evolution. All rights reserved. For permissions, please e-mail: journals.permissions@oup.com.
Figures
Fig. 1.
Schematic of the serial passage experimental design. Pure strains of A/Brisbane/59/2007 (B59, H1N1) and A/Brisbane/10/2007 (B10, H3N2) were combined at a 1:1 ratio for a total MOI of 0.001 for the passage 1 (P1) reassortant in MDCK cells (black) and six additional passages were conducted in MDCK cells. In parallel, pure strains of B59 (red) and B10 (blue) were separately passaged following the same protocol.
Fig. 2.
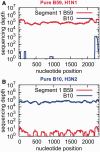
Minimal cross-mapping is observed between pure strains of B10 (H3N2) and B59 (H1N1). (A) The sequencing depth for a B59 (H1N1) sample, segment 1, mapped to both the B59 (H1N1) and B10 (H3N2) genomes. Mapping to B59 produces a very high sequencing depth, whereas mapping to B10 is negligible. (B) The mapping of the B10 (H3N2) segment 1 to both the B59 (H1N1) and B10 (H3N2) genomes. The low degree of cross-mapping allows for accurate measurement of the relative abundance of each segment in the viral mixture. Data from passage 4 are shown.
Fig. 3.
Sequencing depth quantitatively reflects the relative abundance of viral RNA. A calibration curve was generated by extracting viral RNA from pure strains of B10 (H3N2) and B59 (H1N1) influenza virus and mixing at ratios of 1,000:1, 100:1, 10:1, 1:1, 1:10, 1:100, and 1:1,000, plotted on the _x_-axis as log10[H3N2]/[H1N1]. The ratio of the sequencing depths for the B10 (H3N2) and B59 (H1N1) viral RNAs is plotted on the _y_-axis on a log10 scale as log10[depthH3N2]/[depthH1N1]. A nearly perfect linear relationship allows extraction of the segment abundance ratio from the ratio of sequencing depths. PB2, polymerase basic 2; PB1/PB1-F2, polymerase basic 1; PA, polymerase acidic; M1/M2, matrix 1/matrix 2; NS1/NEP, nonstructural protein 1/nuclear export protein.
Fig. 4.
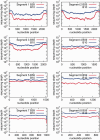
Raw sequencing depth of all segments for a reassortant sample at passage 1 in MDCK cells. The sequenced viral populations mainly consist of the B10 (H3N2) strain (blue) in comparison to the B59 (H1N1) strain (red). The sequencing depths are shown on the _y_-axis, and each nucleotide position is represented on the _x_-axis. Data from Experiment 2 are shown.
Fig. 5.
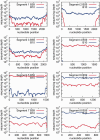
Raw sequencing depth of all segments for a reassortant sample at passage 7 in MDCK cells. By passage 7, the depths for segments 4 and 5 become inverted compared with passage 1 and are predominately from the B59 (H1N1) strain (red). The other six segments continue to be largely derived from the B10 (H3N2) strain (blue), indicating the emergence of a well-defined H1N2 reassortant strain. Data from Experiment 2 are shown.
Fig. 6.
Evolution of the relative abundances of the eight influenza virus genome segments over seven passages in four independent reassortment experiments. The frequency of sequences derived from B59 (H1N1) virus for each segment in the four experiments is plotted against passage number. The experiment number is indicated in the upper left hand corner of each panel. For all experiments, the frequency of B59 (H1N1) is low in early passages, so B10 (H3N2) dominates for all eight segments in the populations. Over the seven passages, the frequencies of six segments of B10 (H3N2) remain nearly constant whereas segment 4 (HA) and segment 5 (NP) of B10 are progressively replaced in the population by the segments from the B59 (H1N1) virus. PB2, polymerase basic 2; PB1/PB1-F2, polymerase basic 1; PA, polymerase acidic; M1/M2, matrix 1/matrix 2; NS1/NEP, nonstructural protein 1/nuclear export protein.
Fig. 7.
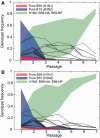
Frequency ranges for the pure B59 genotype (red), pure B10 genotype (blue), and H1N2 genotype with B59-HA, B59-NP (green) for the seven passages of Experiments 2 (A) and 4 (B). The frequency ranges have been determined from population-level segment frequencies using a novel linear programming method (see Materials and Methods). The maximum frequencies of other 253 genotypes are shown as black lines. In these experiments, the H1N2 genotype with B59-HA, B59-NP is the most prevalent genotype at P7, with the average frequency above 78% and a narrow range of possible frequencies irrespective of segment linkage patterns.
Fig. 8.
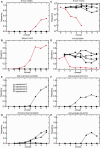
Differing mutational trajectories between passaging of reassortants and pure strains. (A, B) Frequencies of B10:s2:T1960C and B59:s3:C197G mutations during passaging of the pure strain (red) and the four reassortment experiments (black) are plotted against the passage number. The mutations become fixed in the pure strain but fail to reach significant frequencies during reassortment. (C, D) Frequencies of the B10:s3:T1379A and B10:s8:G289A polymorphisms demonstrate the opposite behavior, being present at very low frequencies in the pure strains, and at high frequencies in all four reassortment experiments. Passage 0 denotes the original virus grown in egg. Passages 1–7 were performed in MDCK cells. Missing or unconnected points on the logarithmic scale plot (C) correspond to zero frequency of the mutations. (E–H) Frequencies of select mutations observed in one or more reassortment experiments, but not during passaging of the corresponding pure strain. The frequencies of these mutations in the pure strains were either zero or negligible.
Fig. 9.
Replication kinetics of pure and reassortant viruses. Multistep growth curves for the passage 7 (P7) pure B59 (H1N1) and B10 (H3N2) viruses, as well as the P7 reassortant pool from Experiment 2, in MDCK cells are shown. Confluent cells were infected with viruses at an MOI of 0.0005 PFU/cell. The virus yield was titered in MDCK cells at 12, 24, and 48 h post-infection (pi). Each data point represents viral yield (PFU/ml ± S.E.M.). Data are combined from two independent experiments using P7 reassortant generated from Experiment 2. The reassortant virus titer is an order of magnitude higher (*, P < 0.05) compared to the value for each parent virus.
Similar articles
- Heterologous Packaging Signals on Segment 4, but Not Segment 6 or Segment 8, Limit Influenza A Virus Reassortment.
White MC, Steel J, Lowen AC. White MC, et al. J Virol. 2017 May 12;91(11):e00195-17. doi: 10.1128/JVI.00195-17. Print 2017 Jun 1. J Virol. 2017. PMID: 28331085 Free PMC article. - Seasonal H3N2 and 2009 Pandemic H1N1 Influenza A Viruses Reassort Efficiently but Produce Attenuated Progeny.
Phipps KL, Marshall N, Tao H, Danzy S, Onuoha N, Steel J, Lowen AC. Phipps KL, et al. J Virol. 2017 Aug 10;91(17):e00830-17. doi: 10.1128/JVI.00830-17. Print 2017 Sep 1. J Virol. 2017. PMID: 28637755 Free PMC article. - Parallel evolution between genomic segments of seasonal human influenza viruses reveals RNA-RNA relationships.
Jones JE, Le Sage V, Padovani GH, Calderon M, Wright ES, Lakdawala SS. Jones JE, et al. Elife. 2021 Aug 27;10:e66525. doi: 10.7554/eLife.66525. Elife. 2021. PMID: 34448455 Free PMC article. - Implications of segment mismatch for influenza A virus evolution.
White MC, Lowen AC. White MC, et al. J Gen Virol. 2018 Jan;99(1):3-16. doi: 10.1099/jgv.0.000989. Epub 2017 Dec 15. J Gen Virol. 2018. PMID: 29244017 Free PMC article. Review. - Constraints, Drivers, and Implications of Influenza A Virus Reassortment.
Lowen AC. Lowen AC. Annu Rev Virol. 2017 Sep 29;4(1):105-121. doi: 10.1146/annurev-virology-101416-041726. Epub 2017 May 26. Annu Rev Virol. 2017. PMID: 28548881 Review.
Cited by
- Mutations in Influenza A Virus Neuraminidase and Hemagglutinin Confer Resistance against a Broadly Neutralizing Hemagglutinin Stem Antibody.
Prachanronarong KL, Canale AS, Liu P, Somasundaran M, Hou S, Poh YP, Han T, Zhu Q, Renzette N, Zeldovich KB, Kowalik TF, Kurt-Yilmaz N, Jensen JD, Bolon DNA, Marasco WA, Finberg RW, Schiffer CA, Wang JP. Prachanronarong KL, et al. J Virol. 2019 Jan 4;93(2):e01639-18. doi: 10.1128/JVI.01639-18. Print 2019 Jan 15. J Virol. 2019. PMID: 30381484 Free PMC article. - Intragenic recombination influences rotavirus diversity and evolution.
Hoxie I, Dennehy JJ. Hoxie I, et al. Virus Evol. 2020 Jan 13;6(1):vez059. doi: 10.1093/ve/vez059. eCollection 2020 Jan. Virus Evol. 2020. PMID: 31949920 Free PMC article. - Host proteostasis modulates influenza evolution.
Phillips AM, Gonzalez LO, Nekongo EE, Ponomarenko AI, McHugh SM, Butty VL, Levine SS, Lin YS, Mirny LA, Shoulders MD. Phillips AM, et al. Elife. 2017 Sep 26;6:e28652. doi: 10.7554/eLife.28652. Elife. 2017. PMID: 28949290 Free PMC article. - Influenza A virus preferentially snatches noncoding RNA caps.
Gu W, Gallagher GR, Dai W, Liu P, Li R, Trombly MI, Gammon DB, Mello CC, Wang JP, Finberg RW. Gu W, et al. RNA. 2015 Dec;21(12):2067-75. doi: 10.1261/rna.054221.115. Epub 2015 Oct 1. RNA. 2015. PMID: 26428694 Free PMC article. - Evolutionary conservation and positive selection of influenza A nucleoprotein CTL epitopes for universal vaccination.
McGee MC, Huang W. McGee MC, et al. J Med Virol. 2022 Jun;94(6):2578-2587. doi: 10.1002/jmv.27662. Epub 2022 Feb 26. J Med Virol. 2022. PMID: 35171514 Free PMC article.
References
- Altschul SF, Gish W, Miller W, Myers EW, Lipman DJ. Basic local alignment search tool. J Mol Biol. 1990;215:403–410. - PubMed
- Barton NH, Charlesworth B. Why sex and recombination? Science. 1998;281:1986–1990. - PubMed
Publication types
MeSH terms
Substances
LinkOut - more resources
Full Text Sources
Other Literature Sources

