The BioPlex Network: A Systematic Exploration of the Human Interactome - PubMed (original) (raw)
. 2015 Jul 16;162(2):425-440.
doi: 10.1016/j.cell.2015.06.043.
Lily Ting 1, Raphael J Bruckner 1, Fana Gebreab 1, Melanie P Gygi 1, John Szpyt 1, Stanley Tam 1, Gabriela Zarraga 1, Greg Colby 1, Kurt Baltier 1, Rui Dong 2, Virginia Guarani 1, Laura Pontano Vaites 1, Alban Ordureau 1, Ramin Rad 1, Brian K Erickson 1, Martin Wühr 1, Joel Chick 1, Bo Zhai 1, Deepak Kolippakkam 1, Julian Mintseris 1, Robert A Obar 3, Tim Harris 4, Spyros Artavanis-Tsakonas 3, Mathew E Sowa 1, Pietro De Camilli 2, Joao A Paulo 1, J Wade Harper 5, Steven P Gygi 6
Affiliations
- PMID: 26186194
- PMCID: PMC4617211
- DOI: 10.1016/j.cell.2015.06.043
The BioPlex Network: A Systematic Exploration of the Human Interactome
Edward L Huttlin et al. Cell. 2015.
Abstract
Protein interactions form a network whose structure drives cellular function and whose organization informs biological inquiry. Using high-throughput affinity-purification mass spectrometry, we identify interacting partners for 2,594 human proteins in HEK293T cells. The resulting network (BioPlex) contains 23,744 interactions among 7,668 proteins with 86% previously undocumented. BioPlex accurately depicts known complexes, attaining 80%-100% coverage for most CORUM complexes. The network readily subdivides into communities that correspond to complexes or clusters of functionally related proteins. More generally, network architecture reflects cellular localization, biological process, and molecular function, enabling functional characterization of thousands of proteins. Network structure also reveals associations among thousands of protein domains, suggesting a basis for examining structurally related proteins. Finally, BioPlex, in combination with other approaches, can be used to reveal interactions of biological or clinical significance. For example, mutations in the membrane protein VAPB implicated in familial amyotrophic lateral sclerosis perturb a defined community of interactors.
Copyright © 2015 Elsevier Inc. All rights reserved.
Figures
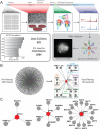
Figure 1. High-Throughput Interaction Mapping via AP-MS
(A) AP-MS platform: 1) A lentiviral library of 13,000 FLAG-HA-tagged ORFs was constructed from the Human ORFEOME; 2) 293T cells were infected and expanded under puromycin selection; 3) Baits and preys were immuno-purified; 4) tryptic digests were analyzed in technical duplicate by LC-MS; 5) Proteins were identified and specific interactors found; 6) Interactions were assembled to model the human interactome. Up to 600 AP-MS experiments may be completed per month. (B) CompPASS-Plus extracts 16 interactors for bait CDK1 from a background of nearly 500 proteins. (C) Interaction maps for baits XRCC2, EIF4E, and SEPT1 (red). Nearly all interactions have been previously described. Interactors were identified from backgrounds of 487, 778, and 749 proteins, respectively.
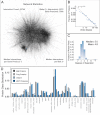
Figure 2. BioPlex Network Properties
(A) BioPlex. The largest component is depicted. (B) Vertex degree distribution of all proteins in BioPlex. The dashed line represents the best fit power law (see Extended Experimental Procedures). (C) Histogram depicting the number of degrees separating all protein pairs. (D) Functional classifications of baits and preys assigned by PANTHER and compared against the functional distributions of our HEK293T proteome and the entire human UniProt proteome.
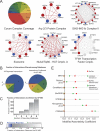
Figure 3. Evaluation of AP-MS Protein Interactions
(A) AP-MS interactions superimposed onto CORUM complexes. The pie chart depicts the fraction of complexes achieving the indicated coverage in BioPlex. Only complexes containing two or more baits were considered. Five representative CORUM complexes: baits are colored blue, while preys are red and proteins not observed by AP-MS are gray. Interactions among CORUM complex members are gray while interactions confirmed by AP-MS are red. (B) Physical protein interactions reported in BioGrid, CORUM, GeneMania, STRING, and MINT were merged. Left: overlap among databases. Right: overlap among databases for interactions confirmed by AP-MS. (C) Fraction of database interactions confirmed by AP-MS as a function of the number of supporting database reports. The composite interaction database was filtered to include only interactions connecting one of 2594 baits with proteins observed as baits or preys in the interaction network. (D) 86% of AP-MS interactions have not been reported in the databases listed above. (E) Pairwise comparisons of BioPlex with published interaction networks were performed, using graph assortativity to quantify preferential interaction in cases of shared localization among proteins detected in both networks. Literature datasets included BioGRID, CORUM, GeneMania, STRING, and MINT, as well as interactions recently reported via yeast-two-hybrid (Rolland et al., 2014) and LC-MS correlation profiling (Havugimana et al., 2012). Each analysis was repeated with randomized localizations as a control.
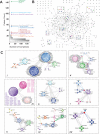
Figure 4. Community Analysis of the AP-MS Interactome
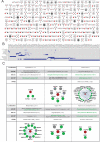
(A) BioPlex communities: 256 initial communities were identified via 3-clique percolation and sub-divided via modularity-based clustering, resulting in 354 communities. (B) Network of communities. Gray circles represent 354 BioPlex communities; circle size is proportional to the number of member proteins. Gray edges connect communities that share a common protein or were initially classified as a single community and were sub-divided via modularity-based clustering. Labeled boxes highlight communities expanded in part C. (C) Each box depicts communities highlighted in part B at resolution sufficient to observe individual interactions. Proteins are grouped by community membership; communities that initially clustered together and subsequently split are rendered in similar hues; proteins shared among clusters are red. Interactions that span multiple communities are gray while interactions among members of a community share the color of that cluster.
Figure 5. Detection of Associations Including Domains of Unknown Function
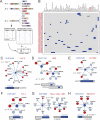
(A) After mapping Pfam domains onto BioPlex, the numbers of proteins containing each domain were tallied. Numbers of interactions that linked one domain with another were also determined. Contingency tables were then populated relating observation of one domain with the other, and Fisher's Exact Test determined the likelihood of a non-random association between the two domains. This process was repeated for all domain pairs and p-values were adjusted for multiple hypothesis testing (Benjamini and Hochberg, 1995). (B) Heat map depicting significant domain associations involving domains of unknown function (highlighted in red). Blue boxes label domain pairs that associate at a 1% FDR. Labels indicate domain associations highlighted in C-H. (C-H) Interaction networks corresponding to associated domain pairs. Blue vertices match proteins that contain the indicated domains of unknown function, while red vertices indicate proteins containing the associated domain; gray nodes match neither domain. P-values were determined by Fisher's Exact Test with multiple testing correction. Schematics depicting the domain structure of each central protein are displayed below each network.
Figure 6. BioPlex Topology Aids Unknown Protein Characterization
(A) Network maps displaying interacting partners (gray) for 271 proteins assigned generic names based on chromosome and open reading frame position (red). Most are uncharacterized. (B) Expected subcellular localizations for 117 of 271 uncharacterized ORFs, based on localization enrichment among the protein's primary and secondary neighbors. (C) Networks surrounding 6 uncharacterized proteins and listing enriched GO terms, Pfam domains, and subcellular localizations. P-values were determined by Fisher's Exact Test with multiple testing correction. Red nodes: open reading frames; green nodes: neighboring proteins that match the enriched term highlighted with green text.
Figure 7. Quantitative Interaction Proteomics of the VAPB Network Reveals Differential Interactions for VAPB Variants Associated with ALS
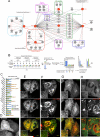
(A) BioPlex interaction network for VAPA, VAPB and associated proteins. Dotted red lines: interactions reported by BioGRID; solid black lines: BioPlex interactions. (B,C) Overview of our TMT approach for examining how ALS-associated mutations in VAPB affect interaction partners. VAPB and its variants were stably expressed in SH-SY5Y cells as FLAG-HA-tagged fusion proteins and subjected to AP-MS. Triplicate purifications were digested with trypsin prior to reaction with isobaric tag reagents. TMT reporter ion intensities were extracted from MS3 spectra and combined to determine changes in association of individual proteins with VAPB (panel B). Relative intensities for VAPB and VAPB mutant interacting proteins are shown in panel C. Error bars represent mean +/− standard error. Numbers of peptides quantified for each protein are listed in parentheses. (D) Confocal image of HeLa cells expressing EGFP-LSG1 alone. When expressed at low/moderate level (cell with the single white asterisk) LSG1 localizes in a reticular compartment reminiscent of the ER (high magnification in the inset printed at higher contrast). When expressed at very high level (cell with two black asterisks) a diffuse cytosolic distribution prevails possibly due to saturation of ER binding sites. Scale bar: 10 μm. (E,F) Fluorescence images of HeLa cells co-expressing EGFP-LSG1 with mCherry-tagged VAPB variants. (E) Upon co-expression of wild type VAPB, LSG1 is recruited to the ER. (F) VAPBP56S forms aggregates and only weakly localizes to the ER. Even in these cells LSG1 colocalizes with VAPB, although preferentially with the small pool of VAPBP56S which retains a reticular (ER) distribution. (G,H) Fluorescence images of HeLa cells coexpressing EGFP-OSBP with mCherry-tagged VAPB variants. (G) When co-expressed with VAPBWT, OSBP is recruited to the ER. (H) OSBP has a diffuse cytosolic distribution when coexpressed with VAPBP56S, which lacks a functional FFAT binding site.
Similar articles
- Architecture of the human interactome defines protein communities and disease networks.
Huttlin EL, Bruckner RJ, Paulo JA, Cannon JR, Ting L, Baltier K, Colby G, Gebreab F, Gygi MP, Parzen H, Szpyt J, Tam S, Zarraga G, Pontano-Vaites L, Swarup S, White AE, Schweppe DK, Rad R, Erickson BK, Obar RA, Guruharsha KG, Li K, Artavanis-Tsakonas S, Gygi SP, Harper JW. Huttlin EL, et al. Nature. 2017 May 25;545(7655):505-509. doi: 10.1038/nature22366. Epub 2017 May 17. Nature. 2017. PMID: 28514442 Free PMC article. - Dual proteome-scale networks reveal cell-specific remodeling of the human interactome.
Huttlin EL, Bruckner RJ, Navarrete-Perea J, Cannon JR, Baltier K, Gebreab F, Gygi MP, Thornock A, Zarraga G, Tam S, Szpyt J, Gassaway BM, Panov A, Parzen H, Fu S, Golbazi A, Maenpaa E, Stricker K, Guha Thakurta S, Zhang T, Rad R, Pan J, Nusinow DP, Paulo JA, Schweppe DK, Vaites LP, Harper JW, Gygi SP. Huttlin EL, et al. Cell. 2021 May 27;184(11):3022-3040.e28. doi: 10.1016/j.cell.2021.04.011. Epub 2021 May 6. Cell. 2021. PMID: 33961781 Free PMC article. - BioPlex Display: An Interactive Suite for Large-Scale AP-MS Protein-Protein Interaction Data.
Schweppe DK, Huttlin EL, Harper JW, Gygi SP. Schweppe DK, et al. J Proteome Res. 2018 Jan 5;17(1):722-726. doi: 10.1021/acs.jproteome.7b00572. Epub 2017 Oct 31. J Proteome Res. 2018. PMID: 29054129 Free PMC article. - Unraveling the dynamics of protein interactions with quantitative mass spectrometry.
Ramisetty SR, Washburn MP. Ramisetty SR, et al. Crit Rev Biochem Mol Biol. 2011 Jun;46(3):216-28. doi: 10.3109/10409238.2011.567244. Epub 2011 Mar 26. Crit Rev Biochem Mol Biol. 2011. PMID: 21438726 Review. - Characterizing Protein-Protein Interactions Using Mass Spectrometry: Challenges and Opportunities.
Smits AH, Vermeulen M. Smits AH, et al. Trends Biotechnol. 2016 Oct;34(10):825-834. doi: 10.1016/j.tibtech.2016.02.014. Epub 2016 Mar 17. Trends Biotechnol. 2016. PMID: 26996615 Review.
Cited by
- Novel role for Ddx39 in differentiation and telomere length regulation of embryonic stem cells.
Nai S, Wang M, Yang J, Ling B, Dong Q, Yang X, Du X, Lu M, Liu L, Yu Z, Chen L. Nai S, et al. Cell Death Differ. 2024 Nov;31(11):1534-1544. doi: 10.1038/s41418-024-01354-x. Epub 2024 Aug 6. Cell Death Differ. 2024. PMID: 39107495 - Experimental Approaches in Delineating mTOR Signaling.
Qian J, Su S, Liu P. Qian J, et al. Genes (Basel). 2020 Jul 2;11(7):738. doi: 10.3390/genes11070738. Genes (Basel). 2020. PMID: 32630768 Free PMC article. Review. - Stable preparations of tyrosine hydroxylase provide the solution structure of the full-length enzyme.
Bezem MT, Baumann A, Skjærven L, Meyer R, Kursula P, Martinez A, Flydal MI. Bezem MT, et al. Sci Rep. 2016 Jul 27;6:30390. doi: 10.1038/srep30390. Sci Rep. 2016. PMID: 27462005 Free PMC article. - Prediction and validation of host-pathogen interactions by a versatile inference approach using Aspergillus fumigatus as a case study.
Balkenhol J, Bencurova E, Gupta SK, Schmidt H, Heinekamp T, Brakhage A, Pottikkadavath A, Dandekar T. Balkenhol J, et al. Comput Struct Biotechnol J. 2022 Aug 5;20:4225-4237. doi: 10.1016/j.csbj.2022.07.050. eCollection 2022. Comput Struct Biotechnol J. 2022. PMID: 36051885 Free PMC article. - Progranulin promotes peripheral nerve regeneration and reinnervation: role of notch signaling.
Altmann C, Vasic V, Hardt S, Heidler J, Häussler A, Wittig I, Schmidt MHH, Tegeder I. Altmann C, et al. Mol Neurodegener. 2016 Oct 22;11(1):69. doi: 10.1186/s13024-016-0132-1. Mol Neurodegener. 2016. PMID: 27770818 Free PMC article.
References
- Babu M, Vlasblom J, Pu S, Guo X, Graham C, Bean BD, Burston HE, Vizeacoumar FJ, Snider J, Phanse S, et al. Interaction landscape of membrane-protein complexes in Saccharomyces cerevisiae. Nature. 2012;489:585–589. - PubMed
- Barabasi AL, Albert R. Emergence of scaling in random networks. Science. 1999;286:509–512. - PubMed
- Benjamini Y, Hochberg Y. Controlling the False Discovery Rate: a Practical and Powerful Approach to Multiple Testing. J Royal Stat Soc Series B. 1995;57:289–300.
Publication types
MeSH terms
Substances
Grants and funding
- K01 DK098285/DK/NIDDK NIH HHS/United States
- U41 HG006673/HG/NHGRI NIH HHS/United States
- Howard Hughes Medical Institute/United States
- K01DK098285/DK/NIDDK NIH HHS/United States
- R37NS036251/NS/NINDS NIH HHS/United States
- R37 NS036251/NS/NINDS NIH HHS/United States
LinkOut - more resources
Full Text Sources
Other Literature Sources
