Melatonin decreases breast cancer metastasis by modulating Rho-associated kinase protein-1 expression - PubMed (original) (raw)
doi: 10.1111/jpi.12270. Epub 2015 Oct 20.
Ali Syed Arbab 2, Gabriela Bottaro Gelaleti 1 3, Lívia Carvalho Ferreira 1 3, Marina Gobbe Moschetta 1, Bruna Victorasso Jardim-Perassi 1, A S M Iskander 2, Nadimpalli Ravi S Varma 4, Adarsh Shankar 2, Verena Benedick Coimbra 1, Vanessa Alves Fabri 1, Juliana Garcia de Oliveira 5, Debora Aparecida Pires de Campos Zuccari 1 3
Affiliations
- PMID: 26292662
- PMCID: PMC4996347
- DOI: 10.1111/jpi.12270
Melatonin decreases breast cancer metastasis by modulating Rho-associated kinase protein-1 expression
Thaiz Ferraz Borin et al. J Pineal Res. 2016 Jan.
Abstract
The occurrence of metastasis, an important breast cancer prognostic factor, depends on cell migration/invasion mechanisms, which can be controlled by regulatory and effector molecules such as Rho-associated kinase protein (ROCK-1). Increased expression of this protein promotes tumor growth and metastasis, which can be restricted by ROCK-1 inhibitors. Melatonin has shown oncostatic, antimetastatic, and anti-angiogenic effects and can modulate ROCK-1 expression. Metastatic and nonmetastatic breast cancer cell lines were treated with melatonin as well as with specific ROCK-1 inhibitor (Y27632). Cell viability, cell migration/invasion, and ROCK-1 gene expression and protein expression were determined in vitro. In vivo lung metastasis study was performed using female athymic nude mice treated with either melatonin or Y27832 for 2 and 5 wk. The metastases were evaluated by X-ray computed tomography and single photon emission computed tomography (SPECT) and by immunohistochemistry for ROCK-1 and cytokeratin proteins. Melatonin and Y27632 treatments reduced cell viability and invasion/migration of both cell lines and decreased ROCK-1 gene expression in metastatic cells and protein expression in nonmetastatic cell line. The numbers of 'hot' spots (lung metastasis) identified by SPECT images were significantly lower in treated groups. ROCK-1 protein expression also was decreased in metastatic foci of treated groups. Melatonin has shown to be effective in controlling metastatic breast cancer in vitro and in vivo, not only via inhibition of the proliferation of tumor cells but also through direct antagonism of metastatic mechanism of cells rendered by ROCK-1 inhibition. When Y27632 was used, the effects were similar to those found with melatonin treatment.
Keywords: 99mTc-tetrofosmin; MCF-7 cells; MDA-MB-231 cells; Rho-associated kinase protein-1 inhibitor; breast cancer; lung metastasis; melatonin; single photon emission computed tomography.
© 2015 John Wiley & Sons A/S. Published by John Wiley & Sons Ltd.
Conflict of interest statement
Conflict of interests The authors declare that they have no competing interests.
Figures
Fig. 1
Evaluation of cell viability by 3-(4,5-Dimethylthiazol-2-yl)-2,5-diphenyltetrazolium bromide assay. (A) MDA-MB-231 and (B) MCF-7 breast cancer cell lines after 48 hr of melatonin treatment; (C) MDA-MB-231 and (D) MCF-7 breast cancer cell lines after 24 hr of Y27632 treatment. Significant value in ANOVA followed by Bonferroni’s test (±S.E.M. *P < 0.05).
Fig 2
Analysis of migration and invasion rate after melatonin and Y27632 treatments. (A) MDA-MB-231 and (B) MCF-7 breast cancer cell lines. Significant value in ANOVA followed by Bonferroni’s test (±S.E.M. *P < 0.05, **P < 0.001).
Fig. 3
Analysis of expression of Rho-associated kinase protein (ROCK)-1 gene and protein after 24 hr of treatment with melatonin and Y27632. (A) and (C) MDA-MB-231, and (B) and (D) MCF-7 breast cancer cell lines. The gene expression values were relative quantification (RQ) represented and protein expression values were represented in relative levels. ROCK-1 protein levels were normalized by α-tubulin protein, presented in the boxes. Significant value in ANOVA followed by Bonferroni’s test (±S.E.M. *P < 0.05, **P < 0.001, and ***P < 0.0001).
Fig. 4
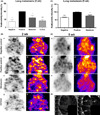
Lung metastasis after 2 and 5 wk of melatonin and Y27632 treatments. Semiquantitative analysis of radioactivity intensity by single photon emission computed tomography (SPECT) images following (A) 2 wk of treatment and following (C) 5 wk of treatment. SPECT images obtained after injection of the 99mTc-tetrofosmin showing lung metastasis following (B) 2 wk of treatment and following (D) 5 wk of treatment. (a) and (b) negative control, (c) and (d) positive control, (e) and (f) melatonin treatment, (g) and (h) Rho-associated kinase protein (ROCK)-1 inhibitor (Y27632) treatment. (E) High-resolution computed tomography images at 25-µm thickness. (a) Control animal without metastasis; (b) positive control animal without treatment showing high-density area (white arrow) indicating lung metastasis in animal after 6 wk following induction of lung metastasis. Significant value in ANOVA followed by Bonferroni’s test (±S.E.M. *P < 0.05; ***P < 0.0001).
Fig. 5
Hematoxylin and eosin staining showing lung tissues in all groups. (A) Representative images from 2 wk of treatment and (B) from 5 wk of treatment. (a) and (e) negative control, (b) and (f) positive control, (c) and (g) melatonin treatment, (d) and (h) Y27632 treatment. Images were taken with 10× and 40× magnification. Arrows show the sites of metastasis. Note the sparsity of tumor cells in Y27632-treated group.
Fig. 6
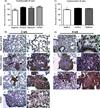
Cytokeratin protein expression analysis in lung metastasis. (A) and (C) Semiquantitative analysis from animals with 2 and 5 wk of treatment, respectively. (B) and (D) Representative images from (a) and (b) negative control, (c) and (d) positive control, (e) and (f) melatonin treatment, (g) and (h) Y27632 treatment. Images were taken with 10× and 40× magnification. Arrows show the sites of metastasis. The values of mean optical density and standard error for each group are shown in arbitrary units (au). (**) represents P ≤ 0.001 and (***) P ≤ 0.0001 by ANOVA followed by Bonferroni’s test.
Fig. 7
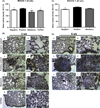
Rho-associated kinase protein (ROCK)-1 protein expression analysis in lung metastasis. (A) and (C) Semiquantitative analysis from animals with 2 and 5 wk of treatment, respectively. (B) and (D) Representative images from (a) and (b) negative control, (c) and (d) positive control, (e) and (f) melatonin treatment, (g) and (h) Y27632 treatment. Images were taken with 10× and 40× magnification. Arrows show the sites of metastasis. The values of mean optical density and standard error for each group are shown in arbitrary units (au). (*) represents P ≤ 0.05 and (**) P ≤ 0.001 by ANOVA followed by Bonferroni’s test.
Similar articles
- ROCK-regulated cytoskeletal dynamics participate in the inhibitory effect of melatonin on cancer cell migration.
Ortíz-López L, Morales-Mulia S, Ramírez-Rodríguez G, Benítez-King G. Ortíz-López L, et al. J Pineal Res. 2009 Jan;46(1):15-21. doi: 10.1111/j.1600-079X.2008.00600.x. Epub 2008 May 12. J Pineal Res. 2009. PMID: 18482340 - Inhibition of rho-associated kinase signaling prevents breast cancer metastasis to human bone.
Liu S, Goldstein RH, Scepansky EM, Rosenblatt M. Liu S, et al. Cancer Res. 2009 Nov 15;69(22):8742-51. doi: 10.1158/0008-5472.CAN-09-1541. Epub 2009 Nov 3. Cancer Res. 2009. PMID: 19887617 - Inhibition of Epithelial-mesenchymal Transition in Response to Treatment with Metformin and Y27632 in Breast Cancer Cell Lines.
Leonel C, Ferreira LC, Borin TF, Moschetta MG, Freitas GS, Haddad MR, de Camargos Pinto Robles JA, Aparecida Pires de Campos Zuccari D. Leonel C, et al. Anticancer Agents Med Chem. 2017;17(8):1113-1125. doi: 10.2174/1871520617666170102153954. Anticancer Agents Med Chem. 2017. PMID: 28042775 - The potential therapeutic effects of melatonin on breast cancer: An invasion and metastasis inhibitor.
Maroufi NF, Ashouri N, Mortezania Z, Ashoori Z, Vahedian V, Amirzadeh-Iranaq MT, Fattahi A, Kazemzadeh H, Bizzarri M, Akbarzadeh M, Nejabati HR, Faridvand Y, Rashidi MR, Nouri M. Maroufi NF, et al. Pathol Res Pract. 2020 Oct;216(10):153226. doi: 10.1016/j.prp.2020.153226. Epub 2020 Sep 19. Pathol Res Pract. 2020. PMID: 32987338 Review. - Rho-associated kinases in tumorigenesis: re-considering ROCK inhibition for cancer therapy.
Rath N, Olson MF. Rath N, et al. EMBO Rep. 2012 Oct;13(10):900-8. doi: 10.1038/embor.2012.127. Epub 2012 Sep 11. EMBO Rep. 2012. PMID: 22964758 Free PMC article. Review.
Cited by
- Melatonin decreases estrogen receptor binding to estrogen response elements sites on the OCT4 gene in human breast cancer stem cells.
Lopes J, Arnosti D, Trosko JE, Tai MH, Zuccari D. Lopes J, et al. Genes Cancer. 2016 May;7(5-6):209-17. doi: 10.18632/genesandcancer.107. Genes Cancer. 2016. PMID: 27551335 Free PMC article. - KD025, an anti-adipocyte differentiation drug, enhances the efficacy of conventional chemotherapeutic drugs in ABCG2-overexpressing leukemia cells.
Jing W, Zhang X, Chen R, Ye X, Zhou M, Li W, Yan W, Xuyun X, Peng J. Jing W, et al. Oncol Lett. 2020 Dec;20(6):309. doi: 10.3892/ol.2020.12172. Epub 2020 Sep 30. Oncol Lett. 2020. PMID: 33093918 Free PMC article. - Promising Antineoplastic Actions of Melatonin.
Favero G, Moretti E, Bonomini F, Reiter RJ, Rodella LF, Rezzani R. Favero G, et al. Front Pharmacol. 2018 Oct 16;9:1086. doi: 10.3389/fphar.2018.01086. eCollection 2018. Front Pharmacol. 2018. PMID: 30386235 Free PMC article. Review. - Melatonin for the treatment of spinal cord injury.
Zhang Y, Zhang WX, Zhang YJ, Liu YD, Liu ZJ, Wu QC, Guan Y, Chen XM. Zhang Y, et al. Neural Regen Res. 2018 Oct;13(10):1685-1692. doi: 10.4103/1673-5374.238603. Neural Regen Res. 2018. PMID: 30136678 Free PMC article. Review. - Melatonin represses oral squamous cell carcinoma metastasis by inhibiting tumor-associated neutrophils.
Lu H, Wu B, Ma G, Zheng D, Song R, Huang E, Mao M, Lu B. Lu H, et al. Am J Transl Res. 2017 Dec 15;9(12):5361-5374. eCollection 2017. Am J Transl Res. 2017. PMID: 29312489 Free PMC article.
References
- Jemal A, Bray F, Center MM, et al. Global cancer statistics. CA Cancer J Clin. 2011;61:69–90. - PubMed
- Moreau JE, Anderson K, Mauney JR, et al. Tissue-engineered bone serves as a target for metastasis of human breast cancer in a mouse model. Cancer Res. 2007;67:10304–10308. - PubMed
- Ridley AJ. Rho GTPases and cell migration. J Cell Sci. 2001;114:2713–2722. - PubMed
Publication types
MeSH terms
Substances
LinkOut - more resources
Full Text Sources
Other Literature Sources
Medical
Research Materials
Miscellaneous


