FOXC2 and fluid shear stress stabilize postnatal lymphatic vasculature - PubMed (original) (raw)
. 2015 Oct 1;125(10):3861-77.
doi: 10.1172/JCI80454. Epub 2015 Sep 21.
Esther Bovay, Cansaran Saygili Demir, Wataru Kimura, Muriel Jaquet, Yan Agalarov, Nadine Zangger, Joshua P Scallan, Werner Graber, Elgin Gulpinar, Brenda R Kwak, Taija Mäkinen, Inés Martinez-Corral, Sagrario Ortega, Mauro Delorenzi, Friedemann Kiefer, Michael J Davis, Valentin Djonov, Naoyuki Miura, Tatiana V Petrova
- PMID: 26389677
- PMCID: PMC4607114
- DOI: 10.1172/JCI80454
FOXC2 and fluid shear stress stabilize postnatal lymphatic vasculature
Amélie Sabine et al. J Clin Invest. 2015.
Abstract
Biomechanical forces, such as fluid shear stress, govern multiple aspects of endothelial cell biology. In blood vessels, disturbed flow is associated with vascular diseases, such as atherosclerosis, and promotes endothelial cell proliferation and apoptosis. Here, we identified an important role for disturbed flow in lymphatic vessels, in which it cooperates with the transcription factor FOXC2 to ensure lifelong stability of the lymphatic vasculature. In cultured lymphatic endothelial cells, FOXC2 inactivation conferred abnormal shear stress sensing, promoting junction disassembly and entry into the cell cycle. Loss of FOXC2-dependent quiescence was mediated by the Hippo pathway transcriptional coactivator TAZ and, ultimately, led to cell death. In murine models, inducible deletion of Foxc2 within the lymphatic vasculature led to cell-cell junction defects, regression of valves, and focal vascular lumen collapse, which triggered generalized lymphatic vascular dysfunction and lethality. Together, our work describes a fundamental mechanism by which FOXC2 and oscillatory shear stress maintain lymphatic endothelial cell quiescence through intercellular junction and cytoskeleton stabilization and provides an essential link between biomechanical forces and endothelial cell identity that is necessary for postnatal vessel homeostasis. As FOXC2 is mutated in lymphedema-distichiasis syndrome, our data also underscore the role of impaired mechanotransduction in the pathology of this hereditary human disease.
Figures
Figure 15. FOXC2 and fluid shear stress stabilize postnatal lymphatic vasculature by enhancing cell-cell junction integrity and inducing cell-cycle arrest.
Collecting lymphatic vessels contain a large number of lymphatic valves, characterized by areas of persistent disturbed flow in valve sinuses. Disturbed flow (modeled by OSS) induces expression of FOXC2, formation of overlapping intercellular junctions, and nuclear accumulation of TAZ. FOXC2 protects integrity of the overlapping cell-cell junctions and the cortically organized actin cytoskeleton and prevents the proliferative action of TAZ. In the absence of FOXC2, OSS potentiates the cell-cell junction defects, activates cytoskeleton remodeling, and induces TAZ-dependent cell proliferation and death.
Figure 14. FOXC2 protects valve cells in vivo.
(A) _Foxc2_lecKO cells are not retained in the valves. Mesenteries from _Rosa26_-YFP WT or _Rosa26_-YFP _Foxc2_lecKO mice were stained for PROX1 (red) and GFP (white) 2 days after Foxc2 mosaic deletion. Arrowheads indicate PROX1+/YFP+ cells. (B) Quantification of PROX1hi/GFP+ (valve) and PROX1lo/GFP+ (lymphangion) cells in wild-type and _Foxc2_lecKO mesenteric vessels (see also Supplemental Figure 11). n = 3; 5–10 valves scored per mesentery; 2-tailed unpaired Student’s t test; *P < 0.05. Scale bars: 25 μm.
Figure 13. FOXC2 promotes cell growth arrest and counteracts TAZ signaling.
(A) Increased proliferation in _Foxc2_lecKO lymphatic collecting vessels. DNA synthesis was detected by EdU incorporation 2 days after tamoxifen injection. Staining for PROX1 (white) and EdU (red). Dotted green lines outline the collecting vessel. (B) High-magnification images of the area in the yellow box from A (PROX1 staining only). The dashed red lines outline the EdU+ nuclei. Blue arrowheads indicate EdU+/PROX1+ nuclei; blue asterisks indicate EdU+/PROX1– nuclei. (C) Quantification of EdU+/PROX1+ cells in the collecting vessels of control or _Foxc2_lecKO mice. n = 9; 5 valves scored per mesentery; 2-tailed unpaired Student’s t test; *P < 0.01. (D) Orange transgene expression levels in mesenteric lymphangion (Orangelo) and valve cells (Orangehi) isolated from _Prox1_-mOrange2+ and _Foxc2_lecKO _Prox1_-mOrange2+ pups 2 days after tamoxifen injection. (E) Valve markers Prox1, Itga9, and Cx37 are elevated in Orangehi control LECs. Cx37 is reduced in _Foxc2_-deficient LECs, as reported previously (10, 26). (F) Enhanced expression of TAZ target genes Ctgf, Cyr61, and Ankrd1 in LECs of _Foxc2_lecKO mice. Data are representative of 2 independent experiments. The second experiment is shown in Supplemental Figure 10E (see also Supplemental Figure 10 and Supplemental Video 9). Scale bars: 50 μm (A); 100 μm (B).
Figure 12. FOXC2 maintains cell quiescence and survival in vivo.
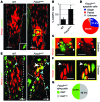
(A) Increased apoptosis in _Foxc2_lecKO lymphatic collecting vessels 2 days after Foxc2 inactivation. Staining for PROX1 (red) and activated caspase-3 (green). Only rare CASP3+ nonendothelial cells were observed in the wild-type samples (inset). Dotted white lines outline the collecting vessel. (B) Quantification of PROX1+/CASP3+ cells. n = 3–5; 5–10 valves scored per mesentery; 2-tailed unpaired Student’s t test; *P < 0.005. (C) High-magnification images of the area outlined by the yellow box in A. _Foxc2_lecKO apoptotic cells were often arranged in doublets with PROX1hi symmetrically organized apoptotic bodies (white arrowheads). (D) Proportion of PROX1+/CASP3+ apoptotic cell doublets (blue) or singlets (red) in _Foxc2_lecKO mesenteries. WT, n = 2 animals; _Foxc2_lecKO, n = 4 animals. (E) Increased LEC proliferation in _Foxc2_lecKO collecting vessels. Staining for Ki67 (green) and PROX1 (red) 3 days after Foxc2 inactivation. Dotted white lines outline collecting vessels. Blue arrowheads indicate PROX1+/Ki67+ cells. (F) High-magnification image of a dying LEC with a fragmented PROX1+/Ki67+ pattern (white arrowhead) from the area outlined by the yellow box in E. (G) Proportion of the PROX1+/Ki67+ double-positive apoptotic cells in _Foxc2_lecKO mesenteries. No PROX1+/Ki67+ apoptotic bodies were observed in wild-type mesenteries. n = 3 mice per genotype. Scale bars: 20 μm (A and E); 10 μm (C and F).
Figure 11. FOXC2 controls cell-cell junction integrity in collecting vessels.
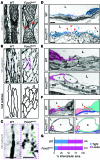
(A) Impaired cell elongation in _Foxc2_lecKO P7 mesenteric collecting lymphatic vessels. Staining for VE-cadherin. Red arrowheads indicate lymphatic sprouts from valve sinuses. B, blood vessels. (B) Continuous VE-cadherin pattern in wild-type LECs and zigzag-like junctions in _Foxc2_lecKO LECs. The bottom row shows outline of the cells. B, blood capillary. (C) High-magnification images of the junctions from the pink boxed area in B. _Foxc2_lecKO junctions have multiple gaps (green arrowheads). (D) Transmission electron microscopy images of P8 wild-type and _Foxc2_lecKO thoracic duct transverse sections. L, lymphatic lumen; F, fibroblast; lec, endothelial nucleus; Co, collagen fibers. Asterisks indicate endothelial vacuoles; red arrowheads indicate sheet-like structures shedding into the lumen; pink arrows indicate basement membrane. The lymphatic endothelium is highlighted in blue. (E and F) Transmission electron microscopy images of LEC junctions in the thoracic duct. Neighboring cells (the left one is pseudo-colored in pink) have “interdigitating” contacts, fixed on both ends by junctional complexes (red arrowheads in F) and to the basement membrane (BM) via adhesion complexes (arrows). _Foxc2_lecKO cell-cell contacts are unfolded, resulting in the formation of interendothelial vacuoles (asterisks), which often detach from the matrix below (double arrows). Co; collagen fibers; L, vessel lumen. A scheme of the intercellular junctions shown on the left in F is provided on the right. (G) Quantification of endothelial cell-cell junction organization in the thoracic ducts of _Foxc2_lecKO and control mice. Percentage of tight (see wild-type junction in F) or loose (see _Foxc2_lecKO junction in F) cell-cell junctions is shown for each genotype together with the number of junctions analyzed (see also Supplemental Figure 9). Scale bars: 50 μm (A); 10 μm (B and C); 2 μm (D); 1 μm (E); 250 nm (F).
Figure 10. FOXC2 maintains collecting lymphatic vessel phenotype.
(A) Reduced valve core matrix in mesenteric lymphatic vessels of _Foxc2_lecKO P8 mice. Staining for laminin α5 (white) and PROX1 (red). The collecting vessel is outlined with dashed white lines. The arrow indicates sprout from the valve sinus. (B) Vascular smooth muscle cell coverage on mesenteric lymphatic valves of _Foxc2_lecKO P8 mice (arrowhead). Staining for αSMA (red) and PECAM1 (green). The collecting vessel is outlined with dashed white lines. B, blood vessel. (C) Increased levels of LYVE-1 (white) in collecting mesenteric lymphatic vessels of P8 _Foxc2_lecKO mice. Arrowheads indicate LYVE-1+ vessels. Some immune cells are also LYVE-1+ along the vascular branches. LN, lymph node. (D) Scheme recapitulating LYVE-1 staining shown in C. (E) _Foxc2_lecKO collecting vessels display valve regression, lumen collapse, and increased lymph leakage. Extreme narrowing of the vessel in the degenerating valve area could eventually lead to vessel rupture, precipitating accumulation of the lymph (e.g., in the pleural cavity). Scale bars: 20 μm (A and B); 500 μm (C).
Figure 9. Characterization of functional defects in adult _Foxc2_lecKO valves.
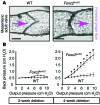
(A) Examples of wild-type and _Foxc2_lecKO valves from 8-week-old mice treated with tamoxifen for 4 weeks. Equal pressure was applied on both cannulated ends (Pin/Pout) to open the valve. Arrows indicate forward lymph flow direction. (B) Decreased resistance of _Foxc2_lecKO valves. Low pressure back-leak tests of mesenteric valves isolated from mice after 2 or 4 weeks of Foxc2 inactivation (see also Supplemental Figure 7). n = 5 mice per group; 4–16 valves were scored per condition; 1-way ANOVA with Tukey-Kramer post-hoc test; *P < 0.05. Scale bars: 40 μm.
Figure 8. Maintenance of postnatal lymphatic valves depends on FOXC2.
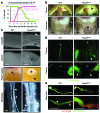
(A) Time course of postnatal development and maturation of mesenteric lymphatic valves in _Prox1_-mOrange2+ wild-type animals. The total valves per mesentery was 285 ± 24 at P1, 528 ± 90 at P5, and 756 ± 99 at P8. (B–E) Mice were injected with tamoxifen at P4 and analyzed at P8. (B) Organization of mesenteric lymphatic vasculature in P8 mOrange2+ control and _Foxc2_lecKO mice. Arrowheads indicate valves. LN, lymph node; Mes, mesentery; In, intestine. (C) High-magnification images of lymphatic valves shown in B. Wild-type valves have a semilunar (top row) or a v-like shape (bottom row), depending on their orientation. _Foxc2_lecKO valves are disorganized and misshapen. The arrow indicates a regressing valve. Arrowheads indicate sprouts from the valve site. (D) Quantification of the valve number and valve leaflet status. (E) Quantification of sprouts associated with _Foxc2_lecKO lymphatic valves, as shown in C. n = 4–6; 4 vessels were scored per mesentery; 2-tailed unpaired Student’s t test; *P < 0.05. Scale bars: 1 mm (B); 50 μm (C).
Figure 7. FOXC2 is essential for postnatal lymphatic vascular function.
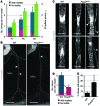
(A) Time course of chylous effusion (pink curve) and lethality (green curve) after Foxc2 inactivation. The dotted line indicates the time point used for most phenotypic analyses. Chylous effusion was defined as the presence of chylothorax or chylous ascites. n = 150 animals (5–20 _Foxc2_lecKO mice per time point). (B) Macroscopic appearance of chylothorax (top row) and chylous ascites (bottom row) in P8 _Foxc2_lecKO mice. The arrowheads indicate chyle. (C) Chyle accumulation in the intestinal submucosal lymphatic vessels, in the ceca, and in Peyer’s patches (asterisk) and chyle leakage from mesenteric lymphatic collecting vessels in P8 _Foxc2_lecKO mice. Black arrowheads indicate chyle accumulation. The white arrow indicates mesenteric vessels. White arrowheads indicate valves. Red arrows indicate chyle leakage. (D) Lymph reflux from the thoracic duct and from dermal collecting lymphatic vessels in P8 _Foxc2_lecKO mice. Collecting lymphatic vessels were visualized by FITC-dextran injection into the mesenteric lymph node (top row) or the forelimb foot pad (bottom row). Asterisks indicate thoracic ducts. Arrowheads indicate backflow into lymphatic branches. FL, forelimb; LN, axillary lymph node. (E) Impaired lymph transport in _Foxc2_lecKO _Prox1_-mOrange2+ pups at P8. FITC-dextran was injected into the inguinal lymph node (asterisks) and visualized in the dermal efferent collecting vessel. _Foxc2_lecKO animals often showed arrest of the lymph drainage at the site of a misshapen valve with lumen narrowing. Arrowheads indicate valves (see also Supplemental Figure 5). Scale bars: 2 mm (B); 250 μm (C); 1 mm (D); 500 μm (E).
Figure 6. FOXC2 restricts YAP1/TAZ signaling in LECs under disturbed flow.
(A) YAP1/TAZ target genes are over induced in the absence of FOXC2. Heat map for the indicated genes (red, increased expression; green, decreased expression). KD, _FOXC2_KD. (B) YAP1/TAZ accumulate in the nuclei of both control and _FOXC2_KD cells subjected to OSS. Staining for FOXC2 (red), VE-cadherin (green), and YAP1/TAZ (white). Only control cells showed YAP1/TAZ in the cell-cell junctions (arrowheads), whereas it was mostly absent from _FOXC2_KD VE-cadherin+ areas (arrows). Nuclei are outlined with dashed blue lines. High-magnification images of the boxed areas are shown in Supplemental Figure 4A. (C) Corresponding quantification of YAP1/TAZ intensity per nucleus μm2. (D) Nuclear localization of TAZ in the lymphatic valves. Staining for PROX1 (red) and TAZ (white) of P7 collecting mesenteric vessels. Lymphatic valve cells were identified by high PROX1 expression (arrowhead). The vascular lumen (L) is outlined with a dotted blue line and DNA is stained in blue (left), and PROX1+ nuclei are outlined with a dotted red line (right). (E–G) Depletion of TAZ, but not YAP1, in _FOXC2_KD cells reverses hyperproliferation under OSS. Quantification of Ki67+ cells in _FOXC2_KD (orange) and (E) FOXC2/YAP1/TAZ knockdown (green) cells, (F) FOXC2/YAP1 knockdown (purple) cells, or (G) FOXC2/TAZ knockdown (red) cells. Scale bars: 10 μm (B); 20 μm (D). n = 3 in C and E; n = 2 in F and G; more than 50 cells scored per condition; 2-tailed unpaired Student’s t test; #P < 0.05 (static vs. OSS), *P < 0.05 (control vs. _FOXC2_KD) (see also Supplemental Figure 4). NS, not significant.
Figure 5. FOXC2 and OSS control actin cytoskeleton organization.
(A) Abnormal organization and increased contractility of actomyosin in _FOXC2_KD cells is potentiated by OSS. Staining for F-actin (green) and pMLC2 (red). (B) FOXC2 depletion and OSS enhance vinculin recruitment to the intercellular junctions (arrowheads in _FOXC2_KD vs. arrow in control cells). Staining for vinculin (green). (C) Scheme for the role of FOXC2 in remodeling of LEC junctions under shear stress. OSS induces cortical stress fibers and overlapping reticular junctions, whereas FOXC2 inactivation leads to aberrant accumulation of highly contractile stress fibers, junction disruption, and formation of interendothelial gaps (see also Supplemental Figure 3C). Scale bars: 10 μm.
Figure 4. FOXC2 and OSS control adherens cell-cell junction integrity.
(A) Staining of control and _FOXC2_KD cells for FOXC2 (green) and VE-cadherin (pink). The arrow indicates an overlapping junction induced by OSS; the arrowhead indicates a zigzag-like junction induced by FOXC2 depletion. Cell nuclei are outlined by white lines. (B) High-magnification images of VE-cadherin junctions (black) show the formation of reticular structures (red arrow) in control cells under OSS, while _FOXC2_KD cells have mostly discontinuous and thin cell-cell contacts (red arrowhead). (C) Quantification of adherens cell-cell junction types in control and _FOXC2_KD cells. VE-cadherin+ junctions were classified as linear (exemplified by control/static image in B), overlapping (exemplified by control/oscillatory image in B), or discontinuous (exemplified by _FOXC2_KD/oscillatory image in B). The proportion of each junction type was determined for the entire cell periphery. (D) OSS increases VE-cadherin+ junctional area in control but not in _FOXC2_KD LECs. (E) Increased junction complexity in _FOXC2_KD cells, as indicated by increased fractal dimension of the VE-cadherin organization. (F) Increased number of VE-cadherin– gaps in _FOXC2_KD LECs. (G) FOXC2-dependent cell-cell junction remodeling is cell autonomous. The isolated FOXC2+ cell has continuous junctions (arrows), while the neighboring _FOXC2_KD cells have zigzag junctions (arrowheads). Staining for FOXC2 (green) and VE-cadherin (pink). Cell nuclei are outlined with dashed white lines. Scale bars: 10 μm (A and G); 5 μm (B). n = 3; more than 50 cells scored per condition; 2-tailed unpaired Student’s t test; #P < 0.05 (static vs. OSS), *P < 0.05 (control vs. _FOXC2_KD) (see also Supplemental Figure 3, A and B).
Figure 3. FOXC2 controls the quiescent state and survival of LECs under disturbed flow conditions.
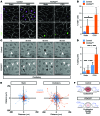
(A) _FOXC2_KD cells proliferate more under OSS. Staining for FOXC2 (pink), VE-cadherin (white), and proliferation marker Ki67 (green). (B) Quantification of Ki67+ cells in A in the indicated conditions. (C) _FOXC2_KD cells have an increased death rate under OSS. Time-lapse microscopy images of control and _FOXC2_KD cells. White arrowheads indicate dying cells. (D) Quantification of dying cells in C over 4 hours of recording. (E) Increased motility of _FOXC2_KD cells under OSS. Cell trajectory plots of individual control (blue) or _FOXC2_KD (orange) cells in static or OSS conditions. (F) Scheme showing control or _FOXC2_KD cell phenotype under OSS. Control cells become quiescent, while _FOXC2_KD cells show increased proliferation, motility, and death. Scale bars: 10 μm. n = 3; more than 50 cells scored per condition; 2-tailed unpaired Student’s t test; #P < 0.05 (static vs. OSS), *P < 0.05 (control vs. _FOXC2_KD) (see also Supplemental Figure 2 and Supplemental Videos 1–8).
Figure 2. FOXC2 represses a proliferative genetic program in LECs under disturbed flow conditions.
(A) Flowchart of the experiments for in vitro FOXC2 knockdown in LECs, shear stress treatment, and gene expression analysis. (B) Scatter plot of global changes in gene expression induced by OSS in control and _FOXC2_KD cells. Colored dots indicate transcripts changed in the indicated conditions (n = 2; regularized t test, FDR < 0.05); black dots indicate stable transcripts. Downregulated and upregulated genes appear on the left and right sides of the plot, respectively. The numbers of transcripts significantly regulated in both control and _FOXC2_KD cells (pink), only in control cells (green), and only in _FOXC2_KD cells (blue) are indicated on the plot. (C and D) Protein interaction networks for genes (C) repressed or (D) induced by OSS in control or _FOXC2_KD cells. The number of genes for each condition is indicated. Genes associated with cell cycle, immune responses, or cholesterol biosynthesis are highlighted, with the corresponding colored dots on the networks. Dot size reflects the degree of changes for each transcript. Data are obtained from 2 independent experiments (see also Supplemental Figure 1).
Figure 1. FOXC2 expression pattern in postnatal lymphatic vessels.
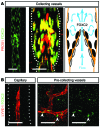
(A) In P8 mesenteric lymphatic vessels FOXC2 (green) is highly expressed in the valve sinuses subjected to recirculating flow, while only low levels are found on the upstream luminal part of the valve exposed to laminar shear stress. PROX1 (red) is strongly expressed on both sides of the valve leaflet. (B) FOXC2 levels are low in P8 intestinal lymphatic capillaries, and only occasional FOXC2+ cells are detected in submucosal pre-collecting vessels. Intestinal villus is outlined with a dotted line. The arrowheads indicate FOXC2+ cells. Scale bars: 50 μm.
Similar articles
- Shear stimulation of FOXC1 and FOXC2 differentially regulates cytoskeletal activity during lymphatic valve maturation.
Norden PR, Sabine A, Wang Y, Demir CS, Liu T, Petrova TV, Kume T. Norden PR, et al. Elife. 2020 Jun 8;9:e53814. doi: 10.7554/eLife.53814. Elife. 2020. PMID: 32510325 Free PMC article. - Mechanotransduction activates canonical Wnt/β-catenin signaling to promote lymphatic vascular patterning and the development of lymphatic and lymphovenous valves.
Cha B, Geng X, Mahamud MR, Fu J, Mukherjee A, Kim Y, Jho EH, Kim TH, Kahn ML, Xia L, Dixon JB, Chen H, Srinivasan RS. Cha B, et al. Genes Dev. 2016 Jun 15;30(12):1454-69. doi: 10.1101/gad.282400.116. Epub 2016 Jun 16. Genes Dev. 2016. PMID: 27313318 Free PMC article. - Cdk5 controls lymphatic vessel development and function by phosphorylation of Foxc2.
Liebl J, Zhang S, Moser M, Agalarov Y, Demir CS, Hager B, Bibb JA, Adams RH, Kiefer F, Miura N, Petrova TV, Vollmar AM, Zahler S. Liebl J, et al. Nat Commun. 2015 Jun 1;6:7274. doi: 10.1038/ncomms8274. Nat Commun. 2015. PMID: 26027726 - Endothelial Cell Responses to Biomechanical Forces in Lymphatic Vessels.
Sabine A, Saygili Demir C, Petrova TV. Sabine A, et al. Antioxid Redox Signal. 2016 Sep 1;25(7):451-65. doi: 10.1089/ars.2016.6685. Epub 2016 Jul 19. Antioxid Redox Signal. 2016. PMID: 27099026 Review. - Lymphatic endothelial cells, lymphedematous lymphangiogenesis, and molecular control of edema formation.
Ji RC. Ji RC. Lymphat Res Biol. 2008;6(3-4):123-37. doi: 10.1089/lrb.2008.1005. Lymphat Res Biol. 2008. PMID: 19093784 Review.
Cited by
- Transport functions of intestinal lymphatic vessels.
Tso P, Bernier-Latmani J, Petrova TV, Liu M. Tso P, et al. Nat Rev Gastroenterol Hepatol. 2024 Nov 4. doi: 10.1038/s41575-024-00996-z. Online ahead of print. Nat Rev Gastroenterol Hepatol. 2024. PMID: 39496888 Review. - EPHB4-RASA1 Inhibition of PIEZO1 Ras Activation Drives Lymphatic Valvulogenesis.
Chen D, Tang Y, Lapinski PE, Wiggins D, Sevick EM, Davis MJ, King PD. Chen D, et al. Circ Res. 2024 Nov 8;135(11):1048-1066. doi: 10.1161/CIRCRESAHA.124.325383. Epub 2024 Oct 18. Circ Res. 2024. PMID: 39421925 - Low Intraocular Pressure Induces Fibrotic Changes in the Trabecular Meshwork and Schlemm's Canal of Sprague Dawley Rats.
Xu L, Zhao Y, Zhang X, Gang X, Han J, Zhou T, Qi B, Song S, Ren R, Liang Y. Xu L, et al. Transl Vis Sci Technol. 2024 Oct 1;13(10):10. doi: 10.1167/tvst.13.10.10. Transl Vis Sci Technol. 2024. PMID: 39374003 Free PMC article. - Overview of Lymphatic Muscle Cells in Development, Physiology, and Disease.
Arroyo-Ataz G, Jones D. Arroyo-Ataz G, et al. Microcirculation. 2024 Nov;31(8):e12887. doi: 10.1111/micc.12887. Epub 2024 Sep 27. Microcirculation. 2024. PMID: 39329178 Review. - Low or oscillatory shear stress and endothelial permeability in atherosclerosis.
Chen L, Qu H, Liu B, Chen BC, Yang Z, Shi DZ, Zhang Y. Chen L, et al. Front Physiol. 2024 Sep 9;15:1432719. doi: 10.3389/fphys.2024.1432719. eCollection 2024. Front Physiol. 2024. PMID: 39314624 Free PMC article. Review.
References
Publication types
MeSH terms
Substances
LinkOut - more resources
Full Text Sources
Other Literature Sources
Molecular Biology Databases
Research Materials


