An Ovol2-Zeb1 Mutual Inhibitory Circuit Governs Bidirectional and Multi-step Transition between Epithelial and Mesenchymal States - PubMed (original) (raw)
An Ovol2-Zeb1 Mutual Inhibitory Circuit Governs Bidirectional and Multi-step Transition between Epithelial and Mesenchymal States
Tian Hong et al. PLoS Comput Biol. 2015.
Abstract
Reversible epithelial-to-mesenchymal transition (EMT) is central to tissue development, epithelial stemness, and cancer metastasis. While many regulatory elements have been identified to induce EMT, the complex process underlying such cellular plasticity remains poorly understood. Utilizing a systems biology approach integrating modeling and experiments, we found multiple intermediate states contributing to EMT and that the robustness of the transitions is modulated by transcriptional factor Ovol2. In particular, we obtained evidence for a mutual inhibition relationship between Ovol2 and EMT inducer Zeb1, and observed that adding this regulation generates a novel four-state system consisting of two distinct intermediate phenotypes that differ in differentiation propensities and are favored in different environmental conditions. We identified epithelial cells that naturally exist in an intermediate state with bidirectional differentiation potential, and found the balance between EMT-promoting and -inhibiting factors to be critical in achieving and selecting between intermediate states. Our analysis suggests a new design principle in controlling cellular plasticity through multiple intermediate cell fates and underscores the critical involvement of Ovol2 and its associated molecular regulations.
Conflict of interest statement
The authors have declared that no competing interests exist.
Figures
Fig 1. Experimental evidence for Ovol2-Zeb1 mutual repression.
A) Zeb1 binds to the Ovol2 promoter in mouse mammary epithelial cells. Top, diagram showing the presence of Zeb1 consensus motifs (triangles) in Ovol2 promoter. Bottom, ChIP-PCR using primers for the upstream (left) and downstream sites (right). B) RT-quantitative PCR analysis showing that OVOL2 and ZEB1 overexpression in MCF10A cells results in decreased level of Zeb1 and Ovol2 transcripts, respectively TSS, transcription start site.
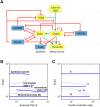
Fig 2. Incorporation of an Ovol2-Zeb1 mutual repression module results in the observation of four distinct states in EMT.
A) Influence diagram of the EMT/MET system. Blue icon: epithelial promoting factor. Yellow icon: mesenchymal promoting factor. Hexagon: extracellular input. B, C) One-parameter bifurcation diagrams of E-cadherin (Ecad) with respect to external TGF-β (B) and Ovol2 basal production rate (C). Solid curve: stable steady state. Dashed curve: unstable steady state. In B, only transition between I1 and I2 is reversible when TGF-β level is varied. In C, varying Ovol2 alone does not result in any reversible transition, but it can possibly reverse the following TGF-β-induced transitions: E-I1, E-I2 and E-M.
Fig 3. Experimental evidence for bidirectional potential of MCF10A cells.
A, B, D, E) Flow cytometric analysis of epithelial marker (Ecad) and mesenchymal marker (Vim) profiles. A) Direct comparison of MCF10A with luminal (epithelial)-type cancer cell line MCF7 and basal (mesenchymal)-type cancer cell line MDA-MB231. MCF10A (green) falls in the intermediate state between MCF7 (blue) and MDA-MB231 (red). Analyses were performed at 90–100% confluency. B) Bidirectional potential of MCF10A cells. E(I)MT and M(I)ET was induced by forced expression of transcription factors Snail or Zeb1, and Ovol2, respectively. After 6 days of lentiviral infection, Snail (red) and Zeb1 (orange) induced EMT while Ovol2 (blue) induced MET as compared to the empty vector control (green). C) Stochastic simulations for a population of 2000 cells in three different conditions: basal parameter set (green), high basal production rate of Zeb1 ZEB1 (red, Zeb1 mRNA basal production rate was raised to 0.01 μM/hr) and high basal production rate of Ovol2 (blue, Ovol2 basal production rate was raised to 2 μM/hr). Initial conditions are all at I1 state. D) The histogram shows the expression status of CD44. “M” states (Snail;red and Zeb1;orange) correlate with high CD44 expression while cells in “E” state (Ovol2;blue) show low CD44 expression as compared to empty vector control (green). MCF7 is shown as a representative cell type in the “E” state with low CD44 expression. E) Ovol2 reprograms MDA-MB231 cells from M- to E- state. Cells were analyzed after 6 days of control (red) or Ovol2-expressing (blue) lentiviral infection. F) Stochastic simulations with a basal parameter set (red) and high basal production rate of Ovol2 (blue, Ovol2 basal production rate was raised to 2 μM/hr). Initial conditions are all at M state.
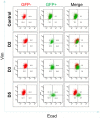
Fig 4. Time series of Ecad/Vim profile change upon Ovol2 expression in MDA-MB231 cells.
Cells were infected with Ovol2-expressing lentivirus and Ecad/Vim profile was analyzed by flow cytometry at the indicated time points. Empty vector control at day 5 is shown at the top.
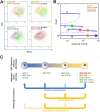
Fig 5. Stepwise induction of EMT in MCF10A cells by different doses of TGF-β.
A) Cells were treated with various concentrations of TGF-β for 10 days and analyzed for Ecad/Vim expression by flow cytometry. Each panel shows a superimposed image of two treatment conditions. Note that the 25 μM TGF-β treatment gave rise to a heterogeneous population containing I2 cells and M cells (orange). B) The corresponding steady states of the cellular phenotypes (indicated as colored dots) observed under various TGF-β concentrations in A are mapped to the bifurcation diagram shown in Fig 2B. C) An illustrative summary of phenotypic transitions in the four-state system. Solid arrow represents transition with experimental evidence from this study. Dotted arrow represents hypothetical transition without experimental evidence.
Fig 6. Roles of EMT-promoting and -inhibiting factors in the four-state EMT system.
A) Two-parameter bifurcation diagram with respect to external TGF-β and Ovol2 basal production rate. The red curves were computed by extending the saddle-node bifurcation points obtained in one parameter bifurcation analysis (S4 Fig), and they define different parameter regions that can be mono-stable, bi-stable, tri-stable or tetra-stable depending on the number of possible stable phenotypes (see labels), and each multi-stable region can be viewed as an area where multiple phenotypes co-exist (II-V). The size of each phenotype region is an indication of robustness of the phenotype when the two signals are varied. Green star: a basal parameter set and an intermediate TGF-β concentration that together give rise to four phenotypes. B, C) One-parameter bifurcation diagrams of Ecad with respect to external TGF-β (B) and Ovol2 basal production rate (C). Solid curve: stable steady state. Dashed curve: unstable steady state. A basal parameter set (blue) and a perturbed parameter set (orange) are compared in each plot. Triangles and diamonds denote the conditions under which both I1 and I2 are stable.
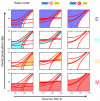
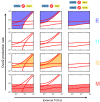
Fig 7. Roles of the Ovol2-Zeb1 mutual inhibition loop in the four-state EMT system.
Comparison of the basal model (left column), reduced Ovol2-Zeb1 mutual inhibition (middle column), and blocked Ovol2-Zeb1 mutual inhibition (right column) on the four phenotypes. Each subplot is a two-parameter bifurcation diagram similar to Fig 6A. Subplots in each column highlight the various phenotypes in one condition. Shaded areas are highlighted phenotypes. Colors of the shading correspond to the colored labels on the right.
Fig 8. Roles of the miR34a-Snail and miR200-Zeb1 mutual inhibition loops in the four-state EMT system.
Comparison of removing miR34a-Snail mutual inhibition (left column), miR200-Zeb1 mutual inhibition (middle column), or both (right column) on the four phenotypes. Each subplot is a two-parameter bifurcation diagram similar to Fig 6A. Subplots in each column highlight the various phenotypes in one condition. Shaded areas are highlighted phenotypes. Colors of the shading correspond to the colored labels on the right.
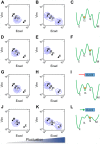
Fig 9. Distinct differentiation propensities of the two intermediate states.
A, B, D, E) Stochastic simulations for a population of 5000 cells in four different conditions. Basal parameter set and intermediate external TGF-β concentration (0.5) were used (green star in Fig 6A). A) Initial condition: I1; small fluctuations. B) Initial condition: I1; large fluctuations. D) Initial condition: I2; small fluctuations. E) Initial condition: I2; large fluctuations. G, H) Stochastic simulations for a population of 5000 cells initially at I1 state. Ovol2 basal production level was reduced by 20% from basal parameter. J, K) Stochastic simulations for 5000 cells initially at I2 state. Ovol2 basal production level was increased by 100% from basal parameter. C, F, I, L) Metaphoric energy landscapes (green curves) for I1 (C), I2 (F) initial conditions, and reduced (I) or increased (L) Ovol2 basal expression rate. Orange circle represents the initial condition.
Similar articles
- OVOL2 links stemness and metastasis via fine-tuning epithelial-mesenchymal transition in nasopharyngeal carcinoma.
Qi XK, Han HQ, Zhang HJ, Xu M, Li L, Chen L, Xiang T, Feng QS, Kang T, Qian CN, Cai MY, Tao Q, Zeng YX, Feng L. Qi XK, et al. Theranostics. 2018 Mar 8;8(8):2202-2216. doi: 10.7150/thno.24003. eCollection 2018. Theranostics. 2018. PMID: 29721073 Free PMC article. - MiR-652 inhibits acidic microenvironment-induced epithelial-mesenchymal transition of pancreatic cancer cells by targeting ZEB1.
Deng S, Li X, Niu Y, Zhu S, Jin Y, Deng S, Chen J, Liu Y, He C, Yin T, Yang Z, Tao J, Xiong J, Wu H, Wang C, Zhao G. Deng S, et al. Oncotarget. 2015 Nov 24;6(37):39661-75. doi: 10.18632/oncotarget.5350. Oncotarget. 2015. PMID: 26498682 Free PMC article. - An Ovol2-Zeb1 transcriptional circuit regulates epithelial directional migration and proliferation.
Haensel D, Sun P, MacLean AL, Ma X, Zhou Y, Stemmler MP, Brabletz S, Berx G, Plikus MV, Nie Q, Brabletz T, Dai X. Haensel D, et al. EMBO Rep. 2019 Jan;20(1):e46273. doi: 10.15252/embr.201846273. Epub 2018 Nov 9. EMBO Rep. 2019. PMID: 30413481 Free PMC article. - OVOL2: an epithelial lineage determiner with emerging roles in energy homeostasis.
Jiang Y, Zhang Z. Jiang Y, et al. Trends Cell Biol. 2023 Oct;33(10):824-833. doi: 10.1016/j.tcb.2023.05.008. Epub 2023 Jun 17. Trends Cell Biol. 2023. PMID: 37336658 Free PMC article. Review. - The multiverse nature of epithelial to mesenchymal transition.
Simeone P, Trerotola M, Franck J, Cardon T, Marchisio M, Fournier I, Salzet M, Maffia M, Vergara D. Simeone P, et al. Semin Cancer Biol. 2019 Oct;58:1-10. doi: 10.1016/j.semcancer.2018.11.004. Epub 2018 Nov 16. Semin Cancer Biol. 2019. PMID: 30453041 Review.
Cited by
- Loss of CD24 promotes radiation‑ and chemo‑resistance by inducing stemness properties associated with a hybrid E/M state in breast cancer cells.
Bontemps I, Lallemand C, Biard D, Dechamps N, Kortulewski T, Bourneuf E, Siberchicot C, Boussin F, Chevillard S, Campalans A, Lebeau J. Bontemps I, et al. Oncol Rep. 2023 Jan;49(1):4. doi: 10.3892/or.2022.8441. Epub 2022 Nov 11. Oncol Rep. 2023. PMID: 36367190 Free PMC article. - Genetic and Non-Genetic Mechanisms Underlying Cancer Evolution.
Shlyakhtina Y, Moran KL, Portal MM. Shlyakhtina Y, et al. Cancers (Basel). 2021 Mar 18;13(6):1380. doi: 10.3390/cancers13061380. Cancers (Basel). 2021. PMID: 33803675 Free PMC article. Review. - Chronic Obstructive Pulmonary Disease and Lung Cancer: Underlying Pathophysiology and New Therapeutic Modalities.
Eapen MS, Hansbro PM, Larsson-Callerfelt AK, Jolly MK, Myers S, Sharma P, Jones B, Rahman MA, Markos J, Chia C, Larby J, Haug G, Hardikar A, Weber HC, Mabeza G, Cavalheri V, Khor YH, McDonald CF, Sohal SS. Eapen MS, et al. Drugs. 2018 Nov;78(16):1717-1740. doi: 10.1007/s40265-018-1001-8. Drugs. 2018. PMID: 30392114 Review. - Distinct cytosine modification profiles define epithelial-to-mesenchymal cell-state transitions.
Lee MK, Brown MS, Wilkins OM, Pattabiraman DR, Christensen BC. Lee MK, et al. Epigenomics. 2022 May;14(9):519-535. doi: 10.2217/epi-2022-0023. Epub 2022 Apr 6. Epigenomics. 2022. PMID: 35382559 Free PMC article. - Unraveling the Molecular Puzzle: Exploring Gene Networks across Diverse EMT Status of Cell Lines.
Park H. Park H. Int J Mol Sci. 2023 Aug 14;24(16):12784. doi: 10.3390/ijms241612784. Int J Mol Sci. 2023. PMID: 37628965 Free PMC article. Review.
References
Publication types
MeSH terms
Substances
Grants and funding
- R01GM107264/GM/NIGMS NIH HHS/United States
- P50 GM076516/GM/NIGMS NIH HHS/United States
- P30 CA062203/CA/NCI NIH HHS/United States
- R01 GM107264/GM/NIGMS NIH HHS/United States
- P50GM76516/GM/NIGMS NIH HHS/United States
LinkOut - more resources
Full Text Sources
Other Literature Sources

