Involvement of the Hippo pathway in regeneration and fibrogenesis after ischaemic acute kidney injury: YAP is the key effector - PubMed (original) (raw)
. 2016 Mar;130(5):349-63.
doi: 10.1042/CS20150385. Epub 2015 Nov 16.
Pei-Xue Li 2, Jun Wu 1, Yi-Jun Gao 3, Meng-Xin Yin 2, Ye Lin 1, Ming Yang 1, Dong-Ping Chen 1, Hai-Peng Sun 4, Zeng-Bo Liu 5, Xiang-Chen Gu 6, Hong-Ling Huang 7, Li-Li Fu 1, Hui-Min Hu 1, Liang-Liang He 1, Wen-Qing Wu 2, Zhao-Liang Fei 2, Hong-Bin Ji 2, Lei Zhang 8, Chang-Lin Mei 9
Affiliations
- PMID: 26574480
- PMCID: PMC4727597
- DOI: 10.1042/CS20150385
Involvement of the Hippo pathway in regeneration and fibrogenesis after ischaemic acute kidney injury: YAP is the key effector
Jing Xu et al. Clin Sci (Lond). 2016 Mar.
Abstract
Renal tubule cells can recover after they undergo AKI (acute kidney injury). An incomplete repair of renal tubules can result in progressive fibrotic CKD (chronic kidney disease). Studies have revealed the relationship between tubular epithelial cells and kidney fibrogenesis. However, the underlying mechanism remains unclear. Hippo pathway components were evaluated in complete/incomplete repair of I/R (ischaemia/reperfusion) AKI rat models, HK-2 cells and AKI human renal biopsy samples. We found that the expression levels of the Hippo pathway components changed dynamically during kidney regeneration and fibrogenesis in rat models of I/R-induced AKI and human renal biopsy samples. The transcription cofactor YAP (Yes-associated protein) might be a key effector of renal regeneration and fibrogenesis. Our results showed further that YAP might elicit both beneficial and detrimental effects on I/R AKI. After I/R injury occurred, YAP could promote the repair of the injured epithelia. The constant YAP increase and activation might be related to interstitial fibrosis and abnormal renal tubule differentiation. These results indicate that the proper modulation of the Hippo pathway, specifically the transcription cofactor YAP, during repair might be a potent therapeutic target in AKI-CKD transition after I/R injury.
Keywords: Hippo pathway; Yes-associated protein (YAP); acute kidney injury; chronic kidney disease; fibrogenesis; repair.
© 2016 The Author(s).
Figures
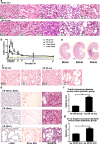
Figure 1. Renal function and pathology of complete and incomplete repair in I/R AKI models
(a) H&E staining (×200 magnification) of AKI models over time after I/R (_n_=3 rats in each group). Scale bar, 100 μm. (b) Changes in serum blood urea nitrogen (BUN) over time in AKI rat models, including mild and severe I/R. **P<0.01 for I/R (_n_=5) compared with control (n_=3); Δ_P<0.05 for I/R (_n_=5) compared with sham (_n_=3); #P<0.05 for I/R 45 min (_n_=5) compared with 30 min (_n_=5). Results are means±S.E.M. (c) PAS staining (×200 magnification) of I/R AKI models after 4 weeks of reperfusion (_n_=3 rats in each group). Scale bar, 100 μm. (d) Fibrosis analysis of the I/R AKI models after 4 weeks of reperfusion (_n_=3 rats in each group). Left: immunostaining of αSMA (×200 magnification). Scale bar, 50 μm. Middle: Sirius Red staining showing collagen deposition with red appearance (×100 magnification). Scale bar, 100 μm. Right: Masson's trichrome staining (×100 magnification) showing fibrosis as blue appearance. Scale bar, 100 μm. (e) H&E staining of the longitudinal sections from the kidneys subjected to 4 weeks of reperfusion (_n_=3 rats in each group). Scale bar, 200 μm. (f) Ratio of the diameters of transverse tubules in the I/R 30 and I/R 45 min groups after 4 weeks of reperfusion compared with sham operation group (_n_=3 rats in each group, 100 tubules in each rat). Results are means±S.E.M. (g) Ratio of the coefficient of variation (CV) of the diameters of transverse tubules in I/R 30 and I/R 45 min groups after 4 weeks of reperfusion after I/R compared with sham operation group (_n_=3 rats in each group, 100 tubules in each rat). Results are means±S.E.M.
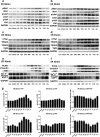
Figure 2. Changes in expression of the key Hippo pathway components and differentiation proteins over time
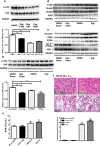
(a) Western blot of Mst1/pMst1, Lats1/pLats1 and YAP/pYAP in I/R 30 min rats (_n_=3). (b) Western blot of Mst1/pMst1, Lats1/pLats1 and YAP/pYAP in I/R 45 min rats (_n_=3). (c) Western blot of CTGF, TEAD2, TEAD3 and Vgll4 in I/R 30 min rats (_n_=3). (d) Western blot of CTGF, TEAD2, TEAD3 and Vgll4 in I/R 45 min rats (_n_=3). (e) Western blot of differentiation and dedifferentiation markers in I/R 30 min rats (_n_=3). (f) Western blot of the differentiation and dedifferentiation markers in I/R 45 min rats (_n_=3). (g) Quantification of immunoblots of YAP and pYAP and relative ratio of pYAP to total YAP in 30 and I/R 45 min rats normalized to GAPDH (_n_=3). con, control.
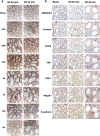
Figure 3. Immunohistochemical staining of YAP and immunostaining of serial sections of YAP co-expressed with differentiation markers
(a) Immunostaining of YAP (×400 magnification) over time after I/R in 30 and 45 min groups. Scale bar, 20 μm. (b) Immunostaining of serial sections of YAP co-expressed with differentiation markers (×400 magnification) over time after I/R in 30 and 45 min groups. Scale bar, 20 μm.
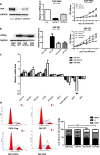
Figure 4. Analysis of YAP overexpression and RNAi in HK-2 cells
(a) YAP RNAi slowed the proliferation of HK-2 cells. Results are means±S.E.M. (b) YAP overexpression (OE) promoted the proliferation of HK-2 cells. Results are means±S.E.M. (c) Quantification of mRNA levels of pro-fibrogenic and differentiation genes in YAP-overexpressing HK-2 cells. The mRNA levels are presented as mean±S.E.M. fold induction over the empty vector-transfected control. *P<0.05 compared with control. (d) Cell cycle analysis through propidium iodide staining of YAP-overexpressing HK-2 cells. Results in the histogram are means±S.E.M. For comparison of G2/M phases, *P<0.05 compared with control; **P<0.01 compared with control. CMV, cytomegalovirus; WT, wild-type.
Figure 5. YAP agonist treatment in vitro and in vivo in the I/R 45 min AKI models
(a) Western blot of the pYAP/YAP ratio in HK-2 cells with an increased gradient of digitoxin concentration after 24 h of incubation. DMSO was added as control. Quantification of immunoblots of the pYAP/YAP ratio. Results are means±S.E.M. ***P<0.001 compared with control. (b) Western blot of pYAP and YAP in DMSO- and digitoxin-treated I/R 45 min rat models 4 weeks after reperfusion. Quantification of immunoblots comparing pYAP/YAP ratio between groups. Results are means±S.E.M. *P<0.05 compared with DMSO-treated sham operation group (_n_=3); **P<0.01 compared with DMSO-treated sham operation group (_n_=3). (c) Serum blood urea nitrogen (BUN) after I/R injury followed by DMSO or digitoxin treatment for 4 weeks. Results are means±S.E.M. **P<0.01 for digitoxin-treated I/R (_n_=4) and sham operation (_n_=3) compared with DMSO-treated sham operation (_n_=3); *P<0.05 for DMSO-treated I/R (_n_=3) compared with sham operation (_n_=3); #P<0.05 for digitoxin-treated I/R (_n_=4) compared with DMSO-treated I/R (_n_=3). (d) Western blot of CTGF, TEAD2, TEAD3 and Vgll4 (_n_=3). (e) Western blot of the differentiation and dedifferentiation markers (_n_=3). (f) Masson's trichrome staining (×100 magnification) showing fibrosis as blue appearance (_n_=3). Scale bar, 100 μm. Quantification results are means±S.E.M. Digi, digitoxin.
Figure 6. Pathological features and YAP immunostaining in AKI human biopsy samples
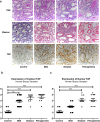
(a) PAS staining (×400 magnification) showing morphology changes in AKI groups. Scale bar, 20 μm (top). Masson's trichrome staining (×400 magnification) showing fibrosis as blue appearance. Scale bar, 20 μm (middle). YAP immunostaining (×400 magnification). Scale bar, 20 μm (bottom). (b) Cytosolic and nuclear YAP expression in different AKI groups compared with controls. **P<0.01 compared with control; ***P<0.001 compared with control; #P<0.05 compared with mild-regenerating group.
Similar articles
- KLF4 initiates sustained YAP activation to promote renal fibrosis in mice after ischemia-reperfusion kidney injury.
Xu D, Chen PP, Zheng PQ, Yin F, Cheng Q, Zhou ZL, Xie HY, Li JY, Ni JY, Wang YZ, Chen SJ, Zhou L, Wang XX, Liu J, Zhang W, Lu LM. Xu D, et al. Acta Pharmacol Sin. 2021 Mar;42(3):436-450. doi: 10.1038/s41401-020-0463-x. Epub 2020 Jul 9. Acta Pharmacol Sin. 2021. PMID: 32647339 Free PMC article. - EGF Receptor-Dependent YAP Activation Is Important for Renal Recovery from AKI.
Chen J, You H, Li Y, Xu Y, He Q, Harris RC. Chen J, et al. J Am Soc Nephrol. 2018 Sep;29(9):2372-2385. doi: 10.1681/ASN.2017121272. Epub 2018 Aug 2. J Am Soc Nephrol. 2018. PMID: 30072422 Free PMC article. - Hippo-YAP/MCP-1 mediated tubular maladaptive repair promote inflammation in renal failed recovery after ischemic AKI.
Zheng Z, Li C, Shao G, Li J, Xu K, Zhao Z, Zhang Z, Liu J, Wu H. Zheng Z, et al. Cell Death Dis. 2021 Jul 30;12(8):754. doi: 10.1038/s41419-021-04041-8. Cell Death Dis. 2021. PMID: 34330891 Free PMC article. - The Hippo pathway and its correlation with acute kidney injury.
Zhang C, Li CL, Xu KX, Zheng ZH, Cheng GZ, Wu HJ, Liu J. Zhang C, et al. Zool Res. 2022 Sep 18;43(5):897-910. doi: 10.24272/j.issn.2095-8137.2022.110. Zool Res. 2022. PMID: 36052554 Free PMC article. Review. - Targeting YAP and Hippo signaling pathway in liver cancer.
Liu AM, Xu MZ, Chen J, Poon RT, Luk JM. Liu AM, et al. Expert Opin Ther Targets. 2010 Aug;14(8):855-68. doi: 10.1517/14728222.2010.499361. Expert Opin Ther Targets. 2010. PMID: 20545481 Review.
Cited by
- Hazel Leaf Polyphenol Extract Alleviated Cisplatin-Induced Acute Kidney Injury by Reducing Ferroptosis through Inhibiting Hippo Signaling.
Sun M, Chang H, Jiang F, Zhang W, Yang Q, Wang X, Lv G, Lin H, Luo H, Lin Z, Wang Y. Sun M, et al. Molecules. 2024 Apr 11;29(8):1729. doi: 10.3390/molecules29081729. Molecules. 2024. PMID: 38675549 Free PMC article. - LATS2 degradation promoted fibrosis damage and rescued by vitamin K3 in lupus nephritis.
Cheng C, Yang H, Yang C, Xie J, Wang J, Cheng L, He J, Li H, Yuan H, Guo F, Li M, Liu S. Cheng C, et al. Arthritis Res Ther. 2024 Mar 9;26(1):64. doi: 10.1186/s13075-024-03292-y. Arthritis Res Ther. 2024. PMID: 38459604 Free PMC article. - From Acute to Chronic: Unraveling the Pathophysiological Mechanisms of the Progression from Acute Kidney Injury to Acute Kidney Disease to Chronic Kidney Disease.
Yeh TH, Tu KC, Wang HY, Chen JY. Yeh TH, et al. Int J Mol Sci. 2024 Feb 1;25(3):1755. doi: 10.3390/ijms25031755. Int J Mol Sci. 2024. PMID: 38339031 Free PMC article. Review. - YAP nuclear translocation induced by HIF-1α prevents DNA damage under hypoxic conditions.
Chang HA, Ou Yang RZ, Su JM, Nguyen TMH, Sung JM, Tang MJ, Chiu WT. Chang HA, et al. Cell Death Discov. 2023 Oct 20;9(1):385. doi: 10.1038/s41420-023-01687-5. Cell Death Discov. 2023. PMID: 37863897 Free PMC article. - Inflammatory Networks in Renal Cell Carcinoma.
Kruk L, Mamtimin M, Braun A, Anders HJ, Andrassy J, Gudermann T, Mammadova-Bach E. Kruk L, et al. Cancers (Basel). 2023 Apr 9;15(8):2212. doi: 10.3390/cancers15082212. Cancers (Basel). 2023. PMID: 37190141 Free PMC article. Review.
References
- Bonventre J.V. Pathophysiology of AKI: injury and normal and abnormal repair: contributions to nephrology. 2010. 165, 9–17. - PubMed
Publication types
MeSH terms
Substances
LinkOut - more resources
Full Text Sources
Other Literature Sources
