Improved transcription and translation with L-leucine stimulation of mTORC1 in Roberts syndrome - PubMed (original) (raw)
Improved transcription and translation with L-leucine stimulation of mTORC1 in Roberts syndrome
Baoshan Xu et al. BMC Genomics. 2016.
Abstract
Background: Roberts syndrome (RBS) is a human developmental disorder caused by mutations in the cohesin acetyltransferase ESCO2. We previously reported that mTORC1 signaling was depressed and overall translation was reduced in RBS cells and zebrafish models for RBS. Treatment of RBS cells and zebrafish RBS models with L-leucine partially rescued mTOR function and protein synthesis, correlating with increased cell division and improved development.
Results: In this study, we use RBS cells to model mTORC1 repression and analyze transcription and translation with ribosome profiling to determine gene-level effects of L-leucine. L-leucine treatment partially rescued translational efficiency of ribosomal subunits, translation initiation factors, snoRNA production, and mitochondrial function in RBS cells, consistent with these processes being mTORC1 controlled. In contrast, other genes are differentially expressed independent of L-leucine treatment, including imprinted genes such as H19 and GTL2, miRNAs regulated by GTL2, HOX genes, and genes in nucleolar associated domains.
Conclusions: Our study distinguishes between gene expression changes in RBS cells that are TOR dependent and those that are independent. Some of the TOR independent gene expression changes likely reflect the architectural role of cohesin in chromatin looping and gene expression. This study reveals the dramatic rescue effects of L-leucine stimulation of mTORC1 in RBS cells and supports that normal gene expression and translation requires ESCO2 function.
Figures
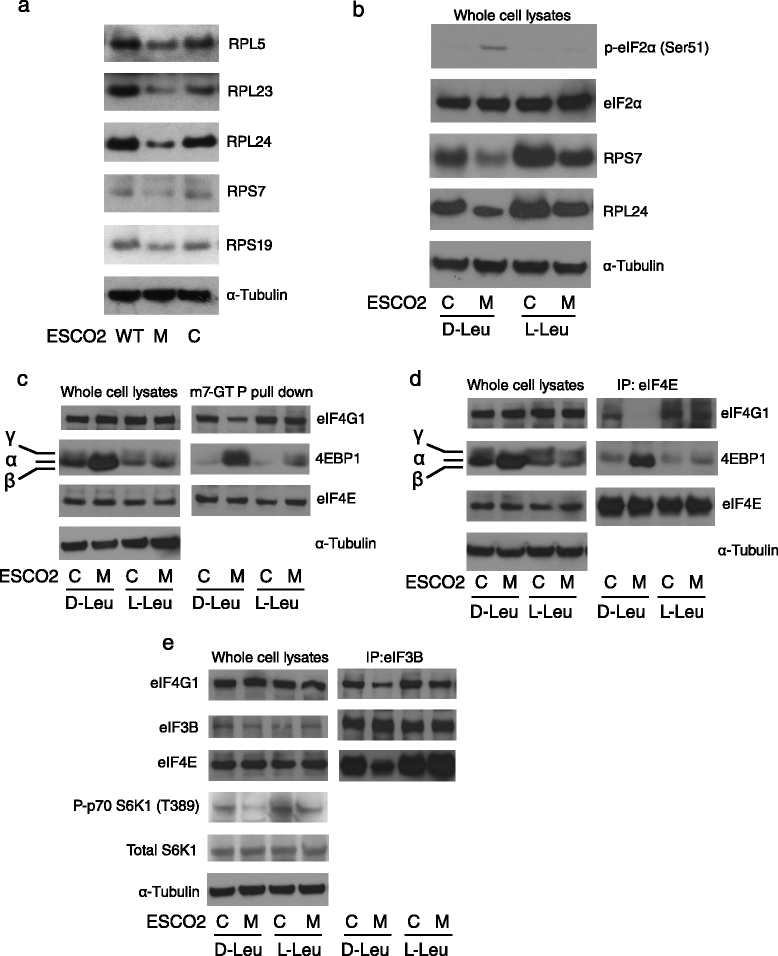
Fig. 1
Ribosomal components and translation initiation complexes were present at low levels in RBS cells. a Western blotting showed that 40S small ribosome proteins RPS7 and RPS19, and 60S large ribosome proteins RPL5, RPL23, and RPL24 were decreased in ESCO2 mutant (M) compared to WT fibroblasts (WT) or corrected fibroblasts (C). b L-Leu supplement, but not D-Leu, partially rescued RPS7 and RPL24 protein levels, and reversed the elevation of eIF2α phosphorylation in RBS cells. α-Tubulin and eiF2α serve as loading controls. c m7-GTP coupled beads were used to pull down translation initiation complexes from whole cell lysates. 4EBP1 protein was strongly enriched in RBS cells, accompanied by less binding of eIF4G1, but this trend was partially reversed in RBS cells treated with L-Leu. eIF4E levels were not affected. d Antibodies to eIF4E were used to pull down translation initiation complexes. 4EBP1 was present at high levels in RBS cells, correlating with less eIF4G1 and the inhibition of translation initiation. L-Leu supplement promoted the assembly of the translation competent eIF4E complex. e Antibodies to eIF3B were used to pull down translation initiation complexes. eIF4E and eIF4G1 were present at lower levels in RBS cells, but this trend was partially reversed by L-Leu supplement
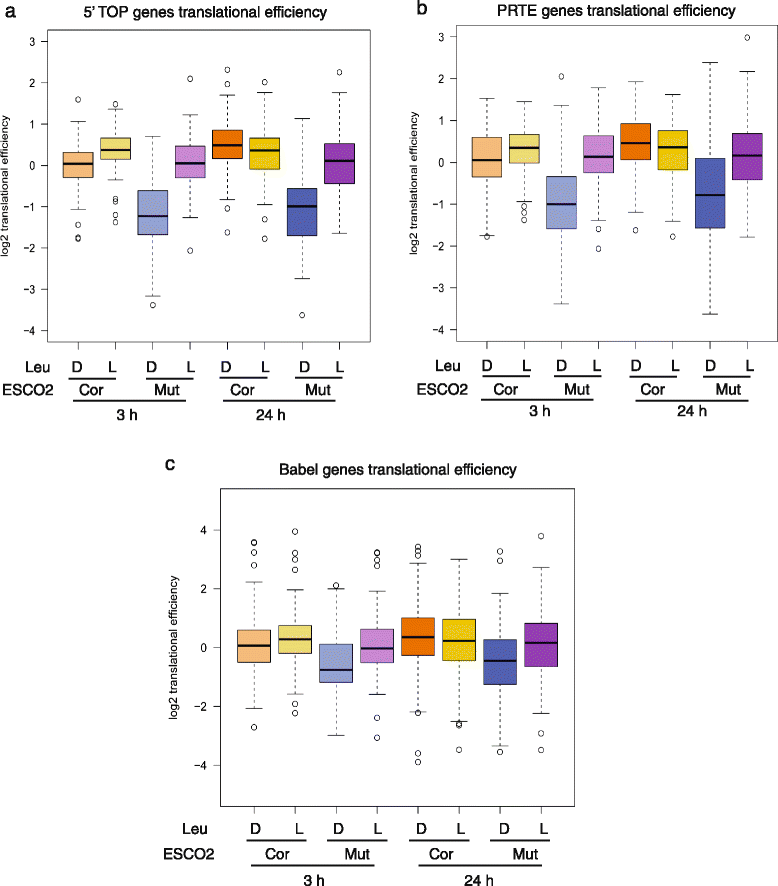
Fig. 2
L-Leu increased translation of genes with poor translational efficiency in RBS cells. The corrected (cor) and RBS mutant (mut) cells were treated with either D-Leu or L-Leu for 3 h or 24 h. Cells were collected for ribosome profiling. a The boxplot shows the translational efficiency for genes with a 5’ TOP sequence. These mRNAs showed poor translational efficiency in RBS cells, which was partly rescued by L-Leu treatment. Corrected cells with D-Leu 24 h versus Mutant cells with D-Leu 24 h, P = 6.9e-22; Mutant cells with L-Leu 24 h versus Mutant cells with D-Leu 24 h, P = 4.4e-14; Corrected cells with D-Leu 3 h versus Mutant cells with D-Leu 3 h, P = 8.8e-16; Mutant cells with L-Leu 3 h versus Mutant cells with D-Leu 3 h, P = 1.9e-16. b The boxplot shows the translational efficiency for genes with a PRTE sequence. These mRNAs showed poor translational efficiency in RBS cells that was partially improved by L-Leu. Corrected cells with D-Leu 24 h versus Mutant cells with D-Leu 24 h, P = 7.1e-14; Mutant cells with L-Leu 24 h versus Mutant cells with D-Leu 24 h, P = 8.5e-9; Corrected cells with D-Leu 3 h versus Mutant cells with D-Leu 3 h, P = 2.8e-14; Mutant cells with L-Leu 3 h versus Mutant cells with D-Leu 3 h, P = 5.3e-15. c The boxplot shows the translational efficiency for genes previously defined to be hypersensitive to mTOR inhibition via Babel analysis [28]. These mRNAs showed poor translational efficiency in RBS cells that was partially improved by L-Leu. Corrected cells with D-Leu 24 h versus Mutant cells with D-Leu 24 h, P = 0.0002; Mutant cells with L-Leu 24 h versus Mutant cells with D-Leu 24 h, P = 0.14; Corrected cells with D-Leu 3 h versus Mutant cells with D-Leu 3 h, P = 3.5e-8; Mutant cells with L-Leu 3 h versus Mutant cells with D-Leu 3 h, P = 2.1e-6
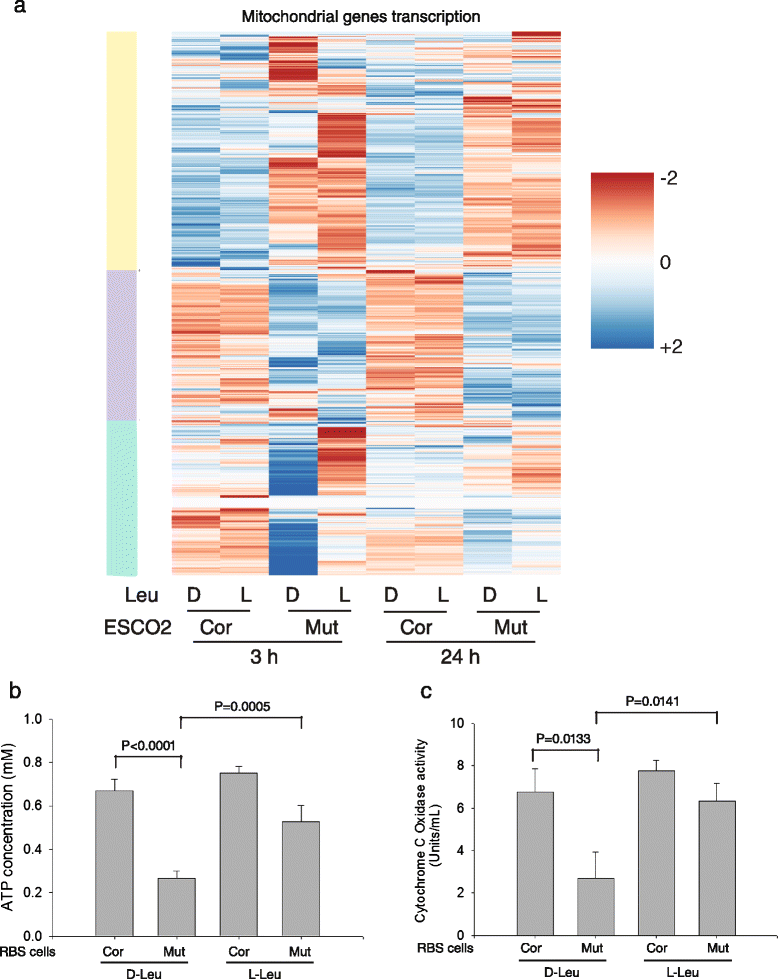
Fig. 3
L-Leu treatment partially rescued mitochondrial function in RBS cells. a The heatmap shows that genes with mitochondrial function are differentially expressed in RBS cells. The yellow and purple bars indicate gene groups that are downregulated or upregulated, respectively, in the mutant cells, and are unresponsive to leucine. The subgroup that is affected by L-leucine treatment in the RBS cells is indicated by the green bar. See Additional file 2: Table S9 for GO terms for the leucine responsive cluster. b Intracellular ATP concentration was low in RBS cells but significantly improved by L-Leu treatment for 24 h. c Cytochrome c oxidase activity was impaired in RBS cells but significantly improved by L-Leu supplement for 24 h. For b and c error bars represent standard deviation of three biological replicates and the p value was calculated from a _t_-test
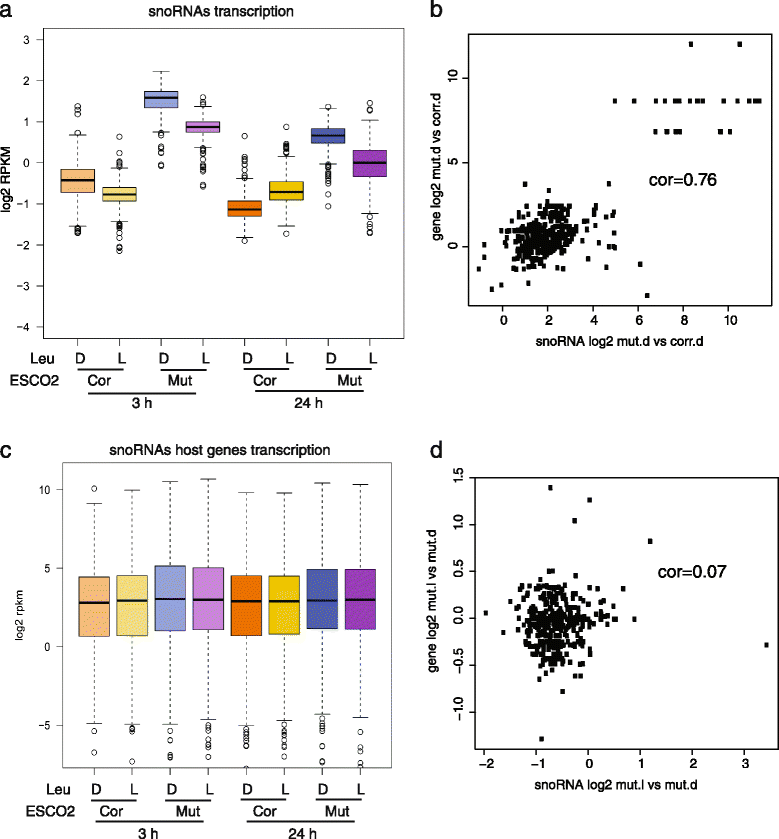
Fig. 4
High levels of snoRNAs in RBS cells were partially reduced by L-Leu treatment. We selected a group of 379 snoRNA genes based on the biotype “snoRNA” and having the words “C/D box” or “H/ACA box” in the description field from ensembl. a The boxplot shows the expression of these genes is increased in RBS cells, but partly reduced with L-Leu treatment (gene data in Additional file 2: Table S11). Corrected cells with D-Leu 24 h versus Mutant cells with D-Leu 24 h, P = 1.4e-275; Mutant cells with L-Leu 24 h versus Mutant cells with D-Leu 24 h, P = 3e-53; Corrected cells with D-Leu 3 h versus Mutant cells with D-Leu 3 h, P = 7.6e-243; Mutant cells with L-Leu 3 h versus Mutant cells with D-Leu 3 h, P = 7.1e-98. P values in a and c were generated using a t test. b The scatter plot depicts the log2 fold change for snoRNAs in RBS mutant vs corrected at 3 h D-Leu (x axis) versus the same for host genes (y axis). The correlation is 0.76. c The boxplot shows the snoRNA host gene expression was not significantly different between corrected cells and mutant cells, and the host gene expression is not affected by L-Leu treatment. Corrected cells with D-Leu 24 h versus Mutant cells with D-Leu 24 h, P = 0.3; Mutant cells with L-Leu 24 h versus Mutant cells with D-Leu 24 h, P = 0.96; Corrected cells with D-Leu 3 h versus Mutant cells with D-Leu 3 h, P = 0.1; Mutant cells with L-Leu 3 h versus Mutant cells with D-Leu 3 h, P = 0.62. d The scatter plot depicts the log2 fold change for snoRNAs in RBS mutant L-Leu vs D-Leu at 3 h (x axis) versus the same for host genes (y axis). The correlation is 0.07
Fig. 5
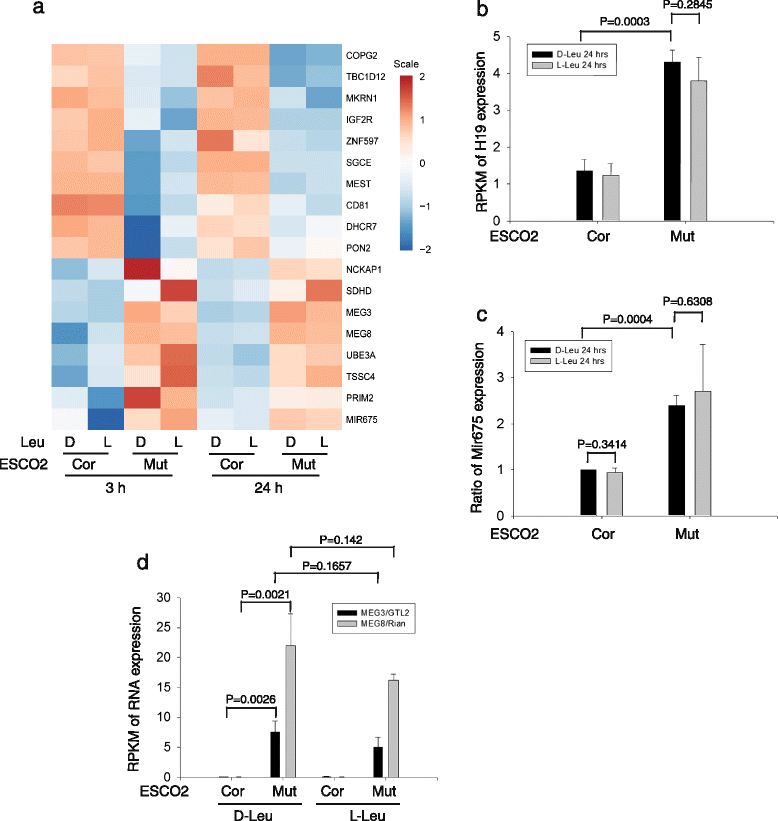
Imprinted genes are differentially expressed in RBS cells. a A heatmap displays the expression pattern of various imprinted genes in RBS and corrected cells with or without L-Leu. b The histograms show the average from three biological samples and the error bar indicates the standard deviation. The results are shown from 24 h treatment with L-Leu. The data from the 3 h treatment showed a similar pattern. H19 was upregulated ~ 4 fold in the mutant cells relative to the corrected cells. c The micro-RNA 675 was elevated ~ 3 fold in the mutant cells. d The imprinted MEG3/GTL2 and MEG8/Rian genes were markedly increased in expression in RBS cells
Fig. 6
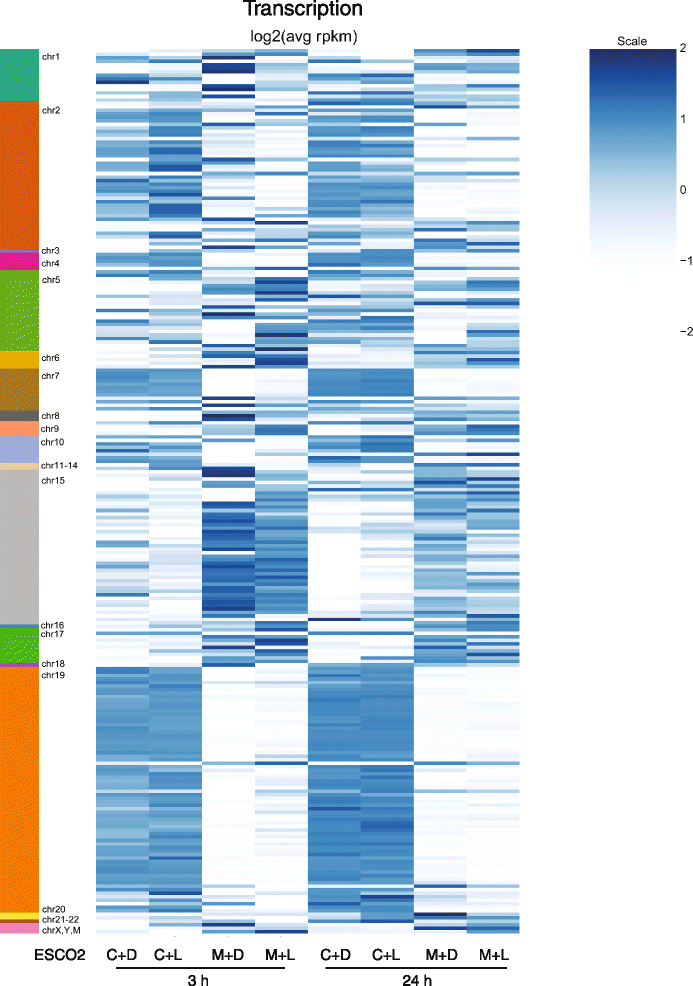
Nucleolar associated genes are differentially expressed in RBS cells. Expression levels of genes located in nucleolar associated domains (NADs, indicated on the left) is shown in a heatmap for corrected cells (C) and RBS cells (M) treated with either D-Leu (D) or L-Leu (L) for 3 or 24 h. Within each domain, genes tend to show a similar pattern, although some domains show increased expression in the corrected cells while others show reduced expression. In general these patterns are unaffected by the addition of L-leucine. Data can be found in Additional file 2: Table S13
Similar articles
- Stimulation of mTORC1 with L-leucine rescues defects associated with Roberts syndrome.
Xu B, Lee KK, Zhang L, Gerton JL. Xu B, et al. PLoS Genet. 2013;9(10):e1003857. doi: 10.1371/journal.pgen.1003857. Epub 2013 Oct 3. PLoS Genet. 2013. PMID: 24098154 Free PMC article. - An ever-changing landscape in Roberts syndrome biology: Implications for macromolecular damage.
Mfarej MG, Skibbens RV. Mfarej MG, et al. PLoS Genet. 2020 Dec 31;16(12):e1009219. doi: 10.1371/journal.pgen.1009219. eCollection 2020 Dec. PLoS Genet. 2020. PMID: 33382686 Free PMC article. Review. - A zebrafish model of Roberts syndrome reveals that Esco2 depletion interferes with development by disrupting the cell cycle.
Mönnich M, Kuriger Z, Print CG, Horsfield JA. Mönnich M, et al. PLoS One. 2011;6(5):e20051. doi: 10.1371/journal.pone.0020051. Epub 2011 May 26. PLoS One. 2011. PMID: 21637801 Free PMC article. - Establishment and characterization of Roberts syndrome and SC phocomelia model medaka (Oryzias latipes).
Morita A, Nakahira K, Hasegawa T, Uchida K, Taniguchi Y, Takeda S, Toyoda A, Sakaki Y, Shimada A, Takeda H, Yanagihara I. Morita A, et al. Dev Growth Differ. 2012 Jun;54(5):588-604. doi: 10.1111/j.1440-169X.2012.01362.x. Dev Growth Differ. 2012. PMID: 22694322 - The non-redundant function of cohesin acetyltransferase Esco2: some answers and new questions.
Whelan G, Kreidl E, Peters JM, Eichele G. Whelan G, et al. Nucleus. 2012 Jul 1;3(4):330-4. doi: 10.4161/nucl.20440. Epub 2012 May 22. Nucleus. 2012. PMID: 22614755 Review.
Cited by
- Exploring Evidence of Non-coding RNA Translation With Trips-Viz and GWIPS-Viz Browsers.
Zaheed O, Kiniry SJ, Baranov PV, Dean K. Zaheed O, et al. Front Cell Dev Biol. 2021 Aug 12;9:703374. doi: 10.3389/fcell.2021.703374. eCollection 2021. Front Cell Dev Biol. 2021. PMID: 34490252 Free PMC article. - Translational regulation and protein-coding capacity of the 5' untranslated region of human TREM2.
Yanaizu M, Adachi H, Araki M, Kontani K, Kino Y. Yanaizu M, et al. Commun Biol. 2023 Jun 8;6(1):616. doi: 10.1038/s42003-023-04998-6. Commun Biol. 2023. PMID: 37291187 Free PMC article. - Cell and Signal Components of the Microenvironment of Bone Metastasis Are Affected by Hypoxia.
Bendinelli P, Maroni P, Matteucci E, Desiderio MA. Bendinelli P, et al. Int J Mol Sci. 2016 May 11;17(5):706. doi: 10.3390/ijms17050706. Int J Mol Sci. 2016. PMID: 27187355 Free PMC article. Review. - A novel spiroindoline targets cell cycle and migration via modulation of microtubule cytoskeleton.
Kumar N, Hati S, Munshi P, Sen S, Sehrawat S, Singh S. Kumar N, et al. Mol Cell Biochem. 2017 May;429(1-2):11-21. doi: 10.1007/s11010-016-2932-6. Epub 2017 Feb 17. Mol Cell Biochem. 2017. PMID: 28213771 - Limb reduction in an Esco2 cohesinopathy mouse model is mediated by p53-dependent apoptosis and vascular disruption.
Strasser AS, Gonzalez-Reiche AS, Zhou X, Valdebenito-Maturana B, Ye X, Zhang B, Wu M, van Bakel H, Jabs EW. Strasser AS, et al. Nat Commun. 2024 Aug 21;15(1):7154. doi: 10.1038/s41467-024-51328-3. Nat Commun. 2024. PMID: 39168984 Free PMC article.
References
Publication types
MeSH terms
Substances
Supplementary concepts
LinkOut - more resources
Full Text Sources
Other Literature Sources
Medical
Molecular Biology Databases
Research Materials
Miscellaneous
