Empirical insights into the stochasticity of small RNA sequencing - PubMed (original) (raw)
Empirical insights into the stochasticity of small RNA sequencing
Li-Xuan Qin et al. Sci Rep. 2016.
Abstract
The choice of stochasticity distribution for modeling the noise distribution is a fundamental assumption for the analysis of sequencing data and consequently is critical for the accurate assessment of biological heterogeneity and differential expression. The stochasticity of RNA sequencing has been assumed to follow Poisson distributions. We collected microRNA sequencing data and observed that its stochasticity is better approximated by gamma distributions, likely because of the stochastic nature of exponential PCR amplification. We validated our findings with two independent datasets, one for microRNA sequencing and another for RNA sequencing. Motivated by the gamma distributed stochasticity, we provided a simple method for the analysis of RNA sequencing data and showed its superiority to three existing methods for differential expression analysis using three data examples of technical replicate data and biological replicate data.
Conflict of interest statement
The authors declare no competing financial interests.
Figures
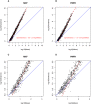
Figure 1. Scatter plots of miRNA-specific variance versus the miRNA-specific mean number of reads on the logarithmic scale for the MXF sample (A) and the PMFH sample (B).
Panels (C,D) focus on the low-read portion of the same plots. Blue solid line is the diagonal. Red dashed line is the fitted straight line for the high-read miRNAs in each sample, with the formula of the fitted line provided in red.
Figure 2. Scatter plots of the miRNA-specific p-values for the Kolmogorov-Smirnov goodness-of-fit test assuming a Poisson distribution (blue points) or a gamma distribution (red points) versus the miRNA-specific logarithmic mean.
(A) MXF; (B) PMFH.
Figure 3
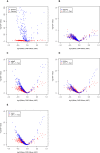
(A) Volcano plot of fold change and statistical significance for differential miRNA expression. The miRNA-specific –log10(p-value) for comparing MXF and PMFH based on a Poisson distribution assumption (blue points) or a gamma distribution assumption (red points) is plotted against the miRNA-specific logarithmic mean ratio between MXF and PMFH. (B–E) Volcano plots comparing the p-values for differential miRNA expression based on the two-sample t-test after cubic root transformation (CRT) (red points) versus the p-values based on the generalized linear model method assuming a gamma distribution (blue points) (B), edgeR (blue points) (C), DESeq (blue points) (D), and voom (blue points) (E).
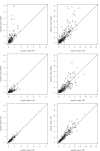
Figure 4. Scatterplot of the −log10(p-value) for differential miRNA expression based on the two-sample t-test after cubic root transformation (CRT) versus the −log10(p-value) based on edgeR (top panels), DESeq (middle panels), and voom (bottom panels).
The left column shows data for the TCGA ovarian cancer study comparing platinum-sensitive versus platinum-resistant tumors; the right column shows data for a breast cancer study comparing invasive ductal carcinoma versus normal breast tissue. Analysis was done for high-read genes (defined as mean reads >10) for each study.
Similar articles
- miRquant 2.0: an Expanded Tool for Accurate Annotation and Quantification of MicroRNAs and their isomiRs from Small RNA-Sequencing Data.
Kanke M, Baran-Gale J, Villanueva J, Sethupathy P. Kanke M, et al. J Integr Bioinform. 2016 Dec 22;13(5):307. doi: 10.2390/biecoll-jib-2016-307. J Integr Bioinform. 2016. PMID: 28187421 - Differential expression analysis of RNA sequencing data by incorporating non-exonic mapped reads.
Chen HI, Liu Y, Zou Y, Lai Z, Sarkar D, Huang Y, Chen Y. Chen HI, et al. BMC Genomics. 2015;16 Suppl 7(Suppl 7):S14. doi: 10.1186/1471-2164-16-S7-S14. Epub 2015 Jun 11. BMC Genomics. 2015. PMID: 26099631 Free PMC article. - Assessment of microRNA differential expression and detection in multiplexed small RNA sequencing data.
Campbell JD, Liu G, Luo L, Xiao J, Gerrein J, Juan-Guardela B, Tedrow J, Alekseyev YO, Yang IV, Correll M, Geraci M, Quackenbush J, Sciurba F, Schwartz DA, Kaminski N, Johnson WE, Monti S, Spira A, Beane J, Lenburg ME. Campbell JD, et al. RNA. 2015 Feb;21(2):164-71. doi: 10.1261/rna.046060.114. Epub 2014 Dec 17. RNA. 2015. PMID: 25519487 Free PMC article. - The use of high-throughput sequencing methods for plant microRNA research.
Ma X, Tang Z, Qin J, Meng Y. Ma X, et al. RNA Biol. 2015;12(7):709-19. doi: 10.1080/15476286.2015.1053686. RNA Biol. 2015. PMID: 26016494 Free PMC article. Review. - Separating measurement and expression models clarifies confusion in single-cell RNA sequencing analysis.
Sarkar A, Stephens M. Sarkar A, et al. Nat Genet. 2021 Jun;53(6):770-777. doi: 10.1038/s41588-021-00873-4. Epub 2021 May 24. Nat Genet. 2021. PMID: 34031584 Free PMC article. Review.
Cited by
- Statistical Assessment of Depth Normalization for Small RNA Sequencing.
Qin LX, Zou J, Shi J, Lee A, Mihailovic A, Farazi TA, Tuschl T, Singer S. Qin LX, et al. JCO Clin Cancer Inform. 2020 Jun;4:567-582. doi: 10.1200/CCI.19.00118. JCO Clin Cancer Inform. 2020. PMID: 32598180 Free PMC article. - Evaluation of commercially available small RNASeq library preparation kits using low input RNA.
Yeri A, Courtright A, Danielson K, Hutchins E, Alsop E, Carlson E, Hsieh M, Ziegler O, Das A, Shah RV, Rozowsky J, Das S, Van Keuren-Jensen K. Yeri A, et al. BMC Genomics. 2018 May 5;19(1):331. doi: 10.1186/s12864-018-4726-6. BMC Genomics. 2018. PMID: 29728066 Free PMC article. - RNA-Based Therapeutics: From Antisense Oligonucleotides to miRNAs.
Bajan S, Hutvagner G. Bajan S, et al. Cells. 2020 Jan 7;9(1):137. doi: 10.3390/cells9010137. Cells. 2020. PMID: 31936122 Free PMC article. Review. - Modeling bias and variation in the stochastic processes of small RNA sequencing.
Argyropoulos C, Etheridge A, Sakhanenko N, Galas D. Argyropoulos C, et al. Nucleic Acids Res. 2017 Jun 20;45(11):e104. doi: 10.1093/nar/gkx199. Nucleic Acids Res. 2017. PMID: 28369495 Free PMC article.
References
Publication types
MeSH terms
Substances
Grants and funding
- CA151947/CA/NCI NIH HHS/United States
- R01 CA151947/CA/NCI NIH HHS/United States
- P30 CA008748/CA/NCI NIH HHS/United States
- CA008748/CA/NCI NIH HHS/United States
- CA140146/CA/NCI NIH HHS/United States
- P50 CA140146/CA/NCI NIH HHS/United States
LinkOut - more resources
Full Text Sources
Other Literature Sources


