Gut Microbiota Drive Autoimmune Arthritis by Promoting Differentiation and Migration of Peyer's Patch T Follicular Helper Cells - PubMed (original) (raw)
Gut Microbiota Drive Autoimmune Arthritis by Promoting Differentiation and Migration of Peyer's Patch T Follicular Helper Cells
Fei Teng et al. Immunity. 2016.
Abstract
Gut microbiota profoundly affect gut and systemic diseases, but the mechanism whereby microbiota affect systemic diseases is unclear. It is not known whether specific microbiota regulate T follicular helper (Tfh) cells, whose excessive responses can inflict antibody-mediated autoimmunity. Using the K/BxN autoimmune arthritis model, we demonstrated that Peyer's patch (PP) Tfh cells were essential for gut commensal segmented filamentous bacteria (SFB)-induced systemic arthritis despite the production of auto-antibodies predominantly occurring in systemic lymphoid tissues, not PPs. We determined that SFB, by driving differentiation and egress of PP Tfh cells into systemic sites, boosted systemic Tfh cell and auto-antibody responses that exacerbated arthritis. SFB induced PP Tfh cell differentiation by limiting the access of interleukin 2 to CD4(+) T cells, thereby enhancing Tfh cell master regulator Bcl-6 in a dendritic cell-dependent manner. These findings showed that gut microbiota remotely regulated a systemic disease by driving the induction and egress of gut Tfh cells.
Copyright © 2016 Elsevier Inc. All rights reserved.
Figures
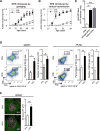
Figure 1. SFB Exacerbate Arthritis in Specific-Pathogen-Free K/BxN Mice
(A and B) SFB+ groups were established by one of two methods. Directly gavaging the experimental mice derived from SFB− breeders with SFB (A). The SFB− mice were the ungavaged littermate controls (n = 8–11 mice/group). Alternatively, gavaging the mother first to later give birth to the SFB+ K/BxN litters (B). The SFB− groups were derived from an ungavaged mother (n = 6–8 mice/group). Results are shown as mean ankle thickening ± SEM. (C) Serum anti-GPI Ab titers were determined by ELISA and are shown as mean + SEM. (D) Splenocytes or PLN cells from SFB− or SFB+ K/BxN mice were stained with Abs against CD19, CD4, Fas, and PNA (peanut agglutinin). Values in the representative plots indicate the percentage of GC B cells (Fas+PNA+) in total CD19+ B cells. The quantitative data (mean + SEM) are also shown (n = 16/group, data combined from 7 assays). (E) The area of each GC (PNA+B220+) from splenic cryostat sections is shown. The quantitative results are a combination of 24 GCs measured from four spleens in both SFB− and SFB+ K/BxN mice. Asterisks indicate statistical significance, *p < 0.05, **p < 0.01, ***p < 0.001. See also Figure S1.
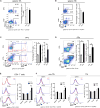
Figure 2. SFB-Mediated Arthritis Augmentation Is Dependent on Tfh Cell Response
(A) Splenocytes or PLN cells from SFB− or SFB+ K/BxN mice were stained with Abs against CD4, CD19, PD-1, CXCR5, and Bcl-6. Values in the representative plots indicate the percentage of Tfh (PD-1+CXCR5+) cells in total CD4+ T cells. The quantitative data are also shown (n = 16/group, data combined from 7 assays). (B) Splenic cryostat sections were stained with PNA and anti-CD4 Ab. CD4+ T cells in each GC were counted manually and data are shown as mean + SEM (18 GCs in each group). (C and D) SFB− KRN or _Cxcr5_−/−. KRN donor CD4+ T cells were transferred into SFB+ or SFB− _Tcra_−/−. BxN recipients. Ankle thickening (C) of recipient mice is shown. Day 0 indicates the day of cell transfer. Day 14 sera were collected (D) and anti-GPI Ab titers are shown (n = 6/group, data combined from 3 assays). See also Figures S2 and 3.
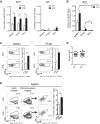
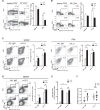
Figure 3. SFB Induce Tfh Cell Differentiation in Peyer’s Patches
(A) Representative plots and quantitative data of splenic Caspase 3/7+ Tfh cells are shown (n = 15/group, data combined from 5 assays). (B) Representative plots and quantitative data of the percentage of EdU+ splenic Tfh cells are shown (n = 7–8/group, 2 assays). (C) Representative plots and quantitative data of Tfh cells are shown (n = 16/group, data combined from 7 assays). (D) Representative plots and quantitative data of GC B cells are shown. (E and F) Representative histogram plots and quantitative MFI of Bcl-6 expression in splenic, PLN, and PP CD4+ T cells (E) or non-Tfh and Tfh cells (F) are shown (n = 16/group, data combined from 7 assays). See also Figures S2 and 4.
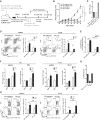
Figure 4. Detection of PP-Derived Tfh Cells in Systemic Lymphoid Tissue where Auto-Abs Are Predominantly Produced
(A and B) Data are shown as an average percentage (A) of anti-GPI ASCs of IgG1 and IgA isotypes among total B cells + SEM. The absolute number (B) of total anti-GPI ASCs of the IgG1 isotype per tissue (e.g., the PLN group included two popliteal LNs and the PP group included all PPs from one intestine) is also shown (n = 8–15/group, data combined from 5 assays). (C) Values in the representative plots indicate the percentage of α4β7-expressing cells in Tfh cells. Quantitative data of the number of integrin α4β7+ Tfh cells are shown (n = 17–22/group, data combined from 8 assays). (D) The number of PPs per intestine from SFB− or SFB+ KBxN mice is shown (n = 19/group). (E) The PP-derived CD4+ T cells in spleen are shown as the KikR+ population, which was further gated (indicated by arrows) on Tfh cell markers. Representative plots and quantitative data are shown (n = 7–8/group, data combined from 4 assays). See also Figure S4.
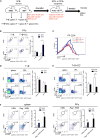
Figure 5. PP Tfh Cells Are Essential for SFB-Induced Systemic Tfh Cell Response and Arthritis
(A) Schematic diagram depicts PP depletion experiment. (B) PP-null and PP-sufficient K/BxN mice were gavaged with SFB or left untreated. Ankle thickening is shown (6–10 mice/group, data combined from 3 assays). (C) At 4.5 weeks old, the fecal SFB level of SFB-gavaged PP-null and PP-sufficient K/BxN mice was determined by qPCR. The fecal SFB level of a Taconic B6 mouse (positive control) was used for sample normalization and its SFB level was set as 1 (n = 16–22/group, data combined from 5 assays). (D) Values in the representative plots indicate the percentage of Tfh cells. Quantitative data of Tfh cell numbers are also shown (n = 8–13/group, data combined from 3 assays). (E) Anti-GPI Ab titers are shown. (F) Tfh and Th17 cell analysis on day 4 or day 7 after the first of three consecutive gavages are shown (n = 10/group, data combined from 3 assays at each time point). (G) Fecal samples from experiments in (F) were collected and their SFB levels are shown. (H) Values in the representative plots indicate the percentage of Th17 cells. Quantitative data of Th17 cell numbers are also shown (n = 8–12/group, data combined from 3 assays). See also Figure S5.
Figure 6. SFB Induce PP Tfh Cells by Inhibiting the IL-2 Signaling Pathway in PP CD4+ T Cells
(A) Representative plots and quantitative data of the percentage of IL-2+ cells in total CD4+ T cells are shown (n = 15–16/group, data combined from 5 assays). (B) Representative plots and quantitative data of the percentage of CD25+ (IL-2Rα+) cells in Foxp3−CD4+ T cells are shown (n = 10/group, data combined from 3 assays). (C) Representative plots and quantitative data of the percentage of Tfh cells in total CD4+ T cells are shown (n = 8–10/group, data combined from 5 assays). (D) Splenocytes from experiments in (C) were stained and analyzed for GC B cells. Data of the percentage of GC B cells are shown. (E and F) Anti-GPI titers (E) and ankle thickness (F) of the mice from experiments in (C) are shown. See also Figure S6.
Figure 7. DCs Are Required for SFB-Mediated Bcl-6 Upregulation and IL-2Rα Suppression in PP CD4+ T Cells
(A) Schematic diagram depicts APC-restricted Ag presentation in the K/BxN transfer model. SFB− donor KRN T cells or APCs were transferred into SFB− or SFB+ _Tcra_−/−. B6 recipients. (B) KRN T cells and B6g7 B cells with (T+B+DC) or without (T+B) B6g7 CD11c+ cells were transferred into _Tcra_−/−. B6 recipients. Representative plots and quantitative data of Tfh cell percentage are shown (n = 9–11/group, data combined from 6 experiments). (C) Histogram overlay of Bcl-6 expression in PP CD4+ T cells. Data are representative of 6 experiments. (D and E) Splenocytes and PP cells from the T+B group (D) or T+B+DC group (E) were stained and analyzed for CD25 (IL-2Rα). The percentage of CD25+ cells in Foxp3−CD4+ T cells are shown (n = 9–11/group, data combined from 6 assays). (F) KRN or _Rag_−/−. KRN CD4+ T cells were transferred into SFB− or SFB+ _Tcra_−/−. BxN recipients. Values in the representative plots indicate the percentage of Tfh cells. Quantitative data of Tfh cell numbers are also shown (n = 8–9/group, data combined from 5 assays). See also Figure S7.
Similar articles
- P2RX7 Deletion in T Cells Promotes Autoimmune Arthritis by Unleashing the Tfh Cell Response.
Felix KM, Teng F, Bates NA, Ma H, Jaimez IA, Sleiman KC, Tran NL, Wu HJ. Felix KM, et al. Front Immunol. 2019 Mar 19;10:411. doi: 10.3389/fimmu.2019.00411. eCollection 2019. Front Immunol. 2019. PMID: 30949163 Free PMC article. - The impact of age and gut microbiota on Th17 and Tfh cells in K/BxN autoimmune arthritis.
Teng F, Felix KM, Bradley CP, Naskar D, Ma H, Raslan WA, Wu HJ. Teng F, et al. Arthritis Res Ther. 2017 Aug 15;19(1):188. doi: 10.1186/s13075-017-1398-6. Arthritis Res Ther. 2017. PMID: 28810929 Free PMC article. - Gut Commensal Segmented Filamentous Bacteria Fine-Tune T Follicular Regulatory Cells to Modify the Severity of Systemic Autoimmune Arthritis.
Bates NA, Li A, Fan T, Cutcliffe MP, Dagenet CB, Sleiman KC, Ma H, Tahsin S, Garrett CS, Altemus J, Wu HJ. Bates NA, et al. J Immunol. 2021 Mar 1;206(5):941-952. doi: 10.4049/jimmunol.2000663. Epub 2021 Jan 18. J Immunol. 2021. PMID: 33462137 Free PMC article. - [T follicular helper (Tfh) cells in autoimmune diseases].
Nakayamada S, Tanaka Y. Nakayamada S, et al. Nihon Rinsho Meneki Gakkai Kaishi. 2016;39(1):1-7. doi: 10.2177/jsci.39.1. Nihon Rinsho Meneki Gakkai Kaishi. 2016. PMID: 27181228 Review. Japanese. - The Roles of Peyer's Patches and Microfold Cells in the Gut Immune System: Relevance to Autoimmune Diseases.
Kobayashi N, Takahashi D, Takano S, Kimura S, Hase K. Kobayashi N, et al. Front Immunol. 2019 Oct 9;10:2345. doi: 10.3389/fimmu.2019.02345. eCollection 2019. Front Immunol. 2019. PMID: 31649668 Free PMC article. Review.
Cited by
- Impact of gut microbiota on gut-distal autoimmunity: a focus on T cells.
Sprouse ML, Bates NA, Felix KM, Wu HJ. Sprouse ML, et al. Immunology. 2019 Apr;156(4):305-318. doi: 10.1111/imm.13037. Epub 2019 Jan 21. Immunology. 2019. PMID: 30560993 Free PMC article. Review. - Microbiome, Autoimmune Diseases and HIV Infection: Friends or Foes?
Pellicano C, Leodori G, Innocenti GP, Gigante A, Rosato E. Pellicano C, et al. Nutrients. 2019 Nov 2;11(11):2629. doi: 10.3390/nu11112629. Nutrients. 2019. PMID: 31684052 Free PMC article. Review. - An Increased Abundance of Clostridiaceae Characterizes Arthritis in Inflammatory Bowel Disease and Rheumatoid Arthritis: A Cross-sectional Study.
Muñiz Pedrogo DA, Chen J, Hillmann B, Jeraldo P, Al-Ghalith G, Taneja V, Davis JM, Knights D, Nelson H, Faubion WA, Raffals L, Kashyap PC. Muñiz Pedrogo DA, et al. Inflamm Bowel Dis. 2019 Apr 11;25(5):902-913. doi: 10.1093/ibd/izy318. Inflamm Bowel Dis. 2019. PMID: 30321331 Free PMC article. - Gut epithelial barrier dysfunction in lupus triggers a differential humoral response against gut commensals.
Botía-Sánchez M, Galicia G, Albaladejo-Marico L, Toro-Domínguez D, Morell M, Marcos-Fernández R, Margolles A, Alarcón-Riquelme ME. Botía-Sánchez M, et al. Front Immunol. 2023 May 24;14:1200769. doi: 10.3389/fimmu.2023.1200769. eCollection 2023. Front Immunol. 2023. PMID: 37346043 Free PMC article. - Regulation of inflammation by microbiota interactions with the host.
Blander JM, Longman RS, Iliev ID, Sonnenberg GF, Artis D. Blander JM, et al. Nat Immunol. 2017 Jul 19;18(8):851-860. doi: 10.1038/ni.3780. Nat Immunol. 2017. PMID: 28722709 Free PMC article. Review.
References
- Cerf-Bensussan N, Gaboriau-Routhiau V. The immune system and the gut microbiota: friends or foes? Nat Rev Immunol. 2010;10:735–744. - PubMed
- Crotty S. Follicular helper CD4 T cells (TFH) Annu Rev Immunol. 2011;29:621–663. - PubMed
Publication types
MeSH terms
Substances
Grants and funding
- R56 AI107117/AI/NIAID NIH HHS/United States
- P30 CA023074/CA/NCI NIH HHS/United States
- R01AI107117/AI/NIAID NIH HHS/United States
- R01 AI107117/AI/NIAID NIH HHS/United States
- R56AI107117/AI/NIAID NIH HHS/United States
LinkOut - more resources
Full Text Sources
Other Literature Sources
Medical
Molecular Biology Databases
Research Materials
Miscellaneous
