δ- and γ-tocopherols inhibit phIP/DSS-induced colon carcinogenesis by protection against early cellular and DNA damages - PubMed (original) (raw)
. 2017 Jan;56(1):172-183.
doi: 10.1002/mc.22481. Epub 2016 May 13.
Affiliations
- PMID: 27175800
- PMCID: PMC5647579
- DOI: 10.1002/mc.22481
δ- and γ-tocopherols inhibit phIP/DSS-induced colon carcinogenesis by protection against early cellular and DNA damages
Jayson X Chen et al. Mol Carcinog. 2017 Jan.
Abstract
Tocopherols, the major forms of vitamin E, are a family of fat-soluble compounds that exist in alpha (α-T), beta (β-T), gamma (γ-T), and delta (δ-T) variants. A cancer preventive effect of vitamin E is suggested by epidemiological studies. However, past animal studies and human intervention trials with α-T, the most active vitamin E form, have yielded disappointing results. A possible explanation is that the cancer preventive activity of α-T is weak compared to other tocopherol forms. In the present study, we investigated the effects of δ-T, γ-T, and α-T (0.2% in diet) in a novel colon cancer model induced by the meat-derived dietary carcinogen, 2-amino-1-methyl-6-phenylimidazo[4,5-b]pyridine (PhIP) and promoted by dextran sodium sulfate (DSS)-induced colitis in CYP1A-humanized (hCYP1A) mice. PhIP/DSS treatments induced multiple polypoid tumors, mainly tubular adenocarcinomas, in the middle to distal colon of the hCYP1A mice after 10 wk. Dietary supplementation with δ-T and γ-T significantly reduced colon tumor formation and suppressed markers of oxidative and nitrosative stress (i.e., 8-oxo-dG and nitrotyrosine) as well as pro-inflammatory mediators (i.e., NF-κB p65 and p-STAT3) in tumors and adjacent tissues. By administering δ-T at different time periods, we obtained results suggesting that the inhibitory effect of δ-T against colon carcinogenesis is mainly due to protection against early cellular and DNA damages caused by PhIP. α-T was found to be ineffective in inhibiting colon tumors and less effective in attenuating the molecular changes. Altogether, we demonstrated strong cancer preventive effects of δ-T and γ-T in a physiologically relevant model of human colon cancer. © 2016 Wiley Periodicals, Inc.
Keywords: DSS; PhIP; chemoprevention; colon carcinogenesis; tocopherols.
© 2016 Wiley Periodicals, Inc.
Conflict of interest statement
Conflicts of Interest:
No potential conflicts of interest were disclosed.
Figures
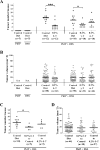
Figure 1. Inhibitory effect of different tocopherols on PhIP/DSS-induced colon tumorigenesis in male hCYP1A mice
A, dietary supplementation with δ-T and γ-T significantly reduced tumor multiplicity in male mice (Means ± SD for groups from left to right: 0, 0, 7.3±2.3, 2.7±2.2, 5.8±2.9, 3.2±1.6, and 4.6±2.5, respectively). B, dietary tocopherol supplementation did not alter tumor volumes (Means ± SD for groups from left to right: N/A, N/A, 18.7±17.6, 17.0±14.7, 19.5±13.7, 17.9±16.6, and 20.2±18.4, respectively). C, δ-T supplementation before (and not after) PhIP/DSS treatment significantly reduced tumor multiplicity in male mice (Means ± SD for groups from left to right: 6.4±2.2, 3.6 ±1.7, and 5.4±2.3, respectively). D, δ-T supplementation before or after PhIP/DSS treatment did not alter tumor volumes (Means ± SD for groups from left to right: 18.9±14.0, 16.8±12.0, and 16.7±13.9, respectively). Statistical analysis was done using two-tailed Student’s _t_-test or ANOVA-Dunnett (*******P<0.001, ******P<0.01, *****P<0.05).
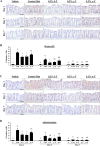
Figure 2. Dietary tocopherols suppress oxidative and nitrosative stress and pro-inflammatory mediators in the PhIP/DSS-induced colon tumors and adjacent tissues
A & C, representative micrographs showing that δ-T and γ-T supplementations were more effective than α-T in attenuating the levels of 8-oxo-dG and nitrotyrosine, respectively, in the colon tumors and adjacent tissues. B & D, quantitative analysis of 8-oxo-dG and nitrotyrosine immunostaining, respectively, in the colon tumors and adjacent tissues. E & G, representative micrographs showing that δ-T and γ-T supplementation, but not α-T, significantly attenuated the levels of NF-κB and p-STAT3, respectively, in the colon tumors and adjacent tissues. F & H, quantitative analysis of NF-κB and p-STAT3 immunostaining, respectively, in the colon tumors and adjacent tissues. Scale bar represents 50μm. Data presented as mean ± SD (n=5). Statistical analysis was done using two-tailed Student’s _t_-test or ANOVA-Dunnett (*******P<0.001, ******P<0.01, *****P<0.05).
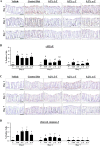
Figure 3. Dietary δ-T and γ-T reduce 8-oxo-dG and nitrotyrosine in colon mucosa of PhIP-treated mice at the early time points
A and C, representative micrographs of 8-oxo-dG and nitrotyrosine immunostaining, respectively, showing weak nuclear-positive staining in vehicle-treated mice on control diet, strong staining in PhIP-treated mice on control diet, and lowered levels of staining by δ-T or γ-T in PhIP-treated mice at 1, 3 and 7 days after PhIP administration. B and D, quantitative analysis of the 8-oxo-dG and nitrotyrosine immunostaining, respectively, of vehicle-treated mice and PhIP-treated mice on control (Ctrl), δ-T-, γ-T- and α-T-supplemented diets. Scale bar represents 50μm. Data presented as mean ± SD (n=4–5). Statistical analysis was done using ANOVA-Tukey’s test.
Figure 4. Dietary δ-T and γ-T reduce γH2AX and enhance cleaved caspase-3 in colon mucosa of PhIP-treated mice at the early time points
A, representative micrographs of γH2AX immunostaining showing weak nuclear-positive staining in vehicle-treated mice on control diet, strong staining in PhIP-treated mice on control diet, and lowered levels of staining in PhIP-treated mice on δ-T or γ-T diet at 1, 3 and 7 days after PhIP administration. B, quantitative analysis of γH2AX immunostaining of vehicle-treated mice (V) and PhIP-treated mice on control (Ctrl), δ-T-, γ-T- and α-T-supplemented diets. C, representative micrographs of cleaved caspase-3 immunostaining showing negligible staining in vehicle-treated mice on control diet, mild staining in PhIP-treated mice on control diet, and increased levels of staining in PhIP-treated mice on 0.2% δ-T or γ-T-supplemented diet at day 1 PhIP administration. D, quantitative analysis of cleaved caspase-3 immunostaining, respectively, of vehicle-treated mice (V) and PhIP-treated mice on control (Ctrl), δ-T-, γ-T- and α-T-supplemented diets. Scale bar represents 50μm. Data presented as mean ± SD (n=4–5). Statistical analysis was done using ANOVA-Tukey’s test.
Similar articles
- Dietary tocopherols inhibit PhIP-induced prostate carcinogenesis in CYP1A-humanized mice.
Chen JX, Li G, Wang H, Liu A, Lee MJ, Reuhl K, Suh N, Bosland MC, Yang CS. Chen JX, et al. Cancer Lett. 2016 Feb 1;371(1):71-8. doi: 10.1016/j.canlet.2015.11.010. Epub 2015 Nov 12. Cancer Lett. 2016. PMID: 26582657 Free PMC article. - Gamma-tocopherol attenuates moderate but not severe colitis and suppresses moderate colitis-promoted colon tumorigenesis in mice.
Jiang Q, Jiang Z, Hall YJ, Jang Y, Snyder PW, Bain C, Huang J, Jannasch A, Cooper B, Wang Y, Moreland M. Jiang Q, et al. Free Radic Biol Med. 2013 Dec;65:1069-1077. doi: 10.1016/j.freeradbiomed.2013.08.187. Epub 2013 Sep 4. Free Radic Biol Med. 2013. PMID: 24013093 Free PMC article. - From the Cover: PhIP/DSS-Induced Colon Carcinogenesis in CYP1A-Humanized Mice and the Possible Role of Lgr5+ Stem Cells.
Chen JX, Wang H, Liu A, Zhang L, Reuhl K, Yang CS. Chen JX, et al. Toxicol Sci. 2017 Jan;155(1):224-233. doi: 10.1093/toxsci/kfw190. Epub 2016 Sep 23. Toxicol Sci. 2017. PMID: 27664423 Free PMC article. - Inhibition of inflammation and carcinogenesis in the lung and colon by tocopherols.
Yang CS, Lu G, Ju J, Li GX. Yang CS, et al. Ann N Y Acad Sci. 2010 Aug;1203:29-34. doi: 10.1111/j.1749-6632.2010.05561.x. Ann N Y Acad Sci. 2010. PMID: 20716280 Free PMC article. Review. - Tocopherols and the treatment of colon cancer.
Stone WL, Krishnan K, Campbell SE, Qui M, Whaley SG, Yang H. Stone WL, et al. Ann N Y Acad Sci. 2004 Dec;1031:223-33. doi: 10.1196/annals.1331.022. Ann N Y Acad Sci. 2004. PMID: 15753148 Review.
Cited by
- Potential of Fiber and Probiotics to Fight Against the Effects of PhIP + DSS-Induced Carcinogenic Process of the Large Intestine.
Zapico A, Salazar N, Arboleya S, González Del Rey C, Diaz E, Alonso A, Gueimonde M, de Los Reyes-Gavilán CG, Gonzalez C, González S. Zapico A, et al. J Agric Food Chem. 2024 Nov 13;72(45):25161-25172. doi: 10.1021/acs.jafc.4c07366. Epub 2024 Oct 29. J Agric Food Chem. 2024. PMID: 39470985 Free PMC article. - Environmental cadmium exposure alters the internal microbiota and metabolome of Sprague-Dawley rats.
Liu S, Deng X, Li Z, Zhou W, Wang G, Zhan J, Hu B. Liu S, et al. Front Vet Sci. 2023 Jul 26;10:1219729. doi: 10.3389/fvets.2023.1219729. eCollection 2023. Front Vet Sci. 2023. PMID: 37565077 Free PMC article. - Experimental Murine Models for Colorectal Cancer Research.
Neto Í, Rocha J, Gaspar MM, Reis CP. Neto Í, et al. Cancers (Basel). 2023 Apr 30;15(9):2570. doi: 10.3390/cancers15092570. Cancers (Basel). 2023. PMID: 37174036 Free PMC article. Review. - δ-Tocotrienol is the Most Potent Vitamin E Form in Inhibiting Prostate Cancer Cell Growth and Inhibits Prostate Carcinogenesis in Ptenp-/- Mice.
Wang H, Yan W, Sun Y, Yang CS. Wang H, et al. Cancer Prev Res (Phila). 2022 Apr 1;15(4):233-245. doi: 10.1158/1940-6207.CAPR-21-0508. Cancer Prev Res (Phila). 2022. PMID: 35144931 Free PMC article. - Osteocytic Connexin Hemichannels Modulate Oxidative Bone Microenvironment and Breast Cancer Growth.
Tian Y, Riquelme MA, Tu C, Quan Y, Liu X, Sun LZ, Jiang JX. Tian Y, et al. Cancers (Basel). 2021 Dec 17;13(24):6343. doi: 10.3390/cancers13246343. Cancers (Basel). 2021. PMID: 34944962 Free PMC article.
References
- Siegel RL, Miller KD, Jemal A. Cancer statistics, 2015. CA Cancer J Clin. 2015;65(1):5–29. - PubMed
- Center MM, Jemal A, Smith RA, Ward E. Worldwide variations in colorectal cancer. CA Cancer J Clin. 2009;59(6):366–378. - PubMed
- Siegel R, Desantis C, Jemal A. Colorectal cancer statistics, 2014. CA Cancer J Clin. 2014;64(2):104–117. - PubMed
Publication types
MeSH terms
Substances
Grants and funding
- P30 ES005022/ES/NIEHS NIH HHS/United States
- R01 AT007036/AT/NCCIH NIH HHS/United States
- P30 CA072720/CA/NCI NIH HHS/United States
- T32 ES007148/ES/NIEHS NIH HHS/United States
- R01 CA133021/CA/NCI NIH HHS/United States
- F31 CA168333/CA/NCI NIH HHS/United States
LinkOut - more resources
Full Text Sources
Other Literature Sources
Miscellaneous


