TREM2 Haplodeficiency in Mice and Humans Impairs the Microglia Barrier Function Leading to Decreased Amyloid Compaction and Severe Axonal Dystrophy - PubMed (original) (raw)
TREM2 Haplodeficiency in Mice and Humans Impairs the Microglia Barrier Function Leading to Decreased Amyloid Compaction and Severe Axonal Dystrophy
Peng Yuan et al. Neuron. 2016.
Abstract
Haplodeficiency of the microglia gene TREM2 increases risk for late-onset Alzheimer's disease (AD) but the mechanisms remain uncertain. To investigate this, we used high-resolution confocal and super-resolution (STORM) microscopy in AD-like mice and human AD tissue. We found that microglia processes, rich in TREM2, tightly surround early amyloid fibrils and plaques promoting their compaction and insulation. In Trem2- or DAP12-haplodeficient mice and in humans with R47H TREM2 mutations, microglia had a markedly reduced ability to envelop amyloid deposits. This led to an increase in less compact plaques with longer and branched amyloid fibrils resulting in greater surface exposure to adjacent neurites. This was associated with more severe neuritic tau hyperphosphorylation and axonal dystrophy around amyloid deposits. Thus, TREM2 deficiency may disrupt the formation of a neuroprotective microglia barrier that regulates amyloid compaction and insulation. Pharmacological modulation of this barrier could be a novel therapeutic strategy for AD.
Copyright © 2016 Elsevier Inc. All rights reserved.
Conflict of interest statement
Conflict of Interest
The authors claim no conflict of interest
Figures
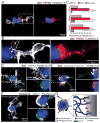
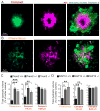
Figure 1. Trem2-mediated signaling is activated within microglia processes directly contacting amyloid plaques
(A) Confocal images showing the subcellular localization of immunostained Trem2 (red) within Iba1-positive microglia (white) clustered around an amyloid plaque (blue) in a 5XFAD mouse. (B) Zoomed images of Trem2 in plaque-associated microglia processes from the dashed box in A. Microglia processes were divided into 3 subcellular compartments: 1) soma (pink arrow), 2) barrier (processes contacting plaque, red arrow) and 3) non-barrier (processes not engaged with plaque, gray arrow). (C) Quantification of Trem2 fluorescence intensity in microglia associated with plaques in AD mouse models: 5XFAD, CRND8 and APPPS1-21. N=30 microglia from each model. Student t-tests were used for statistical comparisons, ***: p<0.001; a.u.: arbitrary unit. (D and E) Confocal images showing elevated levels of immunostained-DAP12 (green) and phospho-tyrosine (magenta) at the microglia-plaque interface (white). Right panels show zoomed split channels from the dashed-box. (F) Confocal images of DAP12 (green) and microglia (white) in human sporadic AD postmortem brain showing strong polarization to processes contacting plaques. (G) Diagram of specialized microglial processes wrapping around amyloid plaque microregions, with enriched TREM2 and downstream signaling proteins. All analyses were performed in mouse somatosensory cortex human middle frontal gyrus.
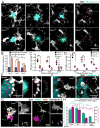
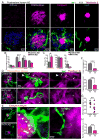
Figure 2. Defective microglia barrier but normal Aβ phagocytosis in Trem2 or DAP12 haplodeficiency
(A) Confocal images of Iba1-immunostained microglia (white) around thioflavin S+ amyloid plaques (cyan) in 5XFAD mice with different Trem2 genotypes or in APPPS1-21 mice with different DAP12 genotypes. Cyan asterisks indicate locations of the plaque. Red arrows point to the polarized microglia processes. (B) Quantification of microglia process polarization away from or near plaques in 5XFAD mice with different Trem2 genotypes. N=3 mice for each group; 540 microglia analyzed. (C and D) Quantification of microglia plaque coverage (“barrier”) around plaques in 5xFAD mice with different Trem2 genotypes and APPPS1-21 mice with different DAP12 genotypes. N=6 mice for each group, 2887 plaques for 5XFAD:Trem2 and 598 plaques for APPPS1-21:DAP12. (E) Microglia barrier (white) interdigitates with the surface of an amyloid plaque (cyan) in wildtype 5XFAD mice. Dotted cyan and red lines indicate thresholded borders of plaque and microglia, respectively. (F) Dysmorphic microglia processes (white) with looping structures (red arrows) in mice with Trem2 or DAP12 deficiency. (G) Confocal images of Aβ immunolabeling (4G8) within microglial phagosomes (CD68+; green) in Trem2+/+ (left panels) and Trem2−/− (right panels) from 5xFAD brain slices. Yellow arrows indicate colocalized 4G8+ Aβ (magenta) and CD68+ vesicles (green). (H) Quantification of CD68+ vesicle area and 4G8 fluorescence per microglia. N=3 mice for each group and 321 cells. Student t-tests were used for all statistical comparisons, **: p<0.01, ***: p<0.001; n.s.: p>0.05; a.u.: arbitrary unit. All analyses were performed with mouse somatosensory cortex.
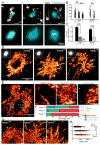
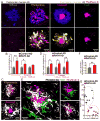
Figure 3. Super-resolution STORM imaging reveals a marked reduction in plaque compaction in Trem2 haplodeficiency
(A) Confocal images of thioflavin S-labeled amyloid plaques in Trem2+/+ and Trem2−/− 5XFAD mice and DAP12−/− APPPS1-21 mice. (B and C) Quantification of mean thioflavin S fluorescence intensity and circularity (roundness) in plaques from 5XFAD mice with different Trem2 genotypes and APPPS1-21 mice with different DAP12 genotypes. N=3 mice for each group, 747 plaques for 5XFAD:Trem2 and 198 plaques for APPPS1-21:DAP12. (D and E) Immunolabeled Aβ plaque fibrils reconstructed by super-resolution STORM imaging. Images were pseudo-colored according to the reconstructed intensities. Insets in D show the same plaque imaged with wild-field illumination. Dashed line and asterisk in E indicate locations of the compact plaque core which is not labeled due to poor antibody penetration in 5XFAD Trem2+/+ mice (Figure S6). Three insets in E show high zoom examples of different types of Aβ fibril organization located in plaque regions with different degree of compaction. (F) Quantification of the proportion of diffuse, mesh-like and compact regions in amyloid plaques from 5XFAD mice with different Trem2 copy numbers. N=8 plaques from each genotype. Multiple t-tests were used to compare different regions between genotypes. Multiple comparisons were corrected with Holm-Sidak method. *: p<0.0005, **: p<0.0001. (G) Example images of fibrils within the diffuse plaque region extending radially from the plaque center in 5XFAD mice with different Trem2 genotypes. Dashed lines and asterisks indicate locations of the unlabeled compact plaque core. (H) Quantification of lengths of the diffuse fibrils in plaques of 5XFAD mice with different Trem2 copy numbers. Scatter plot shows individual data point. Red bars indicate group averages by genotypes. Except for comparison in F, Student t-tests were used for all statistical comparisons, **: p<0.01, ***: p<0.001; a.u.: arbitrary unit.
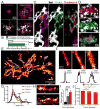
Figure 4. Trem2 deficiency impairs early-stage amyloid fibril envelopment by microglia leading to increased fibril branching
(A) Confocal images of filamentous and compact plaques using thioflavin S labeling (magenta) in 5XFAD mice showing close interaction with surrounding microglia (anti-Iba1 immunostaining, white). (B) Quantification of Trem2 fluorescence intensity in microglia processes that do and do not contact with amyloid fibrils. N=30 plaques, student t-tests were used for statistical comparisons. (C and D) Zoomed images from insets in A, showing Trem2-enriched microglia processes wrapping around individual amyloid fibrils in a filamentous plaque. (E and F) Examples of Aβ fibril nanostructures revealed by STORM imaging. Images were pseudo-colored according to the reconstructed intensities. Three insets in E show examples of individual fibrils. By fitting the cross-section fluorescence intensity to a Gaussian distribution, the widths of the fibril were derived as 2.35 times the standard deviation of the fitted curve. (G) Distribution of the Aβ fibril widths in plaques of 5XFAD mice with different copy numbers of the Trem2 gene. N=8 plaques from each genotype, more than 200 fibrils were measured per plaque. (H) Examples of individual Aβ fibril nanostructures branching orthogonally from the primary fiber bundle revealed by STORM imaging (Yellow arrows). (I) Quantification of the frequency of branched Aβ nanostructures per 500nm in 5XFAD mice with different copy numbers of the Trem2 gene. (J) Quantification of compact (thioflavin S+ core with 4G8+ halo, red) and filamentous (diffuse filamentous thioflavin S labeling with 4G8+ halo, orange) plaque densities in 5XFAD mice with different copy numbers of the Trem2 gene. Blue lines refer to statistical analyses for total plaques. N=6 mice for each group; total 2887 plaques analyzed. Student t-tests were used for all statistical comparisons, *: p<0.05, **: p<0.01, ***: p<0.001; a.u.: arbitrary unit; n.s.: p>0.05.
Figure 5. Trem2 or DAP12 deficiency leads to more severe plaque-associated axonal dystrophy
(A and B) Visualization of Lamp1-immunolabeled axonal dystrophy (green) around compact (A) and filamentous (B) plaques in AD-like mouse brains. (C–D) Quantification of total dystrophy volume in cortex of AD-like mice with different Trem2 or DAP12 genotypes. N=6 mice for each group of 5XFAD:Trem2 mice; total 2887 plaques analyzed. N=3 mice for each group of APPPS1-21:DAP12 mice; total 1076 plaques analyzed. Student t-tests were used for all statistical comparisons, *: p<0.05, **: p<0.01, ***: p<0.001; a.u.: arbitrary unit. All analyses were performed with somatosensory cortex in mice.
Figure 6. TREM2 R47H mutations in human AD lead to abnormal microglia coverage around filamentous and compact plaques
(A) Confocal images of thioflavin S-stained amyloid deposits (magenta), 4G8-labeled Aβ (blue) and Iba1-labeled surrounding microglia (green) in human postmortem AD brains, showing four different subtypes of plaques. (B) Quantification of the number of microglia within a 25 μm radius from the plaque perimeter for each plaque subtype in AD brains with and without TREM2 R47H mutation. Total 1966 plaques analyzed. (C) Quantification of the proportion of plaque subtypes that demonstrated robust microglia interactions (Diffuse plaques do not attract microglia processes and were excluded in this analysis) in AD brains with and without TREM2 R47H mutation. Total 1474 plaques analyzed. (D and E) Confocal images of microglia coverage of individual amyloid filaments (D) and the surface of compact plaques (E). Right panels show zoomed images from dashed boxes on the left panels. Arrows indicate microglia processes closely wrapping around an amyloid fibril with a “capping” structure (arrow head). Asterisk shows a dysmorphic loop structure formed by microglia in AD brains with TREM2 R47H mutation. In E, white arrow heads outline the robust microglia coverage of the plaque surface. Arrow points to the gap between a dysmorphic microglia process and the plaque border in R47H mutant. (F) Quantification of the amyloid filaments wrapped by microglia and the capping events in individual filamentous plaques. Total 226 plaques analyzed. (G and H) Quantification of compact plaque surface coverage and barrier robustness (see Figure S7) by microglia in AD with and without R47H mutations. Total 1157 plaques analyzed. For all quantifications, N=9 control AD patients and N=10 R47H AD patients. Student t-tests were used for all statistical comparisons, *: p<0.05, **: p<0.01, ***: p<0.001; a.u.: arbitrary unit. All analyses were performed on plaques from middle frontal gyrus.
Figure 7. R47H mutation in humans is associated with severe neuritic tau hyperphosphorylation and axonal dystrophy
(A) 4 subtypes of plaques in human brain. Diffuse plaques (anti Aβ+, thioflavin S−); Filamentous plaques (anti Aβ+, filamentous thioflavin S+); Compact plaques (anti Aβ+, thioflavin S+ compact core); Inert plaques (anti Aβ−, thioflavin S+ compact core). Lower panel: images of dystrophic neurites (labeled by anti-APP immunolabeling, yellow) around different subtypes of amyloid plaques in postmortem human brains. Notice the marked degree of dystrophy within the otherwise inconspicuous filamentous plaques. (B) Quantification of APP+ dystrophic neurites around individual plaques in AD patients with and without R47H mutations. Total 1406 plaques analyzed. (C) Confocal images of neurites with hyper-phosphorylated tau (white) around filamentous and compact plaques (magenta). Notice the marked degree of hyperphosphorylation in filamentous plaques. (D) Quantification of area neurites with phosphorylated tau around individual plaques in AD patients with and without R47H mutations. Total 1369 plaques analyzed. (E) Microglia (green) in close contact with a plaque (magenta) but anti-colocalized with hyper-phosphorylated dystrophic neurites (white). (F) Quantification of the degree of neuritic tau hyper-phosphorylation as a ratio between areas covered and not covered by microglia processes. Total 468 plaques analyzed. (G) Quantification of the degree of microglia barrier (radial coverage multiply robustness; see methods) as a function of the degree of phosphorylated tau (normalized for plaque size). Total 1008 plaques analyzed. For all quantifications, N=9 control humans and N=10 R47H humans. Student t-tests was used for all statistical comparisons, *: p<0.05, **: p<0.01; a.u.: arbitrary unit. All analyses were performed on plaques from middle frontal gyrus.
Similar articles
- Trem2 Deletion Reduces Late-Stage Amyloid Plaque Accumulation, Elevates the Aβ42:Aβ40 Ratio, and Exacerbates Axonal Dystrophy and Dendritic Spine Loss in the PS2APP Alzheimer's Mouse Model.
Meilandt WJ, Ngu H, Gogineni A, Lalehzadeh G, Lee SH, Srinivasan K, Imperio J, Wu T, Weber M, Kruse AJ, Stark KL, Chan P, Kwong M, Modrusan Z, Friedman BA, Elstrott J, Foreman O, Easton A, Sheng M, Hansen DV. Meilandt WJ, et al. J Neurosci. 2020 Feb 26;40(9):1956-1974. doi: 10.1523/JNEUROSCI.1871-19.2019. Epub 2020 Jan 24. J Neurosci. 2020. PMID: 31980586 Free PMC article. - TREM2-mediated early microglial response limits diffusion and toxicity of amyloid plaques.
Wang Y, Ulland TK, Ulrich JD, Song W, Tzaferis JA, Hole JT, Yuan P, Mahan TE, Shi Y, Gilfillan S, Cella M, Grutzendler J, DeMattos RB, Cirrito JR, Holtzman DM, Colonna M. Wang Y, et al. J Exp Med. 2016 May 2;213(5):667-75. doi: 10.1084/jem.20151948. Epub 2016 Apr 18. J Exp Med. 2016. PMID: 27091843 Free PMC article. - Microglia-Mediated Neuroprotection, TREM2, and Alzheimer's Disease: Evidence From Optical Imaging.
Condello C, Yuan P, Grutzendler J. Condello C, et al. Biol Psychiatry. 2018 Feb 15;83(4):377-387. doi: 10.1016/j.biopsych.2017.10.007. Epub 2017 Oct 14. Biol Psychiatry. 2018. PMID: 29169609 Free PMC article. Review. - Soluble TREM2 inhibits secondary nucleation of Aβ fibrillization and enhances cellular uptake of fibrillar Aβ.
Belsare KD, Wu H, Mondal D, Bond A, Castillo E, Jin J, Jo H, Roush AE, Pilla KB, Sali A, Condello C, DeGrado WF. Belsare KD, et al. Proc Natl Acad Sci U S A. 2022 Feb 1;119(5):e2114486119. doi: 10.1073/pnas.2114486119. Proc Natl Acad Sci U S A. 2022. PMID: 35082148 Free PMC article. - TREM2 Function in Alzheimer's Disease and Neurodegeneration.
Ulrich JD, Holtzman DM. Ulrich JD, et al. ACS Chem Neurosci. 2016 Apr 20;7(4):420-7. doi: 10.1021/acschemneuro.5b00313. Epub 2016 Feb 19. ACS Chem Neurosci. 2016. PMID: 26854967 Review.
Cited by
- Microglia Biomarkers in Alzheimer's Disease.
Zhang PF, Hu H, Tan L, Yu JT. Zhang PF, et al. Mol Neurobiol. 2021 Jul;58(7):3388-3404. doi: 10.1007/s12035-021-02348-3. Epub 2021 Mar 12. Mol Neurobiol. 2021. PMID: 33713018 Review. - Tau-Mediated Dysregulation of Neuroplasticity and Glial Plasticity.
Koller EJ, Chakrabarty P. Koller EJ, et al. Front Mol Neurosci. 2020 Aug 21;13:151. doi: 10.3389/fnmol.2020.00151. eCollection 2020. Front Mol Neurosci. 2020. PMID: 32973446 Free PMC article. - MEK1/2 activity modulates TREM2 cell surface recruitment.
Schapansky J, Grinberg YY, Osiecki DM, Freeman EA, Walker SG, Karran E, Gopalakrishnan SM, Talanian RV. Schapansky J, et al. J Biol Chem. 2021 Jan-Jun;296:100218. doi: 10.1074/jbc.RA120.014352. Epub 2020 Dec 25. J Biol Chem. 2021. PMID: 33839686 Free PMC article. - Therapeutic targeting of immunometabolism in Alzheimer's disease reveals a critical reliance on Hexokinase 2 dosage on microglial activation and disease progression.
Codocedo JF, Mera-Reina C, Lin PB, Puntambekar SS, Casali BT, Jury N, Martinez P, Lasagna-Reeves CA, Landreth GE. Codocedo JF, et al. bioRxiv [Preprint]. 2023 Nov 15:2023.11.11.566270. doi: 10.1101/2023.11.11.566270. bioRxiv. 2023. PMID: 38014106 Free PMC article. Updated. Preprint. - β-Hydroxybutyrate inhibits inflammasome activation to attenuate Alzheimer's disease pathology.
Shippy DC, Wilhelm C, Viharkumar PA, Raife TJ, Ulland TK. Shippy DC, et al. J Neuroinflammation. 2020 Sep 21;17(1):280. doi: 10.1186/s12974-020-01948-5. J Neuroinflammation. 2020. PMID: 32958021 Free PMC article.
References
- Bakker AB, Hoek RM, Cerwenka A, Blom B, Lucian L, McNeil T, Murray R, Phillips LH, Sedgwick JD, Lanier LL. DAP12-deficient mice fail to develop autoimmunity due to impaired antigen priming. Immunity. 2000;13:345–53. - PubMed
Publication types
MeSH terms
Substances
Grants and funding
- R21 AG048181/AG/NIA NIH HHS/United States
- P50 AG005136/AG/NIA NIH HHS/United States
- R01 NS089734/NS/NINDS NIH HHS/United States
- U24 NS072026/NS/NINDS NIH HHS/United States
- R01 NS089662/NS/NINDS NIH HHS/United States
- P30 AG019610/AG/NIA NIH HHS/United States
- R01 HL106815/HL/NHLBI NIH HHS/United States
- I01 CX001006/CX/CSRD VA/United States
LinkOut - more resources
Full Text Sources
Other Literature Sources
Molecular Biology Databases
