Gut environment-induced intraepithelial autoreactive CD4(+) T cells suppress central nervous system autoimmunity via LAG-3 - PubMed (original) (raw)
Gut environment-induced intraepithelial autoreactive CD4(+) T cells suppress central nervous system autoimmunity via LAG-3
Atsushi Kadowaki et al. Nat Commun. 2016.
Abstract
The gut environment has been found to significantly influence autoimmune diseases such as multiple sclerosis; however, immune cell mechanisms are unclear. Here we show that the gut epithelium of myelin oligodendrocyte glycoprotein(35-55)-specific T-cell receptor transgenic mice contains environmental stimuli-induced intraepithelial lymphocytes (IELs) that inhibit experimental autoimmune encephalomyelitis on transfer. These cells express surface markers phenotypical of 'induced' IELs, have a TH17-like profile and infiltrate the central nervous system (CNS). They constitutively express Ctla4 and Tgfb1 and markedly upregulate Lag3 expression in the CNS, thereby inhibiting inflammation. We also demonstrate the suppressive capability of CD4(+) IELs with alternative antigen specificities, their proliferation in response to gut-derived antigens and contribution of the microbiota and dietary aryl hydrocarbon receptor ligands to their induction. Thus, the gut environment favours the generation of autoreactive CD4(+) T cells with unique regulatory functions, potentially important for preventing CNS autoimmunity.
Figures
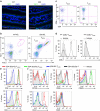
Figure 1. IELs in 2D2 mice.
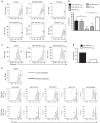
(a) Immunohistochemistry of the small intestines of WT and 2D2 mice. Cryosections were stained with anti-Vβ11 Ab (green) and nuclear DNA-staining DAPI (blue). Original magnification: × 600. Scale bars, 50 μm. Images shown are representative of two experiments. (b) Expression of Vα3.2+Vβ11+ TCR (2D2-TCR) in TCRβ+ IELs of WT or 2D2 mice was assessed by flow cytometry. 2D2-mouse IEL T cells with high expression of 2D2-TCR (2D2-IEL-THIGH) are indicated as THIGH, and those with low expression of 2D2-TCR (2D2-IEL-TLOW) are labelled as TLOW. (c) Expression of co-receptors (CD4 and CD8α) on 2D2-IEL T cells. (d) Expression of CD8β on CD8α+ T cells among 2D2-IEL-THIGH and -TLOW cells. (e) Expression of CD2 and CD5 on 2D2-IEL cells and 2D2-spleen CD4+ T cells (CD4+2D2-Sp-T). 2D2-IEL populations were analysed and grouped as CD4+2D2-IEL-THIGH, CD4−-2D2-IEL-THIGH and 2D2-IEL-TLOW cells. (f) Expression of CD103 and T-cell activation markers on 2D2-IEL cells and 2D2-spleen CD4+ T cells. (b–f) Data are representative of more than three experiments. DAPI, 4,6-diamidino-2-phenylindole.
Figure 2. Functional characterization of 2D2-IEL populations.
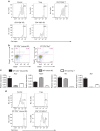
(a) Sorted populations of 2D2-IEL (CD4+ and CD4−, 2D2-IEL-THIGH and 2D2-IEL-TLOW) or spleen CD4+ T (CD4+2D2-Sp-T) cells from 2D2 mice were stimulated with anti-CD3 and anti-CD28 mAb for 3 days in vitro. Cell proliferation was measured by incorporation of [3H] thymidine (c.p.m.) (data represent mean and s.e.m. of triplicates). (b) Supernatants from cultures used in a were analysed for cytokine production (mean±s.e.m. of triplicates). Representative data of two experiments are shown in a and b. (c) Gene expression of the indicated transcription factors. mRNA obtained from 2D2-IEL (CD4+- or CD4−-THIGH and -TLOW) or 2D2-spleen-CD4+ T cells was analysed by quantitative RT–PCR (_n_=3) (mean and s.e.m.). The expression levels were normalized to that of Gapdh (glyceraldehyde phosphate dehydrogenase). (d) Intracellular Foxp3 staining of 2D2-IEL and 2D2-spleen CD4+ T cells. (e) Intracellular staining of IL-17A and IL-10 in CD4+2D2-IEL-THIGH cells and 2D2-spleen-CD4+ T cells. Cells were stimulated with PMA (500 ng ml−1) plus ionomycin (500 ng ml−1) (d,e). Data are representative of two experiments. (f) Expression of chemokine receptors analysed by quantitative RT–PCR as in c (mean and s.e.m.). c.p.m., counts per minute; PMA, phorbol 12-myristate 13-acetate; RT–PCR, reverse transcription PCR.
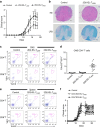
Figure 3. Suppression of EAE by adoptive transfer of 2D2-IEL-THIGH cells.
(a) In total, 5.0 × 10⁵ WT spleen cells (control) and 2D2-IEL-THIGH or -TLOW cells were transferred intraperitoneally (day −1), and EAE was induced on the following day (day 0). Clinical scores of EAE were assessed (mean and s.e.m.). (b) Representative H&E and LFB staining of spinal cords from control recipients (_n_=4) or 2D2-IEL-THIGH cell recipients (_n_=3) 3 weeks after EAE induction. Scale bars, 100 μm. (c) Representative flow cytometry analysis of 2D2-TCR (Vα3.2+Vβ11+) expression in CD4+ or CD8+ T cells obtained from the CNS of EAE mice after peak disease. (d) The total proportion (%) of 2D2-TCR+ cells among the CNS-infiltrating CD4+ T cells obtained from (c). Plots represent data from individual animals (mean and s.e.m.). Data in a,c and d were pooled from two experiments where 13 control, 9 2D2-IEL-TLOW and 11 2D2-IEL-THIGH mice were induced for EAE. (e) When CNS cells were separated for analysis (d), spleen cells from the mice were also obtained, and proportions of Vα3.2+Vβ11+ 2D2 T cells in CD4+ or CD8+ T cells among these cells were analysed by FACS. Spleen cells from four mice were pooled from each group. Data are representative of two experiments. (f) In total, 2.0 × 10⁵ WT spleen cells (control) or CD4− or CD4+2D2-IEL-THIGH cells were adoptively transferred intravenously (day −1) and EAE induced on the following day (day 0). Clinical scores of mice receiving control (_n_=13), CD4−2D2-IEL-THIGH (_n_=13) and CD4+2D2-IEL-THIGH (_n_=10) cells were pooled from two experiments (mean and s.e.m.). *P<0.05, **P<0.01 by two-way analysis of variance with Bonferroni's post-test. FACS, fluorescence-activated cell sorting; H&E, haematoxylin and eosin; LFB, Luxol fast blue.
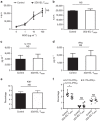
Figure 4. The effect of 2D2-IEL-THIGH cells on the peripheral activation of CD4+ T cells.
(a) In total, 5.0 × 10⁵ 2D2-IEL-THIGH cells or WT spleen cells were adoptively transferred intraperitoneally to WT recipients (day −1) that were immunized with MOG(35-55) on the following day (day 0) without pertussis toxin (_n_=4 per group). On day 10, inguinal lymph node cells were obtained and cultured with the indicated doses of MOG(35-55) or anti-CD3 mAb. (b) Cells were treated with [3H]thymidine for the proliferation assay (c.p.m.). (c,d) In parallel with experiment a, supernatants of cells stimulated with 100 μg ml−1 of MOG(35-55) were collected and analysed for cytokine production. Data are representative of three experiments (mean and s.e.m.). (e,f) 2D2-IEL-THIGH cells or WT-spleen cells were adoptively transferred, and recipient mice immunized with MOG(35-55) as in a. On day 11, inguinal lymph node cells were collected and stained for intracellular Ki67 (e) or stimulated with PMA (50 ng ml−1) plus ionomycin (500 ng ml−1) and stained for IL-17A and IFNγ (f). (e,f) Percentages in CD4+ T cells are displayed (mean and s.e.m.). Plots in (f) represent data from individual animals. _n_=8 per group, pooled from two experiments. (a,f) NS (not significant) or *P<0.05 by two-way analysis of variance with Bonferroni's post-test. (b–e) NS (not significant) by unpaired _t_-test. c.p.m., counts per minute; PMA, phorbol 12-myristate 13-acetate.
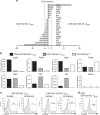
Figure 5. Comparison of gut-resident and CNS-infiltrating CD4+2D2-IEL-THIGH cells.
(a) CD4+2D2-IEL-THIGH cells were sorted from the IELs of 2D2 mice. 2D2-IEL-THIGH cells (5.0 × 10⁵) were adoptively transferred to WT mice (day −1) and EAE was induced (day 0). Eighteen or twenty days later, CD4+2D2-TCR+ cells were recovered from the CNS of WT recipients (CNS CD4+2D2-IEL-THIGH). Spleen CD4+2D2-T cells were also sorted for comparison (Sp-T). mRNA was obtained from each sample, and quantitative RT–PCR of each indicated gene was performed. Gene expression levels were normalized to that of Gapdh. Fold-induction of the indicated gene expression in CD4+2D2-IEL-THIGH and CNS-CD4+2D2-IEL-THIGH cells was compared. (b) The expression levels of selected genes in CD4+2D2-IEL-THIGH, CNS-CD4+2D2-IEL-THIGH and SpCD4T cells were compared. Each sample was pooled from four mice. The mean expression of duplicate samples was calculated. (c) In total, 2.0 × 10⁶ 2D2-IEL-THIGH cells were transferred (day −1) to WT recipients and EAE was induced (day 0). Nineteen days later, the surface and intracellular expression of LAG-3 in CD4+2D2-IEL-THIGH (left) or the CNS-CD4+2D2-IEL-THIGH (right) cells were assessed. (d) In total, 7.5 × 10⁵ 2D2-IEL-THIGH cells were transferred to WT recipients (day −1) and EAE was induced (day 0). Eighteen days later, Foxp3 expression in CNS-CD4+2D2-IEL-THIGH cells was analysed. Data are representative of three (c) or two experiments (d). RT–PCR, reverse transcription PCR.
Figure 6. Suppressive effect of CD4+2D2-IEL-THIGH cells on T-cell proliferation in vitro.
(a) Sorted spleen CD4+CD25− T cells from 2D2 mice were labelled with CellTrace and were used as responder cells. The indicated suppressor cells were sorted and co-cultured. Suppressor cells were not added to control cultures. CD4+Vα3.2+Vβ11+ cells from MLN of 2D2 mice (2D2-MLN), CD4+CD25+ T cells from WT spleen cells (Treg) and CD4+ or CD4− 2D2-IEL-THIGH and TLOW cells sorted from IEL populations of 2D2 mice were used as suppressor cells. Cells were stimulated with APCs (CD3− WT spleen cells) plus anti-CD3 mAb. (b) Per cent suppression was calculated from three to four samples for each condition from three experiments including a. Mean and s.e.m.; *P<0.05, **P<0.01 by unpaired _t_-test. (c) The responder cells used in a were co-cultured with the indicated suppressor cells and MOG(35-55)-pulsed APCs and average per cent suppression was calculated in d. (e) Blocking mAb or isotype-matched control antibodies were added to the cell cultures. After 4 days of culture in 96-well U-bottom (a–d) or V-bottom (e) plates, intensities of CellTrace in 7AAD−CD4+ cells were measured by FACS. Bars represent undivided CellTrace-labelled responder cells. (c,e) Data are representative of two experiments. FACS, fluorescence-activated cell sorting.
Figure 7. The role of LAG-3 in 2D2-IEL-THIGH cell-mediated suppression of EAE.
(a) In total, 1.0 × 10⁶ WT spleen cells (control) or 2D2-IEL-THIGH cells (2D2-IEL-THIGH) were transferred to WT recipients (_n_=5 per group) one day before EAE induction (day 0). Anti-LAG-3 mAb or isotype-matched immunoglobulin was administrated. Clinical scores of EAE were evaluated (mean and s.e.m). *P<0.05, **P<0.01 by two-way analysis of variance (ANOVA) with Bonferroni's post-test. (b) Mononuclear cells infiltrating the CNS of recipient mice were recovered on day 33, and cell numbers were counted. Individual plots represent cell numbers from each animal (mean and s.e.m.). *P<0.05 or NS (not significant) by one-way ANOVA with Bonferroni's post-test. Data are representative of two experiments.
Figure 8. Suppressive capabilities of CD4+ IEL from KBx/N mice and WT mice.
(a) IELs from KBx/N mice were used. Responder CD4+CD25− T cells (labelled with CellTrace) and CD3− cells were sorted from the spleens of KBx/N transgene-negative littermates. CD4+CD25− T cells sorted from the spleens of transgene-negative littermates were used as responder cells. CD4+CD25+ T (Treg) cells sorted from the spleen cells of transgene-negative littermates were used as suppressor cells as a positive control. CD4+ and CD4− Vβ6+ T cells were sorted from KBx/N-IELs and used as suppressor cells. Control data were obtained without adding suppressor cells. Data are representative of three experiments. (b) WT-CD4+CD8α− induced IEL and WT-CD4+Sp-T cells were analysed for the expression of surface CD25 and intracellular Foxp3. Data represent two experiments. (c) mRNA expression in WT-CD4+ induced IELs (CD2+CD5+CD4+CD8α−TCRβ+IEL), WT natural IELs (CD2−CD5−CD4−TCRβ+IEL), and WT-CD4+Sp-T cells was analysed by quantitative RT–PCR (_n_=4) mean and s.e.m. (d) Suppressor assay using IELs from WT mice. Responder T cells, CD3− spleen cells, CD4+ induced IELs and CD4+CD25+ T cells (Treg) in the spleen and MLN-CD4+ T cells were sorted from WT mice. After 4 days of culture in 96-well V-bottom (a) or U-bottom (d) plates, intensities of CellTrace in 7-AAD−CD4+ cells were analysed by FACS. Bars represent undivided CellTrace-labelled responder T cells. Data representative of three experiments are shown. FACS, fluorescence-activated cell sorting; RT–PCR, reverse transcription PCR.
Figure 9. The proliferation of CD4+2D2-IEL-THIGH cells in non-immunized mice.
In total, 1.5 × 10⁵ 2D2-IEL-THIGH cells (CD45.2+) were labelled with CellTrace and transferred intravenously to CD45.1+WT mice. Five days later, cervical lymph node (LN) cells, inguinal LN cells, MLN cells, spleen cells and small intestinal IELs and LPL were collected. 7AAD−CD45.2+CD45.1−CD4+ cells were gated and CellTrace intensities were measured by FACS. Samples are pooled from two mice. Data represent three samples from two experiments. FACS, fluorescence-activated cell sorting.
Figure 10. The contribution of gut environmental stimuli to the induction of CD4+ IELs.
(a) Six-week-old 2D2 mice were orally treated with distilled water (control) or a mixture of antibiotics (Abx) (_n_=7 per group). Two weeks later, IELs were collected and analysed for absolute numbers of 2D2-IEL cells. Each dot represents an individual mouse. Data are pooled from two experiments (mean and s.e.m.). (b) The microarray gene expression analysis showed a pattern of higher expression in WT-CD4+CD8α− CD25−IEL (WT-Gut) and CD4+CD25−2D2-IEL-THIGH cells (2D2-Gut) compared with WT-CD4+CD25− spleen-T cells (WT-Sp) and CD4+CD25−2D2-spleen-T cells (2D2-Sp). The log2 expression values of AHR signalling pathway-related genes are shown in the heatmap. Each column represents a single sample (_n_=3 per group) and each row represents a single gene (38 genes). The result of the ingenuity pathway analysis is shown below (see Method). (c) A standard diet (control), synthetic purified diet (AIN76A) or synthetic diet supplemented with I3C (AIN76A+I3C) was fed to WT mice. After 1 month, IELs were obtained and the absolute numbers of CD4+CD8α−TCRβ+ IELs were analysed (_n_=10 per group). Each dot represents an individual animal. Pooled data from two experiments are shown (mean and s.e.m.). (a) *P<0.05 by unpaired _t_-test. (c) *P<0.05 by one-way analysis of variance with Bonferroni's post-test.
Similar articles
- ERβ in CD4+ T Cells Is Crucial for Ligand-Mediated Suppression of Central Nervous System Autoimmunity.
Aggelakopoulou M, Kourepini E, Paschalidis N, Panoutsakopoulou V. Aggelakopoulou M, et al. J Immunol. 2016 Jun 15;196(12):4947-56. doi: 10.4049/jimmunol.1600246. Epub 2016 May 13. J Immunol. 2016. PMID: 27183630 - Disrupting Myelin-Specific Th17 Cell Gut Homing Confers Protection in an Adoptive Transfer Experimental Autoimmune Encephalomyelitis.
Duc D, Vigne S, Bernier-Latmani J, Yersin Y, Ruiz F, Gaïa N, Leo S, Lazarevic V, Schrenzel J, Petrova TV, Pot C. Duc D, et al. Cell Rep. 2019 Oct 8;29(2):378-390.e4. doi: 10.1016/j.celrep.2019.09.002. Cell Rep. 2019. PMID: 31597098 - Regulation of effector function of CNS autoreactive CD4 T cells through inhibitory receptors and IL-7Rα.
Nuro-Gyina PK, Rieser EL, Granitto MC, Pei W, Liu Y, Lee PW, Aqel S, Zhang J, Lovett-Racke AE, Racke MK, Yang Y. Nuro-Gyina PK, et al. J Neuroinflammation. 2016 Dec 3;13(1):302. doi: 10.1186/s12974-016-0768-3. J Neuroinflammation. 2016. PMID: 27912762 Free PMC article. - Using EAE to better understand principles of immune function and autoimmune pathology.
Rangachari M, Kuchroo VK. Rangachari M, et al. J Autoimmun. 2013 Sep;45:31-9. doi: 10.1016/j.jaut.2013.06.008. Epub 2013 Jul 9. J Autoimmun. 2013. PMID: 23849779 Free PMC article. Review. - Role of Th17 cells in the pathogenesis of CNS inflammatory demyelination.
Rostami A, Ciric B. Rostami A, et al. J Neurol Sci. 2013 Oct 15;333(1-2):76-87. doi: 10.1016/j.jns.2013.03.002. Epub 2013 Apr 8. J Neurol Sci. 2013. PMID: 23578791 Free PMC article. Review.
Cited by
- The Role of the Intestinal Microbiome in Multiple Sclerosis-Lessons to Be Learned from Hippocrates.
El-Sayed MM, Mohak S, Gala D, Fabian R, Peterfi Z, Fabian Z. El-Sayed MM, et al. Biology (Basel). 2023 Nov 24;12(12):1463. doi: 10.3390/biology12121463. Biology (Basel). 2023. PMID: 38132289 Free PMC article. Review. - Recirculating Intestinal IgA-Producing Cells Regulate Neuroinflammation via IL-10.
Rojas OL, Pröbstel AK, Porfilio EA, Wang AA, Charabati M, Sun T, Lee DSW, Galicia G, Ramaglia V, Ward LA, Leung LYT, Najafi G, Khaleghi K, Garcillán B, Li A, Besla R, Naouar I, Cao EY, Chiaranunt P, Burrows K, Robinson HG, Allanach JR, Yam J, Luck H, Campbell DJ, Allman D, Brooks DG, Tomura M, Baumann R, Zamvil SS, Bar-Or A, Horwitz MS, Winer DA, Mortha A, Mackay F, Prat A, Osborne LC, Robbins C, Baranzini SE, Gommerman JL. Rojas OL, et al. Cell. 2019 Jan 24;176(3):610-624.e18. doi: 10.1016/j.cell.2018.11.035. Epub 2019 Jan 3. Cell. 2019. PMID: 30612739 Free PMC article. - Different Expression Characteristics of LAG3 and PD-1 in Sepsis and Their Synergistic Effect on T Cell Exhaustion: A New Strategy for Immune Checkpoint Blockade.
Niu B, Zhou F, Su Y, Wang L, Xu Y, Yi Z, Wu Y, Du H, Ren G. Niu B, et al. Front Immunol. 2019 Aug 7;10:1888. doi: 10.3389/fimmu.2019.01888. eCollection 2019. Front Immunol. 2019. PMID: 31440257 Free PMC article. - Coix Seed Diet Ameliorates Immune Function Disorders in Experimental Colitis Mice.
Zhou Q, Yu R, Liu T, Li Y, Zhong J, Zhang T, Liu Z, Hu Y. Zhou Q, et al. Nutrients. 2021 Dec 28;14(1):123. doi: 10.3390/nu14010123. Nutrients. 2021. PMID: 35010997 Free PMC article. - Metabolic regulation and function of T helper cells in neuroinflammation.
Spiljar M, Kuchroo VK. Spiljar M, et al. Semin Immunopathol. 2022 Sep;44(5):581-598. doi: 10.1007/s00281-022-00959-z. Epub 2022 Sep 6. Semin Immunopathol. 2022. PMID: 36068310 Review.
References
- Berer K. et al.. Commensal microbiota and myelin autoantigen cooperate to trigger autoimmune demyelination. Nature 479, 538–541 (2011). - PubMed
- Haghikia A. et al.. Dietary fatty acids directly impact central nervous system autoimmunity via the small intestine. Immunity 43, 817–829 (2015). - PubMed
Publication types
MeSH terms
Substances
LinkOut - more resources
Full Text Sources
Other Literature Sources
Molecular Biology Databases
Research Materials
Miscellaneous
