Unraveling the drivers of MERS-CoV transmission - PubMed (original) (raw)
. 2016 Aug 9;113(32):9081-6.
doi: 10.1073/pnas.1519235113. Epub 2016 Jul 25.
Pierre Nouvellet 2, Anne Cori 2, Thibaut Jombart 2, Tini Garske 2, Hannah Clapham 3, Sean Moore 3, Harriet Linden Mills 2, Henrik Salje 4, Caitlin Collins 2, Isabel Rodriquez-Barraquer 3, Steven Riley 2, Shaun Truelove 3, Homoud Algarni 5, Rafat Alhakeem 5, Khalid AlHarbi 5, Abdulhafiz Turkistani 5, Ricardo J Aguas 2, Derek A T Cummings 6, Maria D Van Kerkhove 7, Christl A Donnelly 2, Justin Lessler 3, Christophe Fraser 2, Ali Al-Barrak 8, Neil M Ferguson 9
Affiliations
- PMID: 27457935
- PMCID: PMC4987807
- DOI: 10.1073/pnas.1519235113
Unraveling the drivers of MERS-CoV transmission
Simon Cauchemez et al. Proc Natl Acad Sci U S A. 2016.
Abstract
With more than 1,700 laboratory-confirmed infections, Middle East respiratory syndrome coronavirus (MERS-CoV) remains a significant threat for public health. However, the lack of detailed data on modes of transmission from the animal reservoir and between humans means that the drivers of MERS-CoV epidemics remain poorly characterized. Here, we develop a statistical framework to provide a comprehensive analysis of the transmission patterns underlying the 681 MERS-CoV cases detected in the Kingdom of Saudi Arabia (KSA) between January 2013 and July 2014. We assess how infections from the animal reservoir, the different levels of mixing, and heterogeneities in transmission have contributed to the buildup of MERS-CoV epidemics in KSA. We estimate that 12% [95% credible interval (CI): 9%, 15%] of cases were infected from the reservoir, the rest via human-to-human transmission in clusters (60%; CI: 57%, 63%), within (23%; CI: 20%, 27%), or between (5%; CI: 2%, 8%) regions. The reproduction number at the start of a cluster was 0.45 (CI: 0.33, 0.58) on average, but with large SD (0.53; CI: 0.35, 0.78). It was >1 in 12% (CI: 6%, 18%) of clusters but fell by approximately one-half (47% CI: 34%, 63%) its original value after 10 cases on average. The ongoing exposure of humans to MERS-CoV from the reservoir is of major concern, given the continued risk of substantial outbreaks in health care systems. The approach we present allows the study of infectious disease transmission when data linking cases to each other remain limited and uncertain.
Keywords: animal reservoir; epidemic dynamics; mathematical modeling; outbreaks; zoonotic virus.
Conflict of interest statement
The authors declare no conflict of interest.
Figures
Fig. 1.
The epidemic of MERS-CoV in KSA between January 1, 2013, and July 31, 2014. (A) Biweekly number of MERS-CoV laboratory-confirmed infections per region. (B) Weekly number of cases in the different hospitals and over time. The color of dots indicates the weekly number of cases. Colors on the y axis indicate the region of the hospital. (C) Distribution of the number of cases per cluster. (D) Map of the KSA. Colors in A, B, and C match the color of regions in D.
Fig. 2.
Transmission characteristics of MERS-CoV in KSA. (A) Cumulative distribution function of the within-cluster reproduction number at the start of a new cluster (black line). Gray dots show the posterior mean for each cluster. (B) Variations in the within-cluster reproduction number as a function of the cumulated number of cases in the cluster (solid line: posterior mean; dotted lines: 95% CI). (C) Distribution of the serial interval of MERS-CoV (solid line: posterior mean; dotted lines: 95% CI). (D) Weekly number of introductions from the reservoir during the study period (solid line: posterior mean; dotted lines: 95% CI).
Fig. 3.
Model adequacy. Observed values (red dot) and values predicted by the model from 10,000 simulations (blue cross: mean; black boxplot gives quantiles 2.5%, 25%, 50%, 75%, 97.5%). (A) Number of cases. (B) Number of clusters. (C) Mean cluster size. (D) Maximum cluster size. (E) Probability that a cluster is of size 1. (F) Probability that the size of a cluster is larger than 10. (G) Maximum number of cases over a 2-mo period. (H) Maximum number of clusters over a 2-mo period.
Fig. 4.
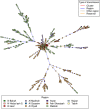
A reconstructed transmission tree consistent with the data. Each dot represents a case. The large central dot represents the animal reservoir.
Fig. 5.
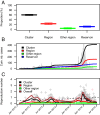
Relative contributions of the different routes of transmission. (A) Proportion of cases by inferred route of transmission. (B) Temporal trend in the cumulated number of cases by inferred route of transmission. Trends in the daily number of cases appear in gray. (C) Temporal trend in the estimated reproduction number for the different routes of transmission. Gray, pink, and green crosses give estimates of within-cluster, within-region, and between-region reproduction numbers for individual cases, respectively. These summary statistics were derived from the probabilistic reconstruction of 500 transmission trees consistent with the data like the one plotted in Fig. 4.
Similar articles
- Cross-sectional study of MERS-CoV-specific RNA and antibodies in animals that have had contact with MERS patients in Saudi Arabia.
Kasem S, Qasim I, Al-Hufofi A, Hashim O, Alkarar A, Abu-Obeida A, Gaafer A, Elfadil A, Zaki A, Al-Romaihi A, Babekr N, El-Harby N, Hussien R, Al-Sahaf A, Al-Doweriej A, Bayoumi F, Poon LLM, Chu DKW, Peiris M, Perera RAPM. Kasem S, et al. J Infect Public Health. 2018 May-Jun;11(3):331-338. doi: 10.1016/j.jiph.2017.09.022. Epub 2017 Oct 6. J Infect Public Health. 2018. PMID: 28993171 Free PMC article. - High Prevalence of MERS-CoV Infection in Camel Workers in Saudi Arabia.
Alshukairi AN, Zheng J, Zhao J, Nehdi A, Baharoon SA, Layqah L, Bokhari A, Al Johani SM, Samman N, Boudjelal M, Ten Eyck P, Al-Mozaini MA, Zhao J, Perlman S, Alagaili AN. Alshukairi AN, et al. mBio. 2018 Oct 30;9(5):e01985-18. doi: 10.1128/mBio.01985-18. mBio. 2018. PMID: 30377284 Free PMC article. - MERS coronavirus outbreak: Implications for emerging viral infections.
Al-Omari A, Rabaan AA, Salih S, Al-Tawfiq JA, Memish ZA. Al-Omari A, et al. Diagn Microbiol Infect Dis. 2019 Mar;93(3):265-285. doi: 10.1016/j.diagmicrobio.2018.10.011. Epub 2018 Oct 18. Diagn Microbiol Infect Dis. 2019. PMID: 30413355 Free PMC article. Review. - Public response to MERS-CoV in the Middle East: iPhone survey in six countries.
Alqahtani AS, Rashid H, Basyouni MH, Alhawassi TM, BinDhim NF. Alqahtani AS, et al. J Infect Public Health. 2017 Sep-Oct;10(5):534-540. doi: 10.1016/j.jiph.2016.11.015. Epub 2017 Feb 6. J Infect Public Health. 2017. PMID: 28185821 Free PMC article. - MERS-CoV: epidemiology, molecular dynamics, therapeutics, and future challenges.
Rabaan AA, Al-Ahmed SH, Sah R, Alqumber MA, Haque S, Patel SK, Pathak M, Tiwari R, Yatoo MI, Haq AU, Bilal M, Dhama K, Rodriguez-Morales AJ. Rabaan AA, et al. Ann Clin Microbiol Antimicrob. 2021 Jan 18;20(1):8. doi: 10.1186/s12941-020-00414-7. Ann Clin Microbiol Antimicrob. 2021. PMID: 33461573 Free PMC article. Review.
Cited by
- MERS-CoV Infection and Its Impact on the Expression of TSLP Cytokine and IgG Antibodies: An In Vivo and In Vitro Study.
Mubarak A, Alqoufail M, Almutairi S, Alrfaei B, Almotairi A, Aziz I, Almanaa TN, Abdel-Maksoud MA, Farrag MA, Aldreiwish AD, Awadalla ME, Alosaimi B, Alturaiki W. Mubarak A, et al. Infect Drug Resist. 2024 Oct 23;17:4589-4598. doi: 10.2147/IDR.S483133. eCollection 2024. Infect Drug Resist. 2024. PMID: 39469096 Free PMC article. - Estimating the reproduction number and transmission heterogeneity from the size distribution of clusters of identical pathogen sequences.
Tran-Kiem C, Bedford T. Tran-Kiem C, et al. Proc Natl Acad Sci U S A. 2024 Apr 9;121(15):e2305299121. doi: 10.1073/pnas.2305299121. Epub 2024 Apr 3. Proc Natl Acad Sci U S A. 2024. PMID: 38568971 Free PMC article. - COVID-19, people with disabilities, and the Italian government recovery: investigating the impact and promoting psychological resources to prevent future emergencies.
Camussi E, Meneghetti D, Sbarra ML, Rella R, Barillà F, Sassi C, Montali L, Annovazzi C. Camussi E, et al. Front Psychol. 2023 Oct 25;14:1260853. doi: 10.3389/fpsyg.2023.1260853. eCollection 2023. Front Psychol. 2023. PMID: 37954172 Free PMC article. - Ensemble inference of unobserved infections in networks using partial observations.
Zhang R, Tai J, Pei S. Zhang R, et al. PLoS Comput Biol. 2023 Aug 7;19(8):e1011355. doi: 10.1371/journal.pcbi.1011355. eCollection 2023 Aug. PLoS Comput Biol. 2023. PMID: 37549190 Free PMC article. - Unifying incidence and prevalence under a time-varying general branching process.
Pakkanen MS, Miscouridou X, Penn MJ, Whittaker C, Berah T, Mishra S, Mellan TA, Bhatt S. Pakkanen MS, et al. J Math Biol. 2023 Aug 1;87(2):35. doi: 10.1007/s00285-023-01958-w. J Math Biol. 2023. PMID: 37526739 Free PMC article.
References
- World Health Organization 2015 Middle East respiratory syndrome coronavirus (MERS-CoV). Available at www.who.int/emergencies/mers-cov/en/. Accessed May 4, 2016.
Publication types
MeSH terms
Grants and funding
- MR/K010174/1/MRC_/Medical Research Council/United Kingdom
- U01 GM110721/GM/NIGMS NIH HHS/United States
- G0800596/MRC_/Medical Research Council/United Kingdom
- MR/J008761/1/MRC_/Medical Research Council/United Kingdom
- U54 GM088491/GM/NIGMS NIH HHS/United States
LinkOut - more resources
Full Text Sources
Other Literature Sources


