Vascular stiffness mechanoactivates YAP/TAZ-dependent glutaminolysis to drive pulmonary hypertension - PubMed (original) (raw)
. 2016 Sep 1;126(9):3313-35.
doi: 10.1172/JCI86387. Epub 2016 Aug 22.
William M Oldham, Katherine A Cottrill, Sabrina Pisano, Rebecca R Vanderpool, Qiujun Yu, Jingsi Zhao, Yiyin Tai, Ying Tang, Ying-Yi Zhang, Sofiya Rehman, Masataka Sugahara, Zhi Qi, John Gorcsan 3rd, Sara O Vargas, Rajan Saggar, Rajeev Saggar, W Dean Wallace, David J Ross, Kathleen J Haley, Aaron B Waxman, Victoria N Parikh, Teresa De Marco, Priscilla Y Hsue, Alison Morris, Marc A Simon, Karen A Norris, Cedric Gaggioli, Joseph Loscalzo, Joshua Fessel, Stephen Y Chan
- PMID: 27548520
- PMCID: PMC5004943
- DOI: 10.1172/JCI86387
Vascular stiffness mechanoactivates YAP/TAZ-dependent glutaminolysis to drive pulmonary hypertension
Thomas Bertero et al. J Clin Invest. 2016.
Abstract
Dysregulation of vascular stiffness and cellular metabolism occurs early in pulmonary hypertension (PH). However, the mechanisms by which biophysical properties of the vascular extracellular matrix (ECM) relate to metabolic processes important in PH remain undefined. In this work, we examined cultured pulmonary vascular cells and various types of PH-diseased lung tissue and determined that ECM stiffening resulted in mechanoactivation of the transcriptional coactivators YAP and TAZ (WWTR1). YAP/TAZ activation modulated metabolic enzymes, including glutaminase (GLS1), to coordinate glutaminolysis and glycolysis. Glutaminolysis, an anaplerotic pathway, replenished aspartate for anabolic biosynthesis, which was critical for sustaining proliferation and migration within stiff ECM. In vitro, GLS1 inhibition blocked aspartate production and reprogrammed cellular proliferation pathways, while application of aspartate restored proliferation. In the monocrotaline rat model of PH, pharmacologic modulation of pulmonary vascular stiffness and YAP-dependent mechanotransduction altered glutaminolysis, pulmonary vascular proliferation, and manifestations of PH. Additionally, pharmacologic targeting of GLS1 in this model ameliorated disease progression. Notably, evaluation of simian immunodeficiency virus-infected nonhuman primates and HIV-infected subjects revealed a correlation between YAP/TAZ-GLS activation and PH. These results indicate that ECM stiffening sustains vascular cell growth and migration through YAP/TAZ-dependent glutaminolysis and anaplerosis, and thereby link mechanical stimuli to dysregulated vascular metabolism. Furthermore, this study identifies potential metabolic drug targets for therapeutic development in PH.
Figures
Figure 1. ECM stiffening activates glycolysis and glutaminolysis.
(A) By extracellular flux analysis, PAECs cultivated in stiff matrix displayed decreased oxygen consumption rate (OCR) and increased extracellular acidification rate (ECAR), reflective of glycolysis. (B) PAECs cultivated in stiff matrix displayed increased basal glycolysis and corresponding decreased glycolytic reserve (as assessed by the difference between oligomycin A–induced ECAR and basal ECAR). (C) Basal OCR, ATP-dependent OCR (difference between basal OCR and oligomycin A–inhibited OCR), and respiratory reserve (maximal FCCP-induced OCR) were decreased in PAECs in stiff matrix. (D) MitoTracker (Thermo Fisher Scientific) labeling confirmed a decrease of mitochondrial activity in PAECs in stiff matrix. (E) Major metabolites in anaplerosis and glycolysis were measured in this study. GLS and PC generate the major anaplerotic metabolites (blue), feeding into the TCA cycle (black) and supporting the anabolic demand for biosynthesis (green). LDHA modulates glycolysis (red). α-KG, α-ketoglutarate; OAA, oxaloacetic acid. (F) In PAECs in stiff matrix, increased lactate/pyruvate ratio was observed, consistent with increased glycolysis and decreased oxidative phosphorylation. (G) In these same cells, glutamine, pyruvate, and succinate were decreased, while glutamate and aspartate were increased. (H) Released lactate was progressively increased in PAECs cultivated in an increasing gradient of matrix stiffness. (I–K) In PAECs, GLS1, LDHA, and PC expression was increased by matrix stiffening, as confirmed by RT–quantitative PCR (RT-qPCR) (CTGF, positive control) (I), and by immunoblot and densitometry (J and K). In all panels, mean expression in controls (soft matrix) was assigned a fold change of 1, to which relevant samples were compared. Data are expressed as the mean ± SEM (*P < 0.05, §P < 0.01, #P < 0.001) of at least 3 independent experiments performed in triplicate. Paired samples were compared by 2-tailed Student’s t test, while 1-way ANOVA and post-hoc Tukey’s tests were used for group comparisons. Scale bar: 20 μm. See also Supplemental Figure 1 (similar results were found in PASMCs).
Figure 2. A metabolic switch induced by ECM stiffening is coordinated by the mechanoactivation of YAP/TAZ.
(A) Immunoblot analysis confirmed the knockdown of YAP and TAZ by 2 independent siRNA sequences in PAECs. (B–E) PAECs were cultured in soft or stiff matrix. Released lactate was increased in stiff matrix, but such increase was blunted by siRNA knockdown of YAP/TAZ (B). In stiff matrix, YAP/TAZ knockdown also blunted specific metabolite alterations reflective of anaplerotic (C) and glycolytic activity as reflected by the lactate/pyruvate ratio (D). MitoTracker labeling confirmed that YAP/TAZ knockdown reversed the alteration of mitochondrial membrane potential triggered by stiff matrix (E). (F) Immunoblot analysis confirmed the forced expression of YAP in PAECs infected with a lentiviral vector containing the YAP coding sequences (pYAP) compared with cells infected with a control vector (pGFP). (G) In PAECs cultivated on soft matrix, forced expression of YAP (pYAP) increased lactate compared with control vector (pGFP). (H and I) In similarly treated PAECs, YAP decreased glutamine, pyruvate, and succinate, increased glutamate and aspartate (H), and increased lactate/pyruvate ratio (I). (J) MitoTracker labeling confirmed that YAP (pYAP) in soft matrix altered PAEC mitochondrial membrane potential. In all panels, mean expression in control groups (si-NC, pGFP cultivated on soft matrix) was assigned a fold change of 1, to which relevant samples were compared. Data are expressed as mean ± SEM (*P < 0.05, §P < 0.01, #P < 0.001) of at least 3 independent experiments performed in triplicate. Paired samples were compared by 2-tailed Student’s t test, while 1-way ANOVA and post-hoc Tukey’s tests were used for group comparisons. Scale bars: 20 μm. See also Supplemental Figure 2 (similar results were found in PASMCs).
Figure 3. YAP and TAZ control the transcription of key metabolic enzymes.
(A) Sequence analysis predicted the presence of TEAD binding sites (labeled as A–D) in the promoter regions of GLS1, LDHA, and PC. (B) ChIP-qPCR confirmed the presence of TEAD/YAP binding sites in the GLS1, LDHA, and PC promoter regions. CTGF, a known YAP target, was used as a positive control. Results are expressed as percentage of total input DNA prior to immunoprecipitation with anti-YAP or anti-IgG control. (C–E) RT-qPCR (C) accompanied by immunoblotting (D) and densitometry (E) revealed that increased GLS1, LDHA, and PC expression in PAECs in stiff matrix was blunted by YAP/TAZ knockdown. (F–H) RT-qPCR (F) and immunoblotting and densitometry (G and H) revealed that YAP (pYAP) increased GLS1, LDHA, and PC expression in PAECs in soft matrix. In all panels, mean expression in control groups (si-NC, pGFP cultivated on soft matrix) was assigned a fold change of 1, to which relevant samples were compared. Data are expressed as the mean ± SEM (*P < 0.05, §P < 0.01, #P < 0.001) of at least 3 independent experiments performed in triplicate. Paired samples were compared by 2-tailed Student’s t test, while 1-way ANOVA and post-hoc Tukey’s tests were used for group comparisons. See also Supplemental Figure 2 (similar results were found in PASMCs).
Figure 4. Pharmacologic or genetic inhibition of GLS1 blunts the upregulation of glutaminolysis in stiff matrix.
(A–C) In PAECs, targeted LC-MS/MS revealed that pharmacologic inhibition of GLS1 (BPTES or DON) blunted the alterations of metabolite expression in stiff matrix. Specifically, compared with stiff matrix control (si-NC stiff), GLS1 inhibition increased glutamine, pyruvate, and succinate, decreased glutamate and aspartate (A), and decreased extracellular lactate (B) as well as lactate/pyruvate ratio (C). (D) Immunoblot analysis confirmed the knockdown of GLS1 by 2 independent siRNA sequences. (E–G) In PAECs, GLS1 knockdown blunted the alterations of metabolite expression in stiff matrix, increasing glutamine, pyruvate, and succinate; decreasing glutamate and aspartate (E); and decreasing extracellular lactate and lactate/pyruvate ratio (F and G). In all panels, mean expression in control groups (vehicle, si-NC cultivated on soft matrix) was assigned a fold change of 1, to which relevant samples were compared. Data are expressed as the mean ± SEM (*P < 0.05, §P < 0.01, #P < 0.001) of at least 3 independent experiments performed in triplicate. One-way ANOVA and post-hoc Tukey’s tests were used for group comparisons.
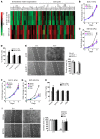
Figure 5. Inhibition of GLS1 decreases glutaminolysis in order to sustain cellular proliferation in stiff matrix.
(A) Transcriptomic analysis (heatmap) of PAECs cultivated on soft or stiff matrix (n = 3 per group) revealed a programmatic alteration of genes associated with ECM organization and proliferation (cell cycle). Notably, these changes were blunted by GLS1 knockdown on stiff matrix. (B–D) GLS1 knockdown blunted PAEC proliferation on stiff (C), but not soft (B), matrix, as revealed by cell counting (B and C) and BrdU pulse experiments (D). (E) As assessed by scratch assay, GLS1 knockdown also inhibited PAEC migration. (F–I) Similarly, pharmacologic inhibition of GLS blunted PAEC proliferation on stiff (G), but not soft (F), matrix (F–H) and inhibited PAEC migration (I). In all panels, mean expression in control groups (si-NC or vehicle cultivated on soft matrix) was assigned a fold change of 1, to which relevant samples were compared. Data are expressed as the mean ± SEM (*P < 0.05, §P < 0.01, #P < 0.001) of at least 3 independent experiments performed in triplicate. Paired samples were compared by 2-tailed Student’s t test, while 1-way ANOVA and post-hoc Tukey’s tests were used for group comparisons. Scale bars: 200 μm. See also Supplemental Figures 3 and 4.
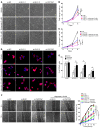
Figure 6. The production of aspartate and glutamate is crucial for YAP/TAZ-dependent glutaminolytic control of proliferation on stiff matrix.
(A) Representative micrographs of PAECs are shown, cultivated on stiff matrix and exposed to the indicated conditions. Cell counting (B and C) and quantification of PCNA fluorescent labeling (D and E) revealed that siRNA knockdown of GLS1 or YAP/TAZ decreased cell proliferation. Supplementation by glutamate and, to a better extent, aspartate sustained proliferation of PAECs even when GLS1 or YAP/TAZ was knocked down. (F) Similarly, scratch assay demonstrated that aspartate supplementation of PAECs in stiff matrix increased cell migration even during GLS1 or YAP/TAZ knockdown. In all panels, mean expression in control groups (si-NC) was assigned a fold change of 1, to which relevant samples were compared. Data are expressed as the mean ± SD (*P < 0.05, §P < 0.01, #P < 0.001) of at least 3 independent experiments performed in triplicate. P values were derived from 1-way ANOVA with a post-hoc Tukey’s test. Scale bars: 200 μm. See also Supplemental Figure 5.
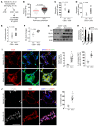
Figure 7. Periarteriolar fibrillar collagen correlates with increased arteriolar stiffness, GLS1, glutaminolysis, and aspartate in monocrotaline-exposed PAH rats.
Rats were administered 60 mg/kg of vehicle (n = 6) or monocrotaline (n = 6) to induce PAH. (A) After 3 weeks, CD31+ endothelial cells were isolated from whole lung for analysis by LC-MS/MS, immunoblot, and RT-qPCR. AFM, atomic force microscopy. (B) AFM revealed increased pulmonary arteriolar (<100 μm diameter, 5–9 vessels per rat) stiffness in PH lung (n = 4 rats) versus untreated (n = 4 rats); horizontal lines denote median; symbols denote individual pulmonary arteriolar measurements. P value was calculated by Mann-Whitney U test. (C–E) PAH CD31+ cells displayed a decrease in glutamine (C) and converse increase in aspartate (D). This correlated with an increase in lactate/pyruvate ratio (E). (F) RT-qPCR of PAH CD31+ cells revealed an increase of Gls expression. (G and H) Immunoblot analysis (G) and densitometry (H) revealed an increase of GLS1, LDHA, and PC in CD31+ lung cells of PAH rats (n = 3 rats per group). (I and J) Coimmunofluorescence microscopy demonstrated an increase of YAP1/GLS1 (I) and YAP1/PCNA (J) double-positive cells in diseased pulmonary arterioles. In all panels, mean expression in control groups was assigned a fold change of 1, to which relevant samples were compared. Data are expressed as the mean ± SD (*P < 0.05, §P < 0.01, #P < 0.001). In all panels except B, P values were derived from 2-tailed Student’s t test. Scale bars: 50 μm. See also Supplemental Figures 6–8.
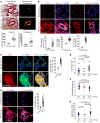
Figure 8. Periarteriolar fibrillar collagen correlates with increased GLS1, glutaminolysis, and aspartate in multiple forms of human PAH.
(A) By Picrosirius red stain of human PAH (n = 13) versus non-PAH lung (n = 6), quantification of less-than-100-μm vessels (5 vessels per patient) confirmed increased collagen deposition and fibrillar collagen assembly in PAH. (B) In human PAH tissue (n = 13), coimmunofluorescence microscopy and quantification also confirmed an increase of GLS1 in both α-SMA+ and vWF+ cells in diseased pulmonary arterioles as compared with controls (n = 6). (C and D) Coimmunofluorescence microscopy revealed increased YAP1/GLS1 (C) and YAP1/PCNA (D) double-positive cells in diseased pulmonary arterioles (PAH, n = 6, vs. no PAH, n = 6). (E–G) In correlation, targeted LC-MS/MS revealed increasingly higher plasma levels of lactate/pyruvate ratio (E), lower levels of glutamine/glutamate ratio (F), and increasing levels of aspartate (G) in patients with increasing hemodynamic severity of PH. In all panels, mean expression in control groups was assigned a fold change of 1, to which relevant samples were compared. Data are expressed as the mean ± SD (#P < 0.001). In A–D, P values were derived from 2-tailed Student’s t test. In E–G, P values were derived from 1-way ANOVA with a post-hoc Tukey’s test. Scale bars: 50 μm. See also Supplemental Figures 9 and 10.
Figure 9. Periarteriolar fibrillar collagen deposition correlates with increased GLS1, glutaminolysis, and aspartate production in primate examples of SIV-induced PAH.
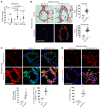
(A–D) Rhesus macaques were infected with SIV and evaluated over the course of 6 and 10–12 months postinfection (mpi) as compared with before infection (BI). (A) In 13 of the 22 macaques infected by SIV, PAH was evident as assessed by RVSP and histologic remodeling (see Supplemental Figure 11A). (B) Picrosirius red stain revealed increased periarteriolar fibrillar collagen deposition in SIV-PAH. (C and D) Coimmunofluorescence microscopy revealed an increase of YAP1/GLS1 (C) and YAP1/PCNA (D) double-positive cells in diseased pulmonary arterioles. In all panels, mean expression in control groups was assigned a fold change of 1, to which relevant samples were compared. P values were derived from 1-way ANOVA and post-hoc Tukey’s tests in A, while 2-tailed Student’s t test was used for other comparisons (#P < 0.001). Scale bars: 50 μm. See also Supplemental Figure 11.
Figure 10. Pulmonary arterial compliance is inversely correlated with increased glutaminolysis and aspartate production in human examples of HIV-induced PAH.
(A) By invasive pulmonary arterial catheterization, decreased pulmonary arterial (PA) compliance was observed in a cohort of documented HIV-PAH patients (n = 11) as compared with HIV-infected patients alone (n = 31). (B–D) In correlation, targeted LC-MS/MS in plasma revealed increased lactate/pyruvate ratio (B), decreased glutamine/glutamate ratio (C), and increased aspartate (D) in an independent HIV-PAH patient cohort (n = 9) as compared with HIV-infected patients alone (n = 7). In all panels, mean expression in control groups was assigned a fold change of 1, to which relevant samples were compared. P values were derived from a 2-tailed Student’s t test.
Figure 11. Manipulation of vascular mechanotransduction in vivo controls glutaminolysis.
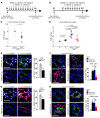
(A and B) Following monocrotaline exposure, rats were treated with daily BAPN (n = 8) versus vehicle (A; n = 7) or with daily i.p. injections of separate verteporfin (n = 6) versus separate vehicle (B; n = 6). (C) Both BAPN and verteporfin decreased Lox activity in lungs of monocrotaline-exposed rats. (D) Atomic force microscopy revealed decreased pulmonary arteriolar (<100 μm diameter) stiffness in BAPN- and verteporfin-treated rats. Horizontal lines denote median; symbols denote individual pulmonary arterial measurements. (E and F) RT-qPCR of PAH CD31+ cells revealed a decrease of 2 YAP-dependent target genes, Ctgf and Cyr61, as well as a decrease of Gls expression (E) and GLS activity (F) in BAPN- and verteporfin-treated rats. Black font reports P values when comparing with pooled vehicle controls; red or blue font reports P values when comparing with separate vehicle controls. sIn all panels, mean expression in control groups was assigned a fold change of 1, to which relevant samples were compared. P values were derived from 1-way ANOVA and post-hoc Tukey’s tests (*P < 0.05, #P < 0.001). See also Supplemental Figure 12.
Figure 12. Manipulation of vascular mechanotransduction in vivo controls pulmonary vascular proliferation and PH.
Following monocrotaline exposure, rats were treated with daily BAPN (n = 8) versus vehicle (A; n = 7) or with daily i.p. injections of separate verteporfin (n = 6) versus separate vehicle (B; n = 6). (A) H&E stain and coimmunofluorescence microscopy revealed a decrease of vessel thickness and muscularization as well as a decrease of YAP1+ cells, GLS1 vascular intensity, and CD31/PCNA and α-SMA/PCNA double-positive cells in BAPN- and verteporfin-treated rats compared with vehicle controls. (B and C) Verteporfin reduced PAH severity, as quantified by RVSP (B) and right ventricular hypertrophy (Fulton index, RV/LV+S) (C). Similar trends were observed with BAPN treatment. In all panels, mean expression in control groups was assigned a fold change of 1, to which relevant samples were compared. P values were derived from 1-way ANOVA and post-hoc Tukey’s tests (*P < 0.05, §P < 0.01, #P < 0.001). Scale bar: 50 μm. See also Supplemental Figure 12.
Figure 13. Pharmacologic inhibition of GLS1 in monocrotaline-exposed rats decreases glutaminolysis and consequent pulmonary vascular cell proliferation.
(A and B) After monocrotaline administration, rats were treated with daily i.p. injections of 2 pharmacologic inhibitors of GLS1. Vehicle (n = 6) versus C968 (n = 6) (A) and vehicle (n = 8) versus CB-839 (n = 6) (B) were compared using either a disease prevention (C968) or disease reversal (CB-839) dosing protocol. (C and D) Either C968 (C) or CB-839 (D) decreased GLS activity in lungs of monocrotaline-exposed rats. (E–H) Coimmunofluorescence microscopy revealed Ki-67/PCNA–positive proliferating cells in diseased pulmonary arterioles (vehicle). Either C968 or CB-839 reduced the number of Ki-67/PCNA–positive cells in α-SMA+ medial (G and H) and CD31+ or vWF+ endothelial (E and F) compartments. In all panels, mean expression in control groups was assigned a fold change of 1, to which relevant samples were compared. Data are expressed as the mean ± SEM (*P < 0.05, §P < 0.01, #P < 0.001). Paired samples were compared by a 2-tailed Student’s t test, while 1-way ANOVA and post-hoc Tukey’s tests were used for group comparisons. Scale bars: 50 μm.
Figure 14. Pharmacologic inhibition of GLS1 in monocrotaline-exposed rats ameliorates PH in vivo.
Following monocrotaline injection, via either a disease prevention (C968) or disease reversal (CB-839) dosing protocol (cohort sizes defined in each panel), inhibition of glutaminolysis ameliorated PH severity, as quantified by vascular remodeling (A and B), arteriolar muscularization (C and D), RVSP (E and G), and right ventricular hypertrophy (Fulton index, RV/LV+S) (F and H). In all panels, mean expression in control groups was assigned a fold change of 1, to which relevant samples were compared. Data are expressed as the mean ± SEM (*P < 0.05, §P < 0.01, #P < 0.001). Paired samples were compared by a 2-tailed Student’s t test, while 1-way ANOVA and post-hoc Tukey’s tests were used for group comparisons. Scale bars: 50 μm. See also Supplemental Figures 13 and 14.
Figure 15. Model of pathogenic mechanoactivation of YAP/TAZ and key metabolic enzymes by pulmonary vascular stiffness in order to control glutaminolysis and PH.
In nondiseased and compliant pulmonary arterioles, endothelial and smooth muscle cells undergo a basal level of proliferation (left diagram). Pulmonary vascular ECM stiffening mechanoactivates YAP/TAZ to induce key metabolic enzymes GLS1, PC, and LDHA and to promote glutaminolysis and glycolysis. Such glutaminolysis sustains the metabolic needs of hyperproliferative vascular cells, thus driving overt pulmonary vascular remodeling and PH (right diagram).
Comment in
- Vascular Stiffness and Mechanotransduction: Back in the Limelight.
Dabral S, Pullamsetti SS. Dabral S, et al. Am J Respir Crit Care Med. 2017 Aug 15;196(4):527-530. doi: 10.1164/rccm.201611-2254LE. Am J Respir Crit Care Med. 2017. PMID: 28809511 No abstract available.
Similar articles
- Arterial stiffness induces remodeling phenotypes in pulmonary artery smooth muscle cells via YAP/TAZ-mediated repression of cyclooxygenase-2.
Dieffenbach PB, Haeger CM, Coronata AMF, Choi KM, Varelas X, Tschumperlin DJ, Fredenburgh LE. Dieffenbach PB, et al. Am J Physiol Lung Cell Mol Physiol. 2017 Sep 1;313(3):L628-L647. doi: 10.1152/ajplung.00173.2017. Epub 2017 Jun 22. Am J Physiol Lung Cell Mol Physiol. 2017. PMID: 28642262 Free PMC article. - Simultaneous Pharmacologic Inhibition of Yes-Associated Protein 1 and Glutaminase 1 via Inhaled Poly(Lactic-co-Glycolic) Acid-Encapsulated Microparticles Improves Pulmonary Hypertension.
Acharya AP, Tang Y, Bertero T, Tai YY, Harvey LD, Woodcock CC, Sun W, Pineda R, Mitash N, Königshoff M, Little SR, Chan SY. Acharya AP, et al. J Am Heart Assoc. 2021 Jun 15;10(12):e019091. doi: 10.1161/JAHA.120.019091. Epub 2021 May 29. J Am Heart Assoc. 2021. PMID: 34056915 Free PMC article. - Matrix Remodeling Promotes Pulmonary Hypertension through Feedback Mechanoactivation of the YAP/TAZ-miR-130/301 Circuit.
Bertero T, Cottrill KA, Lu Y, Haeger CM, Dieffenbach P, Annis S, Hale A, Bhat B, Kaimal V, Zhang YY, Graham BB, Kumar R, Saggar R, Saggar R, Wallace WD, Ross DJ, Black SM, Fratz S, Fineman JR, Vargas SO, Haley KJ, Waxman AB, Chau BN, Fredenburgh LE, Chan SY. Bertero T, et al. Cell Rep. 2015 Nov 3;13(5):1016-32. doi: 10.1016/j.celrep.2015.09.049. Epub 2015 Oct 22. Cell Rep. 2015. PMID: 26565914 Free PMC article. - Role of extracellular matrix in the pathogenesis of pulmonary arterial hypertension.
Thenappan T, Chan SY, Weir EK. Thenappan T, et al. Am J Physiol Heart Circ Physiol. 2018 Nov 1;315(5):H1322-H1331. doi: 10.1152/ajpheart.00136.2018. Epub 2018 Aug 24. Am J Physiol Heart Circ Physiol. 2018. PMID: 30141981 Free PMC article. Review. - YAP/TAZ Signaling as a Molecular Link between Fibrosis and Cancer.
Noguchi S, Saito A, Nagase T. Noguchi S, et al. Int J Mol Sci. 2018 Nov 20;19(11):3674. doi: 10.3390/ijms19113674. Int J Mol Sci. 2018. PMID: 30463366 Free PMC article. Review.
Cited by
- Mechanoregulation of YAP and TAZ in Cellular Homeostasis and Disease Progression.
Cai X, Wang KC, Meng Z. Cai X, et al. Front Cell Dev Biol. 2021 May 24;9:673599. doi: 10.3389/fcell.2021.673599. eCollection 2021. Front Cell Dev Biol. 2021. PMID: 34109179 Free PMC article. Review. - Implication of EZH2 in the Pro-Proliferative and Apoptosis-Resistant Phenotype of Pulmonary Artery Smooth Muscle Cells in PAH: A Transcriptomic and Proteomic Approach.
Habbout K, Omura J, Awada C, Bourgeois A, Grobs Y, Krishna V, Breuils-Bonnet S, Tremblay E, Mkannez G, Martineau S, Nadeau V, Roux-Dalvai F, Orcholski M, Jeyaseelan J, Gutstein D, Potus F, Provencher S, Bonnet S, Paulin R, Boucherat O. Habbout K, et al. Int J Mol Sci. 2021 Mar 15;22(6):2957. doi: 10.3390/ijms22062957. Int J Mol Sci. 2021. PMID: 33803922 Free PMC article. - The Hippo signalling pathway and its implications in human health and diseases.
Fu M, Hu Y, Lan T, Guan KL, Luo T, Luo M. Fu M, et al. Signal Transduct Target Ther. 2022 Nov 8;7(1):376. doi: 10.1038/s41392-022-01191-9. Signal Transduct Target Ther. 2022. PMID: 36347846 Free PMC article. Review. - The role of YAP/TAZ activity in cancer metabolic reprogramming.
Zhang X, Zhao H, Li Y, Xia D, Yang L, Ma Y, Li H. Zhang X, et al. Mol Cancer. 2018 Sep 3;17(1):134. doi: 10.1186/s12943-018-0882-1. Mol Cancer. 2018. PMID: 30176928 Free PMC article. Review. - Acquired disorders of mitochondrial metabolism and dynamics in pulmonary arterial hypertension.
Breault NM, Wu D, Dasgupta A, Chen KH, Archer SL. Breault NM, et al. Front Cell Dev Biol. 2023 Feb 2;11:1105565. doi: 10.3389/fcell.2023.1105565. eCollection 2023. Front Cell Dev Biol. 2023. PMID: 36819102 Free PMC article. Review.
References
- Lammers S, Scott D, Hunter K, Tan W, Shandas R, Stenmark KR. Mechanics and function of the pulmonary vasculature: implications for pulmonary vascular disease and right ventricular function. Compr Physiol. 2012;2(1):295–319. - PubMed
MeSH terms
Substances
Grants and funding
- U01 HL108630/HL/NHLBI NIH HHS/United States
- T32 HL007633/HL/NHLBI NIH HHS/United States
- P01 HL048743/HL/NHLBI NIH HHS/United States
- R01 HL061795/HL/NHLBI NIH HHS/United States
- R01 HL122596/HL/NHLBI NIH HHS/United States
- R37 HL061795/HL/NHLBI NIH HHS/United States
- K24 AI112393/AI/NIAID NIH HHS/United States
- R01 HL090339/HL/NHLBI NIH HHS/United States
- R56 HL126525/HL/NHLBI NIH HHS/United States
- R01 HL124021/HL/NHLBI NIH HHS/United States
- T32 HL110849/HL/NHLBI NIH HHS/United States
- P01 HL103455/HL/NHLBI NIH HHS/United States
- K08 HL128802/HL/NHLBI NIH HHS/United States
- K08 HL121174/HL/NHLBI NIH HHS/United States
- P50 GM107618/GM/NIGMS NIH HHS/United States
- K08 HL096834/HL/NHLBI NIH HHS/United States
- U01 HL125215/HL/NHLBI NIH HHS/United States
- R01 HL131449/HL/NHLBI NIH HHS/United States
LinkOut - more resources
Full Text Sources
Other Literature Sources
Medical
Miscellaneous


