Protective effects of reduced dynamin-related protein 1 against amyloid beta-induced mitochondrial dysfunction and synaptic damage in Alzheimer's disease - PubMed (original) (raw)
Protective effects of reduced dynamin-related protein 1 against amyloid beta-induced mitochondrial dysfunction and synaptic damage in Alzheimer's disease
Maria Manczak et al. Hum Mol Genet. 2016.
Abstract
The purpose of our study was to understand the protective effects of reduced expression of dynamin-related protein (Drp1) against amyloid beta (Aβ) induced mitochondrial and synaptic toxicities in Alzheimer's disease (AD) progression and pathogenesis. Our recent molecular and biochemical studies revealed that impaired mitochondrial dynamics-increased mitochondrial fragmentation and decreased fusion-in neurons from autopsy brains of AD patients and from transgenic AD mice and neurons expressing Aβ, suggesting that Aβ causes mitochondrial fragmentation in AD. Further, our recent co-immunoprecipitation and immunostaining analysis revealed that the mitochondrial fission protein Drp1 interacted with Aβ, and this interaction increased as AD progressed. Based on these findings, we hypothesize that a partial deficiency of Drp1 inhibits Drp1-Aβ interactions and protects Aβ-induced mitochondrial and synaptic toxicities, and maintains mitochondrial dynamics and neuronal function in AD neurons. We crossed Drp1+/- mice with APP transgenic mice (Tg2576 line) and created double mutant (APPXDrp1+/-) mice. Using real-time RT-PCR and immunoblotting analyses, we measured mRNA expressions and protein levels of genes related to the mitochondrial dynamics, mitochondrial biogenesis and synapses from 6-month-old Drp1+/-, APP, APPXDrp1+/- and wild-type (WT) mice. Using biochemical methods, we also studied mitochondrial function and measured soluble Aβ in brain tissues from all lines of mice in our study. Decreased mRNA expressions and protein levels of Drp1 and Fis1 (fission) and CypD (matrix) genes, and increased levels of Mfn1, Mfn2 and Opa1 (fusion), Nrf1, Nrf2, PGC1α, TFAM (biogenesis) and synaptophysin, PSD95, synapsin 1, synaptobrevin 1, neurogranin, GAP43 and synaptopodin (synaptic) were found in 6-month-old APPXDrp1+/- mice relative to APP mice. Mitochondrial functional assays revealed that mitochondrial dysfunction is reduced in APPXDrp1+/- mice relative to APP mice, suggesting that reduced Drp1enhances mitochondrial function in AD neurons. Sandwich ELISA assay revealed that soluble Aβ levels were significantly reduced in APPXDrp1+/- mice relative to APP mice, indicating that reduced Drp1 decreases soluble Aβ production in AD progression. These findings suggest that a partial reduction of Drp1 reduces Aβ production, reduces mitochondrial dysfunction, and maintains mitochondrial dynamics, enhances mitochondrial biogenesis and synaptic activity in APP mice. These findings may have implications for the development of Drp1 based therapeutics for AD patients.
© The Author 2016. Published by Oxford University Press. All rights reserved. For Permissions, please email: journals.permissions@oup.com.
Figures
Figure 1.
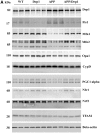
Immunoblotting analysis of mitochondrial dynamics and biogenesis proteins. (A) Shows representative immunoblotting analysis of 6-month-old WT, Drp1+/−, APP and APPXDrp1+/− mice. (B) Shows quantitative densitometry analysis of mitochondrial dynamics proteins Drp1, Fis1, Mfn1, Mfn2, Opa1 and a matrix protein, CypD. (C) Shows quantitative densitometry analysis of mitochondrial biogenesis proteins PGC1α, Nrf1, Nrf1, and TFAM. The fission proteins Drp1 (P = 0.001) and Fis1 (P = 0.002) and matrix protein CypD (P = 0.01) were significantly increased; and the fusion proteins Mfn1 (P = 0.01), Mfn2 (P = 0.01), and Opa1 (P = 0.03) were significantly decreased in APP mice relative to WT mice, indicating the presence of abnormal mitochondrial dynamics. On the contrary, in APPXDrp1+/− mice relative to APP mice, the fission proteins Drp1 (P = 0.01) and Fis1 (P = 0.03) and matrix protein CypD (P = 0.01) were significantly decreased; and the fusion proteins Mfn1 (P = 0.04), Mfn2 (P = 0.01), and Opa1 (P = 0.04) were significantly increased, indicating that reduced Drp1 protects against mutant APP and Aβ-induced mitochondrial dynamics toxicity. The levels of mitochondrial biogenesis proteins PGC1α (P = 0.01), Nrf1 (P = 0.01), Nrf2 (P = 0.004) and TFAM (P = 0.001) were significantly decreased in APP mice relative to WT mice. In APPXDrp1+/− mice relative APP mice, biogenesis proteins PGC1α (P = 0.01), Nrf1 (P = 0.01), Nrf2 (P = 0.01) and TFAM (P = 0.01).
Figure 2.
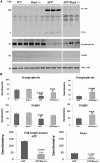
Immunoblotting analysis of full-length mutant APP, Aβ and synaptic proteins. (A) Represents immunoblotting analysis. (B) Represents quantitative immunoblotting analysis. Synaptophysin (P = 0.001) and PSD95 (P = 0.01) proteins were significantly decreased in APP mice relative to WT mice. On the contrary, synaptophysin (P = 0.002) and PSD95 (P = 0.01) proteins were increased in APPXDrp1+/− mice relative to APP mice. The levels of Full-length APP and Abeta were significantly decreased in APPXDrp1+/− mice relative to APP mice.
Figure 3.
Immunofluorescence analysis of mitochondrial dynamics proteins. (A) Represents immunofluorescence analysis. (B) Represents quantitative immunofluorescence analysis. The fission proteins Drp1 (P = 0.02) and Fis1 (P = 0.004) were significantly increased; and the fusion proteins Mfn1 (P = 0.04), Mfn2 (P = 0.01), and Opa1 (P = 0.01) were significantly decreased in APP mice relative to WT mice. On the contrary, the fission proteins Drp1 (P = 0.001) and Fis1 (P = 0.03) significantly decreased; and the fusion proteins Mfn1 (P = 0.02), Mfn2 (P = 0.01), and Opa1 (P = 0.02) were significantly increased APPXDrp1+/− mice relative to APP mice.
Figure 4.
Immunofluorescence analysis of mitochondrial biogenesis proteins. (A) Represents immunofluorescence analysis. (B) Represents quantitative immunofluorescence analysis. Significantly reduced levels of PGC1α (P = 0.03), Nrf1 (P = 0.01), Nrf2 (P = 0.002) and TFAM (P = 0.04) were found in APP mice relative to WT mice. On the contrary, increased protein levels were found in PGC1α (P = 0.01), Nrf1 (P = 0.01), Nrf2 (P = 0.002) and TFAM (P = 0.02) in APPXDrp1+/− mice relative to APP mice.
Figure 5.
Immunofluorescence analysis of synaptic proteins. (A) Represents immunofluorescence analysis. (B) Represents quantitative immunofluorescence analysis. Synaptic proteins, synaptophysin (P = 0.002) and PSD95 (P = 0.002) were significantly decreased in APP mice relative WT mice (Figure 5A and 5B). Synaptic proteins synaptophysin (P = 0.001) and PSD95 (P = 0.004) were significantly increased in APPXDrp1+/− mice relative APP mice (Figure 5A and 5B).
Figure 6.
Immunofluorescence analysis of mutant APP and its derivatives in APP mice and APPXDrp1+/− mice. (A) Represents immunofluorescence analysis. (B) Represents quantitative immunofluorescence analysis. Immunoreactivity levels of mutant APP and its derivatives were significantly reduced in APPXDrp1+/− mice relative to APP mice (P = 0.003), indicating that a partial reduction of Drp1 reduces mutant APP and its derivatives in APP mice.
Figure 7.
Soluble amyloid beta levels in APP and APPXDrp1+/− mice. (A) Represents the levels of soluble Aβ42 and (B) Represents the levels of Aβ40 in APP and APPxDrp1+/− mice. Significantly reduced levels of Aβ42 (P = 0.03) and Aβ40 (P = 0.01) in 6-month-old APPXDrp1+/− mice relative to age-matched APP mice.
Figure 8.
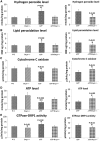
Mitochondrial functional parameters in 6-month-old Drp1+/−, APP, APPXDrp1+/− and WT mice. Mitochondrial function was assessed by measuring: (A) H2O2 production, (B) lipid peroxidation, (C) Cytochrome oxidase activity (D) ATP levels, and (E) GTPase Drp1 activity.
Similar articles
- Reduced dynamin-related protein 1 protects against phosphorylated Tau-induced mitochondrial dysfunction and synaptic damage in Alzheimer's disease.
Kandimalla R, Manczak M, Fry D, Suneetha Y, Sesaki H, Reddy PH. Kandimalla R, et al. Hum Mol Genet. 2016 Nov 15;25(22):4881-4897. doi: 10.1093/hmg/ddw312. Hum Mol Genet. 2016. PMID: 28173111 Free PMC article. - Rg1 improves Alzheimer's disease by regulating mitochondrial dynamics mediated by the AMPK/Drp1 signaling pathway.
Zhang Y, Liu S, Cao D, Zhao M, Lu H, Wang P. Zhang Y, et al. J Ethnopharmacol. 2025 Jan 31;340:119285. doi: 10.1016/j.jep.2024.119285. Epub 2024 Dec 27. J Ethnopharmacol. 2025. PMID: 39733799 - Novel MicroRNA-455-3p and its protective effects against abnormal APP processing and amyloid beta toxicity in Alzheimer's disease.
Kumar S, Reddy AP, Yin X, Reddy PH. Kumar S, et al. Biochim Biophys Acta Mol Basis Dis. 2019 Sep 1;1865(9):2428-2440. doi: 10.1016/j.bbadis.2019.06.006. Epub 2019 Jun 8. Biochim Biophys Acta Mol Basis Dis. 2019. PMID: 31181293 Free PMC article. - Amyloid Beta and Phosphorylated Tau-Induced Defective Autophagy and Mitophagy in Alzheimer's Disease.
Reddy PH, Oliver DM. Reddy PH, et al. Cells. 2019 May 22;8(5):488. doi: 10.3390/cells8050488. Cells. 2019. PMID: 31121890 Free PMC article. Review. - Targeting dynamin-related protein-1 as a potential therapeutic approach for mitochondrial dysfunction in Alzheimer's disease.
Bhatti JS, Kaur S, Mishra J, Dibbanti H, Singh A, Reddy AP, Bhatti GK, Reddy PH. Bhatti JS, et al. Biochim Biophys Acta Mol Basis Dis. 2023 Oct;1869(7):166798. doi: 10.1016/j.bbadis.2023.166798. Epub 2023 Jun 29. Biochim Biophys Acta Mol Basis Dis. 2023. PMID: 37392948 Review.
Cited by
- Use and Reuse of Animal Behavioral, Molecular, and Biochemical Data in Alzheimer's Disease Research: Focus on 3Rs and Saving People's Tax Dollars.
Islam MA, Kshirsagar S, Reddy AP, Sehar U, Reddy PH. Islam MA, et al. J Alzheimers Dis Rep. 2024 Sep 3;8(1):1171-1184. doi: 10.3233/ADR-240126. eCollection 2024. J Alzheimers Dis Rep. 2024. PMID: 39247873 Free PMC article. Review. - Redox signaling and metabolism in Alzheimer's disease.
Holubiec MI, Gellert M, Hanschmann EM. Holubiec MI, et al. Front Aging Neurosci. 2022 Nov 3;14:1003721. doi: 10.3389/fnagi.2022.1003721. eCollection 2022. Front Aging Neurosci. 2022. PMID: 36408110 Free PMC article. Review. - Mitochondria Related Cell Death Modalities and Disease.
Tian C, Liu Y, Li Z, Zhu P, Zhao M. Tian C, et al. Front Cell Dev Biol. 2022 Mar 7;10:832356. doi: 10.3389/fcell.2022.832356. eCollection 2022. Front Cell Dev Biol. 2022. PMID: 35321239 Free PMC article. Review. - Altered Mitochondrial Protein Homeostasis and Proteinopathies.
Jishi A, Qi X. Jishi A, et al. Front Mol Neurosci. 2022 Apr 27;15:867935. doi: 10.3389/fnmol.2022.867935. eCollection 2022. Front Mol Neurosci. 2022. PMID: 35571369 Free PMC article. Review. - Diminished OPA1 expression and impaired mitochondrial morphology and homeostasis in Aprataxin-deficient cells.
Zheng J, Croteau DL, Bohr VA, Akbari M. Zheng J, et al. Nucleic Acids Res. 2019 May 7;47(8):4086-4110. doi: 10.1093/nar/gkz083. Nucleic Acids Res. 2019. PMID: 30986824 Free PMC article.
References
- Selkoe D.J. (2001) Alzheimer's disease: genes, proteins, and therapy. Physiol Rev, 81, 741–766. - PubMed
- Reddy P.H., Tripathi R., Troung Q., Tirumala K., Reddy T.P., Anekonda V., Shirendeb U.P., Calkins M.J., Reddy A.P., Mao P., et al. (2012) Abnormal mitochondrial dynamics and synaptic degeneration as early events in Alzheimer's disease: implications to mitochondria-targeted antioxidant therapeutics. Biochim. Biophys. Acta, 1822, 639–649. - PMC - PubMed
- Querfurth H.W., LaFerla F.M. (2010) Alzheimer's disease. N. Engl. J. Med., 362, 329–344. - PubMed
Publication types
MeSH terms
Substances
LinkOut - more resources
Full Text Sources
Other Literature Sources
Medical
Molecular Biology Databases
Research Materials
Miscellaneous


