Melatonin enhances sensitivity to fluorouracil in oesophageal squamous cell carcinoma through inhibition of Erk and Akt pathway - PubMed (original) (raw)
. 2016 Oct 27;7(10):e2432.
doi: 10.1038/cddis.2016.330.
Dong-Liang Chen 1 2, De-Shen Wang 1 2, Le-Zong Chen 1 2, Hai-Yu Mo 1, Hui Sheng 1, Long Bai 1 2, Qi-Nian Wu 1, Hong-En Yu 1 2, Dan Xie 1, Jing-Ping Yun 1 3, Zhao-Lei Zeng 1, Feng Wang 1 2, Huai-Qiang Ju 1, Rui-Hua Xu 1 2
Affiliations
- PMID: 27787516
- PMCID: PMC5133993
- DOI: 10.1038/cddis.2016.330
Melatonin enhances sensitivity to fluorouracil in oesophageal squamous cell carcinoma through inhibition of Erk and Akt pathway
Yun-Xin Lu et al. Cell Death Dis. 2016.
Abstract
Oesophageal squamous cell carcinoma (ESCC) is the sixth most common cause of cancer-associated death in the world and novel therapeutic alternatives are urgently warranted. In this study, we investigated the anti-tumour activity and underlying mechanisms of melatonin, an indoleamine compound secreted by the pineal gland as well as naturally occurring plant products, in ESCC cells and revealed that melatonin inhibited proliferation, migration, invasion and induced mitochondria-dependent apoptosis of ESCC cells in vitro and suppressed tumour growth in the subcutaneous mice model in vivo. Furthermore, after treatment with melatonin, the expressions of pMEK, pErk, pGSK3β and pAkt were significantly suppressed. In contrast, treatment of the conventional chemotherapeutic drug fluorouracil (5-Fu) resulted in activation of Erk and Akt, which could be reversed by co-treatment with melatonin. Importantly, melatonin effectively enhanced cytotoxicity of 5-Fu to ESCC in vitro and in vivo. Together, these results suggested that inhibition of Erk and Akt pathway by melatonin have an important role in sensitization of ESCC cells to 5-Fu. Combined 5-Fu and melatonin treatment may be appreciated as a useful approach for ESCC therapy that warrants further investigation.
Figures
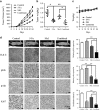
Figure 1
Melatonin inhibits proliferation, colony formation, migration and invasion of ESCC cells. (a) Viability of the indicated cells exposed to melatonin at different concentrations (72 h) was detected with MTS kit. (b) MTS assay of Eca109 (left panel) and KYSE150 (right panel) cells treated with melatonin (Control, 1 mM or 2 mM) at indicated time points. (c) Representative images (upper panel) and quantification (lower panel) of colony formation of the indicated cells cultured with melatonin at different concentrations for 14 days. (d) Representative images (left panel) and quantification (right panel) of colony formation of NE1 and NE3 cells cultured with melatonin at different concentrations for 14 days. Representative images and quantification of migration (e) and invasion (f) assay of the indicated cells treated with melatonin (Control, 1 mM or 2 mM) for 24 h. (g) Immunoblotting of CCND1, PCNA of cell extracts from Eca109 and KYSE150 cells after treated with indicated concentrations of melatonin for 24 h. _β_-Actin was used as loading control. Data in (a), (b), (c), (d), (e) and (f) are presented as mean±S.E. derived from three individual experiments with triplicate wells. **P<0.01 versus corresponding control. ns, no significant. Error bars, S.E.
Figure 2
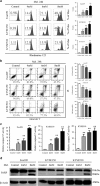
Melatonin induces mitochondria-dependent apoptosis of ESCC cells. (a) Representative images of mitochondrial transmembrane potential (left panel) and quantification (right panel) of cells negative for rhodamine staining in Eca109, KYSE150, KYSE510 cells treated with melatonin (Control, 4 mM, 6 mM) for 24 h. (b) Representative images of Annexin-V/PI assays (left panel) and quantification (right panel) of dual negative percentage in Eca109, KYSE150, KYSE510 cells treated with melatonin (Control, 4 mM, 6 mM, 8 mM) for 24 h. (c) Relative caspase 3/7 activity of Eca109, KYSE150 and KYSE510 cells treated with melatonin (Control, 4 mM, 6 mM, 8 mM) for 24 h. (d) Immunoblotting of PARP in the indicated cells treated with melatonin (Control, 4 mM, 8 mM) for 24 h. _β_-Actin was used as a loading control. Data in (a), (b) and (c) are presented as mean±S.E. derived from three individual experiments with triplicate wells. **P<0.01 versus corresponding control. Error bars, S.E.
Figure 3
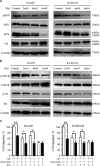
Melatonin inhibits MEK/Erk and GSK3β/Akt pathway in ESCC cells. (a) Immunoblotting of pMEK, MEK, pErk, Erk of cell extracts from Eca109 and KYSE150 cells after treated with indicated concentrations of melatonin for 24 h. GAPDH was used as a loading control. (b) Immunoblotting of pGSK3β, GSK3β, pAkt, Akt of cell extracts from Eca109 and KYSE150 cells after treated with indicated concentrations of melatonin for 24 h. GAPDH was used as a loading control. (c) Quantification of migration assays in Eca109 and KYSE150 cells treated with melatonin (1 mM), MEK inhibitor selumetinib (10 nM) or GSK3β inhibitor BIO (1 nM) for 24 h. Data in (c) are presented as mean±S.E. derived from three individual experiments with triplicate wells. *P<0.05 and **P<0.01 versus corresponding control. Error bars, S.E.
Figure 4
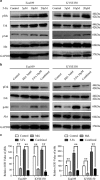
Melatonin inhibitis 5-Fu induced Erk and Akt phosphorylation. (a) Eca109 and KYSE150 cells were treated with 5-Fu (Control, 5 μM, 10 μM, 20 μM) for 24 h. Expression of pErk, Erk, pAkt, Akt was detected by western blot. GAPDH was used as a loading control. (b) Immunobloting of p-Erk, Erk, pAkt, Akt in Eca109 and KYSE150 cells treated with DMSO, melatonin (5 mM), 5-Fu (10 μM) or both agents for 24 h. GAPDH was used as a loading control. (c) Quantification analysis of pErk and pAkt expression in Eca109 and KYSE150 cells treated with DMSO, melatonin (5 mM), 5-Fu (10 μM) or both agents. Data in (c) are presented as mean±S.E. derived from three individual experiments with triplicate wells. **P<0.01 versus corresponding control. Error bars, S.E.
Figure 5
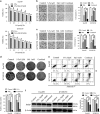
Synergistic effects between melatonin and 5-Fu in ESCC cells in vitro. (a) Cell viability of Eca109 (upper panel) and KYSE150 (lower panel) cells treated with 5-Fu alone or combined with melatonin (0.5 mM) at indicated concentrations was detected by MTS. (b) Representative images (left panel) and quantification (right panel) of migration assays in Eca109 and KYSE150 cells treated with 5-Fu (1 μM) and melatonin (1 mM) for 24 h. (c) Representative images (left panel) and quantification (right panel) of invasion assays in the indicated cells treated with 5-Fu (1 μM) and melatonin (1 mM) for 24 h. (d) Representative images (upper panel) and quantification (lower panel) of colony formation in Eca109 and KYSE150 cells treated with 5-Fu (0.5 μM) and melatonin (1 mM) for 14 days. (e) Representative images (upper panel) and quantification (lower panel) of Annexin-V/PI assays in the indicated cells treated with 5-Fu (10 μM) and melatonin (6 mM) for 24 h. (f) Immunoblotting of PARP in Eca109 and KYSE150 cells treated with 5-Fu (10 μM) and melatonin (6 mM) for 24 h. _β_-Actin was used as a loading control. Data in (a), (b), (c), (d) and (e) are presented as mean±S.E. derived from three individual experiments with triplicate wells. *P<0.05 and **P<0.01 versus corresponding control. Error bars, S.E.
Figure 6
Melatonin enhance sensitivity to 5-Fu in ESCC cells in vivo. (a) Eca109 (1 × 10⁶/mouse) cells were subcutaneously inoculated into the dorsal flank of nude mice before they were treated with PBS, 5-Fu (20 mg/kg, twice per week), melatonin (20 mg/kg, once per day), or 5-Fu combined with melatonin. Tumour volumes were measured at indicated days. Data are shown as mean±S.E. of six mice in each group. (b) Excised tumour weight from the four separate groups was recorded. (c) Weight of the mice was recorded. (d) Left panel: representative hematein-eosin (H&E) and immunohistochemistry staining of pErk, pAkt, and Ki67 from tumour sections. Scale bar: 50 μm. Right panel: quantification of pErk, pAkt and Ki67 immunoreactivity in tumour sections. Data in (a), (b), (c) and (d) are presented as mean±S.E. (_n_=6). *P<0.05 and **P<0.01 versus corresponding control. Error bars, S.E.
Similar articles
- Melatonin synergizes the chemotherapeutic effect of 5-fluorouracil in colon cancer by suppressing PI3K/AKT and NF-κB/iNOS signaling pathways.
Gao Y, Xiao X, Zhang C, Yu W, Guo W, Zhang Z, Li Z, Feng X, Hao J, Zhang K, Xiao B, Chen M, Huang W, Xiong S, Wu X, Deng W. Gao Y, et al. J Pineal Res. 2017 Mar;62(2). doi: 10.1111/jpi.12380. Epub 2016 Dec 24. J Pineal Res. 2017. PMID: 27865009 - Ivermectin suppresses tumour growth and metastasis through degradation of PAK1 in oesophageal squamous cell carcinoma.
Chen L, Bi S, Wei Q, Zhao Z, Wang C, Xie S. Chen L, et al. J Cell Mol Med. 2020 May;24(9):5387-5401. doi: 10.1111/jcmm.15195. Epub 2020 Mar 31. J Cell Mol Med. 2020. PMID: 32237037 Free PMC article. - Ursolic Acid Accelerates Paclitaxel-Induced Cell Death in Esophageal Cancer Cells by Suppressing Akt/FOXM1 Signaling Cascade.
Meng RY, Jin H, Nguyen TV, Chai OH, Park BH, Kim SM. Meng RY, et al. Int J Mol Sci. 2021 Oct 25;22(21):11486. doi: 10.3390/ijms222111486. Int J Mol Sci. 2021. PMID: 34768915 Free PMC article. - Identification of PTK6, via RNA sequencing analysis, as a suppressor of esophageal squamous cell carcinoma.
Ma S, Bao JYJ, Kwan PS, Chan YP, Tong CM, Fu L, Zhang N, Tong AHY, Qin YR, Tsao SW, Chan KW, Lok S, Guan XY. Ma S, et al. Gastroenterology. 2012 Sep;143(3):675-686.e12. doi: 10.1053/j.gastro.2012.06.007. Epub 2012 Jun 13. Gastroenterology. 2012. PMID: 22705009 - [Roles of targeting Ras/Raf/MEK/ERK signaling pathways in the treatment of esophageal carcinoma].
Chang YS, Liu JC, Fu HQ, Yu BT, Zou SB, Wu QC, Wan L. Chang YS, et al. Yao Xue Xue Bao. 2013 May;48(5):635-41. Yao Xue Xue Bao. 2013. PMID: 23888683 Review. Chinese.
Cited by
- Melatonin suppresses thyroid cancer growth and overcomes radioresistance via inhibition of p65 phosphorylation and induction of ROS.
Zou ZW, Liu T, Li Y, Chen P, Peng X, Ma C, Zhang WJ, Li PD. Zou ZW, et al. Redox Biol. 2018 Jun;16:226-236. doi: 10.1016/j.redox.2018.02.025. Epub 2018 Mar 1. Redox Biol. 2018. PMID: 29525603 Free PMC article. - Melatonin inhibiting the survival of human gastric cancer cells under ER stress involving autophagy and Ras-Raf-MAPK signalling.
Huang Y, Yuan K, Tang M, Yue J, Bao L, Wu S, Zhang Y, Li Y, Wang Y, Ou X, Gou J, Zhao Q, Yuan L. Huang Y, et al. J Cell Mol Med. 2021 Feb;25(3):1480-1492. doi: 10.1111/jcmm.16237. Epub 2020 Dec 25. J Cell Mol Med. 2021. PMID: 33369155 Free PMC article. - Pharmacological Inhibition of TFF3 Enhances Sensitivity of CMS4 Colorectal Carcinoma to 5-Fluorouracil through Inhibition of p44/42 MAPK.
Chen RM, Chiou YS, Chong QY, Poh HM, Tan TZ, Zhang MY, Ma L, Zhu T, Pandey V, Basappa, Kumar AP, Lobie PE. Chen RM, et al. Int J Mol Sci. 2019 Dec 9;20(24):6215. doi: 10.3390/ijms20246215. Int J Mol Sci. 2019. PMID: 31835445 Free PMC article. - Melatonin Analogue Antiproliferative and Cytotoxic Effects on Human Prostate Cancer Cells.
Calastretti A, Gatti G, Lucini V, Dugnani S, Canti G, Scaglione F, Bevilacqua A. Calastretti A, et al. Int J Mol Sci. 2018 May 18;19(5):1505. doi: 10.3390/ijms19051505. Int J Mol Sci. 2018. PMID: 29783631 Free PMC article. - Melatonin and Hippo Pathway: Is There Existing Cross-Talk?
Lo Sardo F, Muti P, Blandino G, Strano S. Lo Sardo F, et al. Int J Mol Sci. 2017 Sep 6;18(9):1913. doi: 10.3390/ijms18091913. Int J Mol Sci. 2017. PMID: 28878191 Free PMC article.
References
- Rustgi AK, El-Serag HB. Esophageal carcinoma. N Engl J Med 2014; 371: 2499–2509. - PubMed
- Kamangar F, Dores GM, Anderson WF. Patterns of cancer incidence, mortality, and prevalence across five continents: defining priorities to reduce cancer disparities in different geographic regions of the world. J Clin Oncol: Official Journal of the American Society of Clinical Oncology 2006; 24: 2137–2150. - PubMed
- Ohashi S, Miyamoto S, Kikuchi O, Goto T, Amanuma Y, Muto M. Recent advances from basic and clinical studies of esophageal squamous cell carcinoma. Gastroenterology 2015; 149: 1700–1715. - PubMed
- Pennathur A, Gibson MK, Jobe BA, Luketich JD. Oesophageal carcinoma. Lancet 2013; 381: 400–412. - PubMed
MeSH terms
Substances
LinkOut - more resources
Full Text Sources
Other Literature Sources
Medical
Miscellaneous

