Antibiotics impair murine hematopoiesis by depleting the intestinal microbiota - PubMed (original) (raw)
Antibiotics impair murine hematopoiesis by depleting the intestinal microbiota
Kamilla S Josefsdottir et al. Blood. 2017.
Abstract
Bone marrow suppression is an adverse effect associated with many antibiotics, especially when administered for prolonged treatment courses. Recent advances in our understanding of steady-state hematopoiesis have allowed us to explore the effects of antibiotics on hematopoietic progenitors in detail using a murine model. Antibiotic-treated mice exhibited anemia, thrombocytosis, and leukopenia, with pronounced pan-lymphopenia as demonstrated by flow cytometric analysis of peripheral blood. Bone marrow progenitor analysis revealed depletion of hematopoietic stem cells and multipotent progenitors across all subtypes. Granulocytes and B cells were also diminished in the bone marrow, whereas the number of CD8+ T cells increased. Reductions in progenitor activity were not observed when cells were directly incubated with antibiotics, suggesting that these effects are indirect. Hematopoietic changes were associated with a significant contraction of the fecal microbiome and were partially rescued by fecal microbiota transfer. Further, mice raised in germ-free conditions had hematopoietic abnormalities similar to those seen in antibiotic-treated mice, and antibiotic therapy of germ-free mice caused no additional abnormalities. The effects of antibiotics were phenocopied in Stat1-deficient mice, with no additional suppression by antibiotics in these mice. We conclude that microbiome depletion as a result of broad-spectrum antibiotic treatment disrupts basal Stat1 signaling and alters T-cell homeostasis, leading to impaired progenitor maintenance and granulocyte maturation. Methods to preserve the microbiome may reduce the incidence of antibiotic-associated bone marrow suppression.
© 2017 by The American Society of Hematology.
Figures
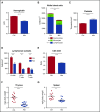
Figure 1.
Peripheral blood counts are suppressed and lymphoid organs diminished with antibiotic therapy. (A) Hemoglobin, (B) white blood cell count and differential, and (C) platelet counts were determined for control (Ctrl) vs antibiotic-treated (Abx) mice using an automated hematologic cell counter. (D) Lymphocyte subsets and (E) CD4:CD8 ratio in peripheral blood for control vs antibiotic-treated mice were determined by flow cytometry. (F) Thymi and (G) spleens from control vs antibiotic-treated mice were weighed. Results are compiled from 3 independent experiments (n = 9-14 per group). Graphs show mean + standard error of the mean (SEM). Statistical significance was determined by Student t test. ns, not significant; *P < .05, **P < .01, ***P < .001, ****P < .0001.
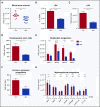
Figure 2.
WBM counts are suppressed and lineage balance is shifted with antibiotic therapy. (A) Bone marrow cells were counted on a hemocytometer in control (Ctrl) vs antibiotic-treated (Abx) mice. (B-G) Progenitor populations were quantified by flow cytometry in controls vs antibiotic-treated mice. (B) The percentage of total primitive progenitors (LSK) was determined by flow cytometry. Absolute numbers of (C) LSK progenitors, (D) hematopoietic stem cells, and (E) multipotent progenitor subsets, (F) common lymphoid progenitors, and (G) committed myeloid progenitor subsets are shown. Results are compiled from 4 independent experiments (n = 9-17 per group). Graphs show mean + SEM. Statistical significance was determined by Student t test or Mann-Whitney U test. *P < .05, **P < .01, ***P < .001, ****P < .0001.
Figure 3.
Granulocytes and B cells decrease in bone marrow upon antibiotic therapy, whereas T cells increase. Mature blood cells in bone marrow of control (Ctrl) vs antibiotic-treated (Abx) mice were quantified by flow cytometry, including (A) granulocytes, (B) B cells, (C) T cells, (D) CD4+ T cells, and (E) CD8+ T cells. (F) The CD4:CD8 ratio was calculated based on percentages of each population. (G) Regulatory T cells (Treg) were quantified by flow cytometry. Results are compiled from 2 to 4 independent experiments (n = 9-17 per group). Graphs show mean + SEM, with statistical significance determined by Student t test. *P < .05, ***P < .001.
Figure 4.
Antibiotics suppress cell cycle activity in primitive progenitor populations. (A-B) BrdU incorporation was determined for controls (Ctrl) vs antibiotic-treated (Abx) mice in (A) stem cells, (B) MPs, (C) LSK, and (D) primitive progenitor subsets in bone marrow. Results are compiled from 2 independent experiments (n = 9 per group per analysis). (E) Ki67 staining was determined by flow cytometry in the total LSK population. Results are compiled from 3 independent experiments, each performed on pooled marrow from 4 to 5 mice per group. Graphs show mean + SEM. Statistical significance was determined by Student t test. *P < .05, **P < .01.
Figure 5.
Antibiotic suppression of bone marrow progenitors is indirect and reversible. (A) Total colony formation was measured for WBM cells incubated for 9 days in methylcellulose in the presence (Abx) or absence (Ctrl) of test antibiotics (VNAM). Results compiled from 2 independent experiments. Graph shows mean + SEM. (B-E) Recovery of cell populations after withdrawal of antibiotics. Peripheral blood cell count recovery was assessed on an automated hematologic cell counter for antibiotic-treated (Abx) mice compared with controls (Ctrl), exemplified by (B) white blood cells and (C) platelets. Bone marrow recovery was assessed by performing (D) whole bone marrow counts and flow cytometry quantification of bone marrow populations, exemplified by (E) total LSK population, in antibiotic-treated mice compared with controls. Graphs show mean ± SEM trend over time (n = 3-4 per group per time point with each time point normalized to the mean of controls for that time point). Single experiment. (F) Sorted LSK cells from controls (Ctrl) and antibiotic-treated (Abx) mice were cocultured with OP9-DL1 cells and cytokines to support T-cell development. Flow cytometry was performed after 14 days in culture to quantify CD3+ cells representing lymphoid potential of the sorted LSK cells. The graph shows mean + SEM. (G-H) Controls (Ctrl) and antibiotic-treated (Abx) mice were treated with granulocyte-colony stimulating factor (G-CSF) to assess progenitor response to exogenous stimuli of myeloid differentiation. (G) Peripheral blood granulocyte and (H) total BM LSK response to GCSF. Results are compiled from 2 independent experiments (n = 4-8 per group per analysis). The graphs show mean + SEM. For all panels, statistical significance was determined by Student t test. *P < .05, **P < .01, ***P < .001, ****P < .0001.
Figure 6.
Depletion of fecal microbiota is a key factor in the development of antibiotic-associated bone marrow suppression. (A) Granulocytes and (B) CD4:CD8 ratio were quantified by flow cytometry for controls (Ctrl), antibiotic-treated mice (Abx), and mice treated with antibiotics plus fecal microbiota transfer (Rescue). Results are compiled from 2 independent experiments (n = 5-17 per group). (C) Granulocytes and (D) CD4:CD8 ratio were quantified by flow cytometry for controls and antibiotic-treated SPF and germ-free (GF) mice. Results are representative of a single experiment (n = 3-5 per group per experiment). The graphs show mean + SEM, statistical significance was determined by Student t test. *P < .05, **P < .01, ***P < .001.
Figure 7.
Stat1 KO mice exhibit no significant population shifts with antibiotic therapy. (A) Total LSK and (B) granulocytes from bone marrow were quantified by flow cytometry for WT, Stat1 KO (Stat1−/−), Nod2 KO (Nod2−/−), and MyD88 KO (MyD88−/−) with (+) and without (0) antibiotic therapy (VNAM). Results are pooled from 2 to 4 independent experiments (n = 4-25 per group per analysis). The graphs show mean + SEM, statistical significance was determined by Student t test. ns, not significant; *P < .05, **P < .01, ***P < .001. (C) Proposed model of antibiotic-associated bone marrow suppression.
Comment in
- Gut microbiota sustains hematopoiesis.
Theilgaard-Mönch K. Theilgaard-Mönch K. Blood. 2017 Feb 9;129(6):662-663. doi: 10.1182/blood-2016-12-754481. Blood. 2017. PMID: 28183744 No abstract available.
Similar articles
- Endothelial Cell-Selective Adhesion Molecule Expression in Hematopoietic Stem/Progenitor Cells Is Essential for Erythropoiesis Recovery after Bone Marrow Injury.
Sudo T, Yokota T, Okuzaki D, Ueda T, Ichii M, Ishibashi T, Isono T, Habuchi Y, Oritani K, Kanakura Y. Sudo T, et al. PLoS One. 2016 Apr 25;11(4):e0154189. doi: 10.1371/journal.pone.0154189. eCollection 2016. PLoS One. 2016. PMID: 27111450 Free PMC article. - Hematopoietic abnormalities in mice deficient in gp130-mediated STAT signaling.
Jenkins BJ, Quilici C, Roberts AW, Grail D, Dunn AR, Ernst M. Jenkins BJ, et al. Exp Hematol. 2002 Nov;30(11):1248-56. doi: 10.1016/s0301-472x(02)00929-3. Exp Hematol. 2002. PMID: 12423677 - c-Myc-mediated control of cell fate in megakaryocyte-erythrocyte progenitors.
Guo Y, Niu C, Breslin P, Tang M, Zhang S, Wei W, Kini AR, Paner GP, Alkan S, Morris SW, Diaz M, Stiff PJ, Zhang J. Guo Y, et al. Blood. 2009 Sep 3;114(10):2097-106. doi: 10.1182/blood-2009-01-197947. Epub 2009 Apr 16. Blood. 2009. PMID: 19372257 Free PMC article. - Hematopoiesis and the bacterial microbiome.
Yan H, Baldridge MT, King KY. Yan H, et al. Blood. 2018 Aug 9;132(6):559-564. doi: 10.1182/blood-2018-02-832519. Epub 2018 May 31. Blood. 2018. PMID: 29853538 Free PMC article. Review. - Cellular and Molecular Mechanisms of Environmental Pollutants on Hematopoiesis.
Scharf P, Broering MF, Oliveira da Rocha GH, Farsky SHP. Scharf P, et al. Int J Mol Sci. 2020 Sep 23;21(19):6996. doi: 10.3390/ijms21196996. Int J Mol Sci. 2020. PMID: 32977499 Free PMC article. Review.
Cited by
- Chemoradiation-Related Lymphopenia and Its Association with Survival in Patients with Squamous Cell Carcinoma of the Anal Canal.
Lee G, Kim DW, Muralidhar V, Mitra D, Horick NK, Eyler CE, Hong TS, Drapek LC, Allen JN, Blaszkowsky LS, Giantonio B, Parikh AR, Ryan DP, Clark JW, Wo JY. Lee G, et al. Oncologist. 2020 Dec;25(12):1015-1022. doi: 10.1634/theoncologist.2019-0759. Epub 2020 Sep 12. Oncologist. 2020. PMID: 32827337 Free PMC article. - Antibiotic-related gut dysbiosis induces lung immunodepression and worsens lung infection in mice.
Dessein R, Bauduin M, Grandjean T, Le Guern R, Figeac M, Beury D, Faure K, Faveeuw C, Guery B, Gosset P, Kipnis E. Dessein R, et al. Crit Care. 2020 Oct 15;24(1):611. doi: 10.1186/s13054-020-03320-8. Crit Care. 2020. PMID: 33076936 Free PMC article. - Clonal hematopoiesis: Mutation-specific adaptation to environmental change.
Florez MA, Tran BT, Wathan TK, DeGregori J, Pietras EM, King KY. Florez MA, et al. Cell Stem Cell. 2022 Jun 2;29(6):882-904. doi: 10.1016/j.stem.2022.05.006. Cell Stem Cell. 2022. PMID: 35659875 Free PMC article. Review. - The gut microbiota and the brain-gut-kidney axis in hypertension and chronic kidney disease.
Yang T, Richards EM, Pepine CJ, Raizada MK. Yang T, et al. Nat Rev Nephrol. 2018 Jul;14(7):442-456. doi: 10.1038/s41581-018-0018-2. Nat Rev Nephrol. 2018. PMID: 29760448 Free PMC article. Review. - Developmental Programming of the Fetal Immune System by Maternal Western-Style Diet: Mechanisms and Implications for Disease Pathways in the Offspring.
Nelson BN, Friedman JE. Nelson BN, et al. Int J Mol Sci. 2024 May 29;25(11):5951. doi: 10.3390/ijms25115951. Int J Mol Sci. 2024. PMID: 38892139 Free PMC article. Review.
References
- Olaison L, Belin L, Hogevik H, Alestig K. Incidence of beta-lactam-induced delayed hypersensitivity and neutropenia during treatment of infective endocarditis. Arch Intern Med. 1999;159(6):607-615. - PubMed
- Neftel KA, Wälti M, Spengler H, et al. . Neutropenia after penicillins: toxic or immune-mediated? Klin Wochenschr. 1981;59(16):877-888. - PubMed
- Shah I, Kumar KS, Lerner AM. Agranulocytosis associated with chronic oral administration of cloxacillin for suppression of staphylococcal osteomyelitis. Am J Hematol. 1982;12(2):203-206. - PubMed
- Neftel KA, Hauser SP, Müller MR. Inhibition of granulopoiesis in vivo and in vitro by beta-lactam antibiotics. J Infect Dis. 1985;152(1):90-98. - PubMed
Publication types
MeSH terms
Substances
Grants and funding
- U19 AI109725/AI/NIAID NIH HHS/United States
- R01 AI141716/AI/NIAID NIH HHS/United States
- T32 CA009547/CA/NCI NIH HHS/United States
- P30 CA125123/CA/NCI NIH HHS/United States
- P30 AI036211/AI/NIAID NIH HHS/United States
- S10 RR024574/RR/NCRR NIH HHS/United States
LinkOut - more resources
Full Text Sources
Other Literature Sources
Medical
Molecular Biology Databases
Research Materials
Miscellaneous


