The Hippo kinases LATS1 and 2 control human breast cell fate via crosstalk with ERα - PubMed (original) (raw)
. 2017 Jan 26;541(7638):541-545.
doi: 10.1038/nature20829. Epub 2017 Jan 9.
Stephan Duss 1, Sungeun Kim 2, Joana Pinto Couto 1 3, Heike Brinkhaus 1, Shany Koren 1 3, Duvini De Silva 1 3, Kirsten D Mertz 4, Daniela Kaup 4, Zsuzsanna Varga 5, Hans Voshol 6, Alexandra Vissieres 6, Cedric Leroy 1 6, Tim Roloff 1, Michael B Stadler 1 7, Christina H Scheel 8, Loren J Miraglia 2, Anthony P Orth 2, Ghislain M C Bonamy 2, Venkateshwar A Reddy 2, Mohamed Bentires-Alj 1 3
Affiliations
- PMID: 28068668
- PMCID: PMC6726477
- DOI: 10.1038/nature20829
The Hippo kinases LATS1 and 2 control human breast cell fate via crosstalk with ERα
Adrian Britschgi et al. Nature. 2017.
Abstract
Cell fate perturbations underlie many human diseases, including breast cancer. Unfortunately, the mechanisms by which breast cell fate are regulated are largely unknown. The mammary gland epithelium consists of differentiated luminal epithelial and basal myoepithelial cells, as well as undifferentiated stem cells and more restricted progenitors. Breast cancer originates from this epithelium, but the molecular mechanisms that underlie breast epithelial hierarchy remain ill-defined. Here, we use a high-content confocal image-based short hairpin RNA screen to identify tumour suppressors that regulate breast cell fate in primary human breast epithelial cells. We show that ablation of the large tumour suppressor kinases (LATS) 1 and 2 (refs 5, 6), which are part of the Hippo pathway, promotes the luminal phenotype and increases the number of bipotent and luminal progenitors, the proposed cells-of-origin of most human breast cancers. Mechanistically, we have identified a direct interaction between Hippo and oestrogen receptor-α (ERα) signalling. In the presence of LATS, ERα was targeted for ubiquitination and Ddb1-cullin4-associated-factor 1 (DCAF1)-dependent proteasomal degradation. Absence of LATS stabilized ERα and the Hippo effectors YAP and TAZ (hereafter YAP/TAZ), which together control breast cell fate through intrinsic and paracrine mechanisms. Our findings reveal a non-canonical (that is, YAP/TAZ-independent) effect of LATS in the regulation of human breast cell fate.
Conflict of interest statement
Competing financial interests
J.P.C, D.D.S., K.D.M., D.K., Z.V., T.R., M.B.S., S.K., C.H.S. and M.B.-A. declare no competing financial interests. A.B., S.D., and H.B. are employees of Roche Pharma AG. S.K. is an employee of Amgen. H.V., A.V., L.M., A.P.O. and G.M.C.B. are employees of Novartis Pharma AG. C.L. is an employee of Actelion. V.A.R. is a full-time employee of Pfizer.
Figures
Extended Data Figure 1. Inhibition of LATS increases sphere formation and the fractions of progenitor and luminal cells.
a, Outline of the screen to assess effects of the inhibition of tumor suppressor genes on PHBEC cell fate. b, Representative immunofluorescence images of PHBEC shNT, shLATS1 and shLATS2 spheres stained for K14 (red) and K19 (green). Scale bars = 50 µm. c, Upper panel: Bar graphs showing fractions of K14+/K19+ (left axis) and curve showing the ratio of K19+ to K14+ (right axis) cells upon inhibition of tumor suppressor genes; the top 50 individual shRNAs are shown. shRNAs targeting components of the Hippo-pathway are indicated by red arrows. Lower panel: Bar graphs representing fractions of K14+, K19+ and K14+K19+ positive cells in spheres. Data are means ± s.d. (n = 5 single shRNAs, 4 er), *P<0.05. d, Inhibition of Lats increases sphere formation in mouse primary mammary epithelial cells (MECs). Immunoblots (upper panel) and bar graph (lower panel) showing sphere formation of shNT and shLats cells. Data are means ± s.d. (n = 25 pooled mice, 6 er), *P<0.05. e, Representative immunofluorescence images of PHBEC shNT and shLATS1+2 colonies stained for K14 (red) and K19 (green). Scale bars = 150 µm. f, Knockdown of LATS enhances sphere formation in MCF10A cells. Immunoblots (left panel) and bar graph (right panel) showing sphere formation of shNT and shLATS cells cultured in M5 medium. Data are means ± s.d. (n = 6 er), *P <0.05, **P <0.01. g, The fraction of K14+ basal cells decreases while the fractions of K18+ luminal and K14+/K18+ progenitor cells increase upon removal of LATS. Representative immunofluorescent images of MCF10A shNT and shLATS colonies stained for K14 and K18 (left panel) and corresponding quantification (right panel). Data are means ± s.d. (n = 6 er), *P <0.05, **P <0.01. Scale bars = 150 µm. h, LATS knockdown increases K19 and decreases K14 mRNA expression in PHBECs and MCF10A cells. Bar graphs showing RQ-PCR analysis of shNT and shLATS. Data are means ± s.d. (n = 3 br each 2 er for PHBECs and 6 er for MCF10As) *P <0.05, **P <0.01. i, Re-expression of wt LATS1 rescues the effects of the knockdown in MCF10A cells. Immunoblots (left panel), representative immunofluorescence pictures (middle panel), and corresponding quantification of shNT and shLATS1C (targeting the 3´UTR) cells which were transfected with either a ctrl or a LATS1 wt cDNA expressing vectors. Data are means ± s.d. (n = 6 er). Scale bars = 200 µm.
Extended Data Figure 2. Inhibition of LATS promotes a luminal phenotype.
a, Heat map derived from hierarchical clustering of the 182 differentially expressed genes between shNT PHBECs (n = 5) and shLATS PHBECs (n = 6). Cut-off: Adjusted _P_-value <0.01, fold change >2.0, expression values >4. Arrows indicate canonical luminal genes as well as LATS1. b, Principal component analysis (PCA) of microarrays performed on shNT and shLATS PHBECs. shNT samples cluster separately from both shLATS1B and shLATS1+2 samples. c, Venn diagram analysis of differentially regulated genes at a low stringency cut-off of P <0.05, 2.0-fold change, expression values >4.0. Both LATS shRNAs show a high degree of overlap when compared to shNT samples and no genes were significantly differentially regulated between the two shRNAs. d, PHBEC shLATS expression profiles are significantly enriched in genes that are downregulated in normal basal breast cells. GSEA with shLATS-specific genes and a gene set of normal basal / stem breast cells. shNT PHBECs (n = 5), shLATS PHBECs (n = 6). Normalized enrichment score (NES) = 2.5, false discovery rate (FDR) <0.0001, P <0.0001. e, shLATS PHBECs express low levels of basal genes. Heatmaps with average normalized expression values of a subset of genes associated with normal basal breast cells. f, Removal of LATS imposes a luminal breast cancer signature to PHBECs. Left panel: GSEA with shLATS-specific genes derived from PHBECs and gene sets of ERα-positive (left) and luminal breast cancer samples (right). shNT PHBECs (n = 5), shLATS PHBECs (n = 6). NES = 2.29 (left) and 1.98 (right), FDR <0.0001, P <0.0001. Right panel: Clustered heatmap showing correlation coefficients between human breast cancer profiles and shNT or shLATS PHBECs. g, Graphs of ISMARA transcription factor activity analysis of shLATS (n = 6) versus shNT (n = 5) PHBECs showing high activity upon removal of LATS for CEBPβ (Z-value = 1.92, P <0.0001) and STAT5A,B (Z-value = 2.184, P <0.01). h, Bar graphs showing RQ-PCR analysis of shNT and shLATS PHBECs. mRNA levels of ERα and c-KIT as well as several canonical ERα target genes are higher in shLATS PHBECs. Data are means ± S.D. (n = 6 er, 2 tr), *P <0.05, **P <0.01. i, Bar graphs representing FACS analysis of PHBECs with LATS knockdown. Markers of luminal progenitors (c-KIT, ALDH activity) and luminal epithelial (EpCAM) cells increased and expression of the basal marker CD10 was reduced upon removal of LATS. Data are means ± s.d. (n = 6 er), *P <0.05.
Extended Data Figure 3. YAP/TAZ are stabilized in shLATS cells but do not impose their canonical signature.
a, YAP/TAZ signaling increases upon removal of LATS. Immunoblots (left panel) and RQ-PCR analysis (right panel) of shNT and shLATS PHBECs. Data are means ± s.d. (n = 6 er), *P <0.05. b, GSEA analysis of the shLATS profiles with datasets in which YAP was overexpressed (left and middle panel) or with a YAP/TAZ gene set derived from reactome.org (right panel). Left panel: NES = 0.84, FDR = 0.726, P = 0.726; middle panel: NES = 0.91, FDR = 0.58, P = 0.58; right panel: NES = 0.1.17, FDR = 0.251, P = 0.251. There was no enrichment of the shLATS PHBEC profile with the published YAP- or YAP/TAZ-driven gene set.
Extended Data Figure 4. LATS-depleted MCF10A cells recapitulate the phenotype of LATS-depleted PHBECs.
a, MCF10A cells lacking LATS are enriched for luminal gene signatures but not for YAP/TAZ-driven gene signatures. GSEA with shLATS MCF10A-specific genes and gene sets of PHBECs lacking LATS (left), luminal progenitor (middle) and mature luminal breast cells (right). Results from enrichment analyses with YAP/TAZ driven gene sets are shown in the table on the right. b, Markers of mature luminal and luminal progenitor cells increased upon removal of LATS, and canonical YAP/TAZ signaling was activated. Immunoblots of lysates (left panel) and bar graphs showing RQ-PCR measurements (middle), and FACS analysis (right) of MCF10A shNT and shLATS cells cultured in standard growth medium (Std) or M5 medium for 4 days. Data are means ± s.d. (n = 6 er, 2 tr), *P <0.05, **P <0.01. c, Left: Representative microscopic bright-field pictures of shNT and shLATS MCF10A cells cultured in M5 medium showing a switch to a cobblestone-like cell morphology in shLATS cells. Scale bars = 150 µm. Right: Bar graphs showing RQ-PCR analysis of MCF10A shNT and shLATS cells. Luminal markers are upregulated, mesenchymal markers are downregulated in MCF10A shLATS cells. Data are means ± s.d. (n = 6 er, 2 tr), *P <0.05.
Extended Data Figure 5. YAP/TAZ and ERα–signaling promote sphere formation and breast luminal phenotype in LATS-depleted cells via intrinsic and paracrine mechanisms.
a, Cells with enforced expression of both YAP/TAZ and ERα phenocopy shLATS cells. Left panel: Immunoblots of shNT, shNT with enforced YAP/TAZ and/or ERα expression and shLATS MCF10A cells. PCA plots (middle) and heat map (right) derived from hierarchical clustering of the differentially expressed genes between shNT, shNT YAP/TAZ, shNT ERα, shNT ERα/YAP/TAZ, shLATS1B and shLATS1+2 MCF10A cells (n = 3 er). Cut-off: Adjusted _P_-value <0.01, fold change >2.0, expression values >4. b, Table with GSEA showing that cells with exogenous YAP/TAZ expression are enriched for YAP/TAZ signatures. c, Immunoblots representing siRNA-mediated depletion of YAP/TAZ in MCF10A shNT and shLATS cells (left panel). Inhibition of YAP/TAZ only partially blocks the induction of luminal markers (RQ-PCR, right panel), but reverts enhanced sphere formation upon LATS knockdown (bar graphs, middle panel). Data are means ± s.d. (n = 8 er), *P <0.05. d, Immunoblots representing siRNA-mediated depletion of ERα in MCF10A shNT and shLATS cells (left panel). Inhibition of ERα blocks the induction of luminal markers (RQ-PCR, right panel) but only slightly reduces the enhanced sphere formation seen upon LATS knockdown (middle panel). Data are means ± s.d. (n = 8 er), *P <0.05. e, Inhibition of ERα by 1 µM 4-Hydroxytamoxifen (4-OHT) in PHBECs blocks the induction of luminal markers (RQ-PCR, left panel) but only slightly reduces the enhanced sphere formation seen upon LATS knockdown (right panel). Data are means ± s.d. (left panel n = 3 er, 2 tr; right panel n = 6 er). f, Immunoblots of MCF10A shNT and shLATS cells in which YAP, TAZ and ERα were depleted by siRNA. g, YAP/TAZ and ERα interact in the upregulation of AREG in cells lacking LATS. Left panel: Bar graphs showing ELISA measurements in PHBECs and MCF10A shNT and shLATS cells. Data are means ± s.d. (n = 8 er), *P <0.05. Right panel: Bar graphs representing RQ-PCR results for MCF10A shNT and shLATS cells in which YAP/TAZ and/or ERα were depleted by siRNA. Data are means ± s.d. (n = 6 er, 2 tr), *P <0.05. h, Left panel: Graphs representing sphere formation of shNT and shLATS MCF10A cells upon addition of increasing amounts of an AREG-blocking antibody (AB) or an IgG control. Data are means (n = 6 er), IC50 values shNT = 8.2 µg, shLATS1 = 4.4 µg (P <0.05), shLATS_2 = 2.6 µg (P <0.05), shLATS_3 = 2.7 µg (P <0.05). Right panel: Bar graphs showing sphere formation of MCF10A cells supplemented with conditioned medium derived from either shNT or shLATS MCF10A 3D cultures. Addition of anti-AREG blocking antibody (2.5 µg/ml) reverted the increase in sphere formation capacity conferred by conditioned medium from shLATS cultures. Data are means ± s.d. (n = 6 er), *P <0.05. i, Graphical summary.
Extended Data Figure 6. Removal of LATS increases proliferation and favors survival of ERα-positive cells.
a, Knockdown of LATS induces markers of proliferation (immunoblots, upper panel) and increases cell numbers of PHBECs (cell counts, lower panel). Data are means ± s.d. (n = 5 er, 2 tr), *P <0.05, **P <0.01. b, Ablation of LATS increases colony forming capacity of PHBECs. Bar graphs representing colony counts of PHBECs in which LATS was knocked down. Data are means ± s.d. (n = 8 er), *P <0.05. c, Knockdown of LATS increases the expression of markers of proliferation. Immunoblots of MCF10A cells with or without LATS cultured in M5 medium. d, Knockdown of LATS increases cell number. Graph representing cell counts of MCF10A shNT and shLATS cells cultured in M5 medium. Data are means (n = 8 er), *P <0.05, **P <0.01. e, shLATS cells in suspension retain high levels of YAP/TAZ and are partially anoikis-resistant. Immunoblots of MCF10A shNT and shLATS cells cultured in suspension for the indicated time points (left panel). Bar graph representing FACS analysis of AnnexinV+/PI+ MCF10A cells after 36 h of suspension culture (right panel). Data are means ± s.d. (n = 8 er), *P <0.05. f, Removal of LATS results in a survival advantage for ERα+ cells. Scheme of the setup of the competition experiment (left panel). Immunoblots of lysates from MCF10A shNT and shLATS cells after lentiviral infection with GFP and ERα or the empty vector control at the beginning of the experiment. MOIs for ERα were adjusted between shNT and shLATS cell lines to assure equal expression of ERα (middle panel). Bar graphs representing FACS analysis of GFP+ cells after 5 days of suspension culture (right panel). Data are means ± s.d. (n = 6 er), *P <0.05, **P <0.01. g, Inhibition of YAP/TAZ partially reverts the competitive advantage of ERα+ shLATS cells. The experimental setup was as in f, but in addition YAP/TAZ were inhibited by siRNA. Immunoblots of lysates of MCF10A shNT and shLATS cells at the beginning of the experiment, infected with GFP and ERα, and transfected with siRNAs against YAP/TAZ, and a non-targeting control (left panel). Bar graph of FACS analysis of GFP+ cells after 5 days of suspension culture (right panel). Data are means ± s.d. (n = 6 er), *P <0.05.
Extended Data Figure 7. Removal of LATS increases the luminal progenitor and mature luminal cell phenotype.
a, LATS is mostly nuclear in basal cells and cytoplasmic in luminal cells. Representative pictures of LATS1 staining (IHC) in normal human breast (left, scale bars = 100 µm), of PHBECs stained (IF) with K19, K14 and LATS1 (middle, scale bars = 150 µm), and of a human breast tumor TMA (right). Bar graphs showing quantification of LATS nuclear and cytoplasmic staining by IF on PHBECs (middle). Data are means ± s.d. (n = 8), *P<0.05. Box plots representing ERα-index of tumors characterized by cytoplasmic or nuclear LATS IHC staining (right). n = 471, P<0.0001. b, Bar graphs showing RQ-PCR analysis of sorted PHBEC subpopulations (n-fold over Stroma and mesenchymal cells (MSC)). Luminal markers are shown in blue, basal markers are shown in red. Data are means ± s.d. (n = 2 br with each 3 er). c, The fractions of mature luminal and luminal progenitor cells increase upon removal of LATS. Left panel: Representative scatter plots of cell-surface / intracellular FACS analysis of PHBECs shNT and shLATS stained with antibodies against c-KIT and ERα. Right panel: Bar graphs showing FACS analysis of shNT and shLATS PHBECs stained with antibodies against c-KIT and ERα. Data are means ± s.d. (n = 2 br with each 3 er), *P <0.05. d, Representative immunofluorescence pictures of colonies formed by breast cell subpopulations. Scale bars = 150 µm. e, YAP/TAZ targets are highly expressed in basal cells. Bar graphs showing RQ-PCR analysis of sorted basal and c-KIT-positive luminal progenitor cells. Data are means ± s.d. (n = 2 br with each 3 er), *P <0.05. f, Sorted basal primary mouse mammary epithelial cells (MECs) acquire a luminal phenotype upon removal of Lats and removal of Lats enhances the luminal phenotype in sorted luminal MECs. Representative immunofluorescent pictures (left) and quantification of the colony phenotype of sorted basal (upper panel) and luminal (lower panel) MECs with and without Lats1 and 2 stained for K14 and K8/18. n = 20 pooled mice, basal shNT n = 46 colonies, basal shLats n = 23 colonies, luminal shNT n = 30 colonies, luminal shLats n = 20 colonies. Scale bars = 200 µm. g, Depletion of Lats in sorted primary MECs increases luminal mature and progenitor markers and decreases basal and mammary stem cell-related markers. Bar graphs showing RQ-PCR analysis, data are means ± s.d. (n = 20 mice pooled, 6 er). h, Cells lacking LATS exhibit a luminal progenitor-like phenotype when grown in 3D collagen gels. Left panel: Representative pictures of TDLU- and sphere-like structures formed by PHBECs on floating collagen. Scale bars = 200 µm. Right panel: Representative immunofluorescence confocal pictures of 3D structures formed by shNT and shLATS PHBECs grown on floating collagen gels, stained for basal (K14) and luminal (K18, E-cadherin) markers. Scale bar = 200 µm. i, Depletion of Lats in primary mouse mammary epithelial cells (MECs) increases luminal mature and progenitor markers and decreases basal and mammary stem cell-related markers. Bar graphs showing RQ-PCR analysis, data are means ± s.d. (n = 25 mice pooled, 6 er), *P <0.05. j, Graphical summary. Depletion of LATS expands luminal and bipotent progenitors and enhances differentiation along the luminal lineage at the expense of basal progenitors and basal cells. This results in a population of cells with high sphere forming capacity, low mammary repopulating activity, and a luminal phenotype.
Extended Data Figure 8. Removal of LATS stabilizes ERα protein.
a, Knockdown of LATS upregulates ERα in luminal breast cancer cells. Immunoblots of lysates of T47D shNT and shLATS cells treated for 6 h with 10 nM estrogen (E2) or ethanol (EtOH). b, Knockdown of LATS upregulates ERα target genes in luminal breast cancer cells. Bar graphs showing RQ-PCR analysis (right panel) of T47D shNT and shLATS cells treated as in (a). Data are means ± s.d. (n = 6 er), *P <0.05. c, Re-expression of the kinase-dead LATS1 mut almost fully rescues ERα-mediated effects of the knockdown in MCF10A cells, but not YAP/TAZ-mediated effects. Immunoblots (upper left panel), bar graphs representing sphere formation (upper right panel) and bar graphs showing RQ-PCR analysis of MCF10A cells with or without LATS cDNAs expressing LATS1 wt or mut sequences. Data are means ± s.d. (n = 6 er), *P <0.05. d, The ERα protein is stabilized in cells lacking LATS. Immunoblots of lysates from T47D shNT and shLATS cells that were treated with 10 µM of the protein translation inhibitor cycloheximide (CHX) and 10 nM of estrogen (E2) for 6 h. Quantification of ERα levels, normalized to loading controls ERK2 and β-ACTIN and expressed relative to the timepoint = 0, is provided as bar graphs below the immunoblots. Data are means ± s.d. (n = 6 er), *P <0.05. e, LATS1 triggers proteasome-dependent downregulation of ERα protein. Immunoblots of lysates from BT474 and MCF7 cells transfected with LATS1 wt cDNA and treated with 20 µM of the proteasome inhibitor MG132 for 6 h. f, Ubiquitination of ERα is reduced in shLATS cells. Immunoblots of MCF7 shNT and shLATS cell lysates subjected to ERα immunoprecipitation and immunoblotting for ubiquitin and ERα (IP: immunoprecipitation, WCL: whole cell lysate). g, LATS1-mediated ubiquitination of ERα is dependent on DCAF1. Immunoblots of lysates from MCF7 cells transfected with LATS1 wt cDNA and siDCAF1 which were subjected to ERα immunoprecipitation and immunoblotting for ubiquitin and ERα (IP: immunoprecipitation, WCL: whole cell lysate).
Extended Data Figure 9. LATS ablation reduces the efficacy of fulvestrant treatment.
a, LATS is downregulated in the majority of human breast cancer samples and cell lines. Immunoblots of PHBECs and primary human breast cancer samples (upper panel), MCF10A cells as well as basal (lower left panel) and luminal (lower right panel) breast cancer cell lines. b, shLATS reduces sensitivity to fulvestrant by preventing ERα degradation. Graphs showing colony areas of T47D (upper panel) and of MCF7 (lower panel) shNT and shLATS cell lines in response to fulvestrant and tamoxifen treatment. Data are means ± s.d. (n = 9 er), *P <0.05. c, shLATS tumors are partially resistant to fulvestrant. Tumor growth curves of T47D shNT- and shLATS-bearing animals treated with 2.5mg/25g of fulvestrant as indicated. Data are means ± s.d. (n = 5 br), *P <0.05. d, Low LATS expression is associated with poor outcome in patients treated with anti-estrogens but not in the tamoxifen-only treated subgroup. Kaplan-Meier analysis of relapse-free survival of n = 643 (left), n = 346 (middle), n = 489 (right) breast cancer patients.
Extended Data Figure 10. Graphical Summary.
Effects of LATS in luminal and basal cells. In luminal cells, LATS is highly expressed in the cytoplasm, where it triggers YAP/TAZ degradation. These cells express high levels of ERα and its target genes. In basal cells, LATS is highly expressed in the nucleus, allowing YAP/TAZ accumulation in the cytoplasm and their translocation to the nucleus, where they activate their targets. Upon depletion of LATS, YAP/TAZ are upregulated in luminal cells with the net results that both ERα and YAP/TAZ target genes are being transcribed. In basal cells, removal of LATS results in stabilization of ERα and the transcription of ERα target genes in addition to the already highly expressed YAP/TAZ target genes. Overall, this results in a cell population characterized by increases in the levels of luminal genes, in the number of luminal and bipotent progenitors, in sphere formation, and proliferation.
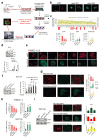
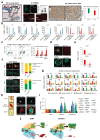
Figure 1. Ablation of LATS increases sphere formation and the fractions of progenitor and luminal cells.
a, Schematic and bar graph showing RSA parameters and average log-transformed _P_-values of the 30 most significant genes. Arrows indicate members of the Hippo pathway. b, Knockdown of LATS increases sphere formation over several passages. Immunoblots showing knockdown efficiency and bar graphs showing sphere formation of three different PHBECs. shNT: non-targeting shRNA control; shLATS1A, shLATS1B: shRNAs targeting LATS1; shLATS1+2: shRNA targeting LATS1 and LATS2. Data are means ± s.d. (n = 3 experimental replicates (er), 2 technical replicates (tr)). c, Inhibition of LATS decreases the fraction of basal cells and increases the fractions of luminal and double-positive cells. Representative immunofluorescence images (left panels) and quantifications (right panels) of PHBEC1 shNT and shLATS1+2 colonies stained with antibodies against K14 (red) and K19 (green). Data are means ± s.d. (n = 3 biological replicates (br), each 2 er and 2 tr), Scale bars = 50 µm. For source data of main figures see the supplementary information files. *P<0.05.
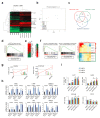
Figure 2. LATS depletion changes cell fate through activation of ERα and YAP/TAZ.
a, GSEA of shLATS PHBECs showing enrichment for luminal progenitor (left) and mature luminal (right) gene sets and correspondent heatmaps with average normalized expression values. Normalized enrichment scores (NES) are 2.28 and 1.9 and false discovery rates (FDR) are <0.0001, _P_<0.0001, respectively. **b,** Integrated System for Motif Activity Response Analysis (ISMARA) of shLATS PHBECs showing high ERα activity (_n_ = 5, Z-value 1.97, _P_ <0.001). **c,** Removal of LATS increases markers of luminal differentiated and luminal progenitor lineages. **d,** Simultaneous activation of ERα and YAP/TAZ signaling is required to phenocopy the transcriptional profile of shLATS cells. Scatterplots of whole transcriptome analysis of shNT, shNT with enforced YAP/TAZ and/or ERα expression, and shLATS in MCF10A cells. R, Spearman’s correlation coefficient. Cut-off for differentially regulated genes (in red): adjusted _P_-value <0.01, fold change >2.0, expression values >4, n = 3 er. e, Combined inhibition of YAP/TAZ and ERα fully reverts the phenotype of shLATS in MCF10A cells (sphere formation, left panel; RQ-PCR, right panel). Data are means ± s.d. (n = 6 er). *P<0.05.
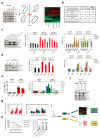
Figure 3. Different effects of LATS in luminal and basal breast cells.
a, FACS sorting scheme of breast epithelial cell subpopulations based on EpCAM and CD49f (left panel). Bar graphs showing increased sphere and colony formation upon LATS depletion in c-KIT+ luminal progenitors and c-KIT- mature luminal cells Data are means ± s.d. (n = 3 er, 2 tr). RQ-PCR analysis showing upregulation of mature luminal genes and YAP/TAZ targets in c-KIT+ cells, and upregulation of luminal progenitor genes in basal cells (right panel). Data are means ± s.d. (n = 2 br with each 3 er). *P<0.05. b, Basal cells acquire a luminal phenotype upon removal of LATS. Quantification of colony phenotypes formed by basal shNT and shLATS PHBECs based on K14/K19 expression. Data are means ± s.d. (n = 2 br with each 3 er, 2 tr). c, shLATS cells form 3D structures resembling the phenotype of a luminal progenitor-rich population of cells. Quantification of 3D structures formed by shLATS PHBECs in collagen gels. Data are means ± s.d. (n = 5 er). d, Representative pictures and table with number of outgrowths in cleared-fat-pad transplantation of shNT and shLATS MECs. Scale bars = 500 µm, Inf, infinity, MRU, mammary repopulating unit.
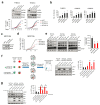
Figure 4. LATS targets ERα to ubiquitin-mediated proteasomal degradation via DCAF1.
a, Quantification of ESR1 mRNA (RQ-PCR) and ERα protein levels (immunoblotting) in PHBECs, MFC10A cells and MECs in the presence or absence of LATS. Data are means ± s.d. (n = 4 br, each 2 er), *P <0.05, **P<0.01. b, Downregulation of ERα is independent of LATS kinase activity. Immunoblots of cell lysates from three ERα+ cell lines transfected with LATS1 full-length wild type cDNA (wt) or a truncated, kinase-dead cDNA (mut; top scheme). c, Scatter plot of peptides interacting with ERα in the presence or absence of LATS as measured by quantitative proteomics in MCF7 cells. d, LATS deficiency reduces DCAF1/13-ERα interaction. Immunoblots of nuclear cell lysates (NCL) and of immunoprecipitations (IP) with anti-ERα or IgG ctrl antibodies. X: empty well. e, DCAF1 is necessary for LATS-mediated ERα degradation. Immunoblots of cells transfected with LATS wt and/or siRNA DCAF1. f, Scheme depicting the complex formed between LATS, DCAF1 and ERα that results in ERα degradation.
Comment in
- Cancer: a new role for non-canonical Hippo signaling.
Cooper J, Giancotti FG. Cooper J, et al. Cell Res. 2017 Apr;27(4):459-460. doi: 10.1038/cr.2017.27. Epub 2017 Feb 28. Cell Res. 2017. PMID: 28244491 Free PMC article.
Similar articles
- Hippo signalling maintains ER expression and ER+ breast cancer growth.
Ma S, Wu Z, Yang F, Zhang J, Johnson RL, Rosenfeld MG, Guan KL. Ma S, et al. Nature. 2021 Mar;591(7848):E1-E10. doi: 10.1038/s41586-020-03131-5. Epub 2021 Mar 3. Nature. 2021. PMID: 33658690 Free PMC article. No abstract available. - Deubiquitinating Enzyme USP9X Suppresses Tumor Growth via LATS Kinase and Core Components of the Hippo Pathway.
Toloczko A, Guo F, Yuen HF, Wen Q, Wood SA, Ong YS, Chan PY, Shaik AA, Gunaratne J, Dunne MJ, Hong W, Chan SW. Toloczko A, et al. Cancer Res. 2017 Sep 15;77(18):4921-4933. doi: 10.1158/0008-5472.CAN-16-3413. Epub 2017 Jul 18. Cancer Res. 2017. PMID: 28720576 Free PMC article. - Merlin/NF2 loss-driven tumorigenesis linked to CRL4(DCAF1)-mediated inhibition of the hippo pathway kinases Lats1 and 2 in the nucleus.
Li W, Cooper J, Zhou L, Yang C, Erdjument-Bromage H, Zagzag D, Snuderl M, Ladanyi M, Hanemann CO, Zhou P, Karajannis MA, Giancotti FG. Li W, et al. Cancer Cell. 2014 Jul 14;26(1):48-60. doi: 10.1016/j.ccr.2014.05.001. Cancer Cell. 2014. PMID: 25026211 Free PMC article. - [Regulation of differentiation of mesenchymal stem cells by the Hippo pathway effectors TAZ/YAP].
Men T, Piao SH, Teng CB. Men T, et al. Yi Chuan. 2013 Nov;35(11):1283-90. doi: 10.3724/sp.j.1005.2013.01283. Yi Chuan. 2013. PMID: 24579311 Review. Chinese. - The NDR/LATS protein kinases in immunology and cancer biology.
Sharif AAD, Hergovich A. Sharif AAD, et al. Semin Cancer Biol. 2018 Feb;48:104-114. doi: 10.1016/j.semcancer.2017.04.010. Epub 2017 Jun 1. Semin Cancer Biol. 2018. PMID: 28579171 Review.
Cited by
- The Role of the Hippo Pathway in Breast Cancer Carcinogenesis, Prognosis, and Treatment: A Systematic Review.
Kyriazoglou A, Liontos M, Zakopoulou R, Kaparelou M, Tsiara A, Papatheodoridi AM, Georgakopoulou R, Zagouri F. Kyriazoglou A, et al. Breast Care (Basel). 2021 Feb;16(1):6-15. doi: 10.1159/000507538. Epub 2020 May 12. Breast Care (Basel). 2021. PMID: 33716627 Free PMC article. Review. - The Hippo pathway in cancer: YAP/TAZ and TEAD as therapeutic targets in cancer.
Cunningham R, Hansen CG. Cunningham R, et al. Clin Sci (Lond). 2022 Feb 11;136(3):197-222. doi: 10.1042/CS20201474. Clin Sci (Lond). 2022. PMID: 35119068 Free PMC article. Review. - A CD146 FACS Protocol Enriches for Luminal Keratin 14/19 Double Positive Human Breast Progenitors.
Ísberg ÓG, Kim J, Fridriksdottir AJ, Morsing M, Timmermans-Wielenga V, Rønnov-Jessen L, Petersen OW, Villadsen R. Ísberg ÓG, et al. Sci Rep. 2019 Oct 16;9(1):14843. doi: 10.1038/s41598-019-50903-9. Sci Rep. 2019. PMID: 31619692 Free PMC article. - Norcantharidin reverses cisplatin resistance and inhibits the epithelial mesenchymal transition of human non‑small lung cancer cells by regulating the YAP pathway.
Jin D, Wu Y, Shao C, Gao Y, Wang D, Guo J. Jin D, et al. Oncol Rep. 2018 Aug;40(2):609-620. doi: 10.3892/or.2018.6486. Epub 2018 Jun 12. Oncol Rep. 2018. PMID: 29901163 Free PMC article. Retracted. - Nicotinamide N-methyltransferase sustains a core epigenetic program that promotes metastatic colonization in breast cancer.
Couto JP, Vulin M, Jehanno C, Coissieux MM, Hamelin B, Schmidt A, Ivanek R, Sethi A, Bräutigam K, Frei AL, Hager C, Manivannan M, Gómez-Miragaya J, Obradović MM, Varga Z, Koelzer VH, Mertz KD, Bentires-Alj M. Couto JP, et al. EMBO J. 2023 Jul 3;42(13):e112559. doi: 10.15252/embj.2022112559. Epub 2023 Jun 1. EMBO J. 2023. PMID: 37259596 Free PMC article.
References
- Howard BA, Gusterson BA. Human breast development. Journal of mammary gland biology and neoplasia. 2000;5:119–137. - PubMed
Publication types
MeSH terms
Substances
LinkOut - more resources
Full Text Sources
Other Literature Sources
Molecular Biology Databases
