The Putative Drp1 Inhibitor mdivi-1 Is a Reversible Mitochondrial Complex I Inhibitor that Modulates Reactive Oxygen Species - PubMed (original) (raw)
. 2017 Mar 27;40(6):583-594.e6.
doi: 10.1016/j.devcel.2017.02.020.
Pascaline Clerc 1, Brian A Roelofs 1, Andrew J Saladino 2, László Tretter 3, Vera Adam-Vizi 3, Edward Cherok 4, Ahmed Khalil 5, Nagendra Yadava 6, Shealinna X Ge 1, T Chase Francis 7, Nolan W Kennedy 8, Lora K Picton 9, Tanya Kumar 1, Sruti Uppuluri 1, Alexandrea M Miller 1, Kie Itoh 10, Mariusz Karbowski 4, Hiromi Sesaki 10, R Blake Hill 8, Brian M Polster 11
Affiliations
- PMID: 28350990
- PMCID: PMC5398851
- DOI: 10.1016/j.devcel.2017.02.020
The Putative Drp1 Inhibitor mdivi-1 Is a Reversible Mitochondrial Complex I Inhibitor that Modulates Reactive Oxygen Species
Evan A Bordt et al. Dev Cell. 2017.
Abstract
Mitochondrial fission mediated by the GTPase dynamin-related protein 1 (Drp1) is an attractive drug target in numerous maladies that range from heart disease to neurodegenerative disorders. The compound mdivi-1 is widely reported to inhibit Drp1-dependent fission, elongate mitochondria, and mitigate brain injury. Here, we show that mdivi-1 reversibly inhibits mitochondrial complex I-dependent O2 consumption and reverse electron transfer-mediated reactive oxygen species (ROS) production at concentrations (e.g., 50 μM) used to target mitochondrial fission. Respiratory inhibition is rescued by bypassing complex I using yeast NADH dehydrogenase Ndi1. Unexpectedly, respiratory impairment by mdivi-1 occurs without mitochondrial elongation, is not mimicked by Drp1 deletion, and is observed in Drp1-deficient fibroblasts. In addition, mdivi-1 poorly inhibits recombinant Drp1 GTPase activity (Ki > 1.2 mM). Overall, these results suggest that mdivi-1 is not a specific Drp1 inhibitor. The ability of mdivi-1 to reversibly inhibit complex I and modify mitochondrial ROS production may contribute to effects observed in disease models.
Keywords: bioenergetics; brain; fission; fragmentation; mitochondria; neuron; respiration; reverse electron transfer; succinate; superoxide.
Copyright © 2017 Elsevier Inc. All rights reserved.
Figures
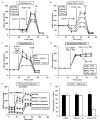
Figure 1. Mdivi-1 reversibly inhibits basal and maximal respiration at Complex I
(A) OCR traces for neurons or (B) COS-7 cells receiving mdivi-1 or DMSO vehicle (CTRL), FCCP (3 μM for neurons, 2 μM for COS-7) plus pyruvate (Pyr, 10 mM), and antimycin A (AA, 1 μM). Traces are mean ± SD from 3 wells and are representative of 4 independent experiments (2–3 wells each). (C) FCCP together with pyruvate or together with TMPD (0.4 mM) plus ascorbate (0.4 mM) were injected along with mdivi-1 (100 μM) or CTRL while measuring OCR. The Complex IV inhibitor azide (5 mM) was then injected. (D) Neurons were permeabilized by saponin (sap, 25 μg/ml), and OCR was stimulated by 1 mM ADP in the presence of pyruvate and malate (P/M, 5 mM each) or succinate (S, 5 mM) in the presence of rotenone (R, 0.5 μM). Mdivi-1 (50 μM) or vehicle control was then injected. (E) Neurons were treated with rotenone or mdivi-1 (50 μM) for 1 hr prior to OCR measurements. Rotenone or mdivi-1 was then either left on for the duration of the assay (“present”), or washed out and replaced with drug-free aCSF (“washout”). Following permeabilization by sap and addition of ADP with glutamate and malate (G/M, 5 mM each), 5 mM succinate was added. (F) Neurons or COS-7 cells were treated with DMSO or mdivi-1 (50 μM) for 1 or 5 hr. The drug was then washed out and maximal OCR was determined. See also Figure S1.
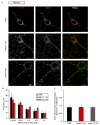
Figure 2. Mdivi-1 does not alter mitochondrial size in neuronal processes
(A) Representative immunofluorescence of Tom20 (red) and Drp1 (green) in neurons following treatment with DMSO vehicle (CTRL) or mdivi-1 (75 μM) for 1 or 5 hr (scale bars, 10 μm). Extrasomal Tom20 and Drp1 fluorescence is primarily localized to a meshwork of neuronal processes. (B) Frequency of binned mitochondrial areas for the treatments described in (A). (C) Pearson’s coefficient for Drp1 co-localized with mitochondrial Tom20 in neurons treated with CTRL or 75 μM mdivi-1. Results are mean ± SD, where ~800–1000 mitochondria were counted per treatment group per experiment, and 3 separate experiments were conducted. See also Figure S2.
Figure 3. Mdivi-1 is a poor inhibitor of human Drp1 GTPase activity
Substrate kinetics of recombinant human Drp1 was measured at 0–100 μM mdivi-1. Data were globally fit to an uncompetitive model yielding a_K_i > 1.2mM. The data and SEM are for 3 independent preparations of Drp1. Residuals to the fit are shown above the graph. See also Figure S3.
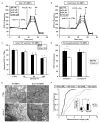
Figure 4. Mdivi-1-induced respiratory inhibition is not mimicked by Drp1 KO or dependent upon Drp1 expression
WT (A) or Drp1 KO (B) MEFs were treated with mdivi-1 (25–100 μM) or vehicle followed by FCCP (3 μM) plus pyruvate (10 mM) and antimycin A (AA, 1 μM) while OCR was measured. Traces here and below are mean ± SD of 3 wells and representative of at least 3 experiments. (C) Maximal OCR calculated immediately following FCCP plus pyruvate addition, expressed as a percentage of the maximal rate in vehicle-treated cells (mean ± SD, n=3). (D) Drp1 KO MEFs were permeabilized with 5 μg/mL saponin, along with ADP (1 mM) and either pyruvate and malate (5 mM each) or succinate (5 mM) in the presence of rotenone (0.5 μM). MEFs were then treated with 50 μM mdivi-1 or vehicle (CTRL). OCR is expressed as a percentage of OCR prior to drug injection. Results are mean ± SD, n=3. * p<0.05 compared to control. (E) Electron micrographs of WT or Drp1 KO MEFs treated with CTRL or mdivi-1 (50 μM) for 16 min. Scale bars = 1 μm. (F) Cumulative frequency distribution plot for mitochondrial length in WT or Drp1 KO MEFs ± mdivi-1. Bar graph inset is mean mitochondrial length ± SD. Results are from 50 mitochondria from 2 different experiments. See also Figures S4–S6.
Figure 5. Yeast Ndi1 NADH dehydrogenase prevents respiratory inhibition by mdivi-1
(A) Ndi1 and β-actin protein levels in COS-7 cells (COS) transfected with the NDI1 gene and selected for NDI1 expression compared to parental COS. (B) COS or NDI1-transfected COS (Ndi1) were treated with vehicle (CTRL), rotenone (1 μM), or piericidin A (100 nM), followed by FCCP (2 μM) plus pyruvate (10 mM), and then antimycin A (1 μM) while OCR was measured. (C) OCR traces for Ndi1-COS-7 or parental COS-7 cells treated with DMSO or mdivi-1, followed by the drugs in (B). Traces in (B) and (C) are mean ± SD of 3 wells and representative of 3 experiments. (D) Bar graph showing quantification of traces in (C). See also Figure S7.
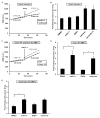
Figure 6. Mdivi-1 increases ROS in WT and Drp1 KO fibroblasts but not neurons
(A) DHE fluorescence (arbitrary units, A.U.) was measured over time in neurons. Rotenone (1 μM) or mdivi-1 (50 μM) was added as indicated (drug). Numbers are rates (A.U./min, mean ± SEM) before and after drug addition. (B) The rate of DHE fluorescence change following drug addition was divided by the basal rate to determine fold change. Piericidin A was added at 0.5 μM. DMSO was the vehicle for mdivi-1 and EtOH was the vehicle for rotenone and piericidin A. (C) DHE fluorescence measured over time in WT or Drp1 KO MEFs. Mdivi-1 was 50 μM. Numbers are rates before and after mdivi-1 addition. (D) and (E) The rate of DHE fluorescence change following drug addition was calculated in either WT (D) or Drp1 KO (E) MEFs as in (B). All data in bar graphs are mean ± SEM, n=5. * p<0.05.
Figure 7. Mdivi-1 modulates ROS production by brain mitochondria as predicted by Complex I inhibition
(A) Representative traces depicting H2O2 production by isolated brain mitochondria oxidizing glutamate and malate (G/M, 5 mM each) before and after addition of DMSO (CTRL) or mdivi-1 (50 μM), followed by addition of ADP (2 mM), and then rotenone (1 μM). (B) Quantification of the data in (A) (mean ± SD, n=5). * p<0.05 compared to control, @ p<0.05 compared to the respective condition with no ADP, # p<0.05 for mdivi-1 rate after ADP compared to control rate after ADP. Each rotenone (Rot) bar is the mean of 2 experiments. (C) Representative traces depicting RET-mediated H2O2 production by brain mitochondria incubated with succinate, followed by addition of CTRL or mdivi-1, and then ADP (2 mM). (D) Quantification of the data in (C) (mean ± SD, n=3). * p<0.05 compared to control.
Similar articles
- Mitochondrial division inhibitor 1 reduces dynamin-related protein 1 and mitochondrial fission activity.
Manczak M, Kandimalla R, Yin X, Reddy PH. Manczak M, et al. Hum Mol Genet. 2019 Jan 15;28(2):177-199. doi: 10.1093/hmg/ddy335. Hum Mol Genet. 2019. PMID: 30239719 Free PMC article. - Drp1 is dispensable for apoptotic cytochrome c release in primed MCF10A and fibroblast cells but affects Bcl-2 antagonist-induced respiratory changes.
Clerc P, Ge SX, Hwang H, Waddell J, Roelofs BA, Karbowski M, Sesaki H, Polster BM. Clerc P, et al. Br J Pharmacol. 2014 Apr;171(8):1988-99. doi: 10.1111/bph.12515. Br J Pharmacol. 2014. PMID: 24206264 Free PMC article. - Dynamin-related protein 1 mediates low glucose-induced endothelial dysfunction in human arterioles.
Tanner MJ, Wang J, Ying R, Suboc TB, Malik M, Couillard A, Branum A, Puppala V, Widlansky ME. Tanner MJ, et al. Am J Physiol Heart Circ Physiol. 2017 Mar 1;312(3):H515-H527. doi: 10.1152/ajpheart.00499.2016. Epub 2016 Dec 6. Am J Physiol Heart Circ Physiol. 2017. PMID: 27923790 Free PMC article. - To mdivi-1 or not to mdivi-1: Is that the question?
Smith G, Gallo G. Smith G, et al. Dev Neurobiol. 2017 Nov;77(11):1260-1268. doi: 10.1002/dneu.22519. Epub 2017 Aug 30. Dev Neurobiol. 2017. PMID: 28842943 Free PMC article. Review. - Dynamic regulation of mitochondrial fission through modification of the dynamin-related protein Drp1.
Chang CR, Blackstone C. Chang CR, et al. Ann N Y Acad Sci. 2010 Jul;1201:34-9. doi: 10.1111/j.1749-6632.2010.05629.x. Ann N Y Acad Sci. 2010. PMID: 20649536 Free PMC article. Review.
Cited by
- Mitochondria Homeostasis and Vascular Medial Calcification.
Li M, Zhu Y, Jaiswal SK, Liu NF. Li M, et al. Calcif Tissue Int. 2021 Aug;109(2):113-120. doi: 10.1007/s00223-021-00828-1. Epub 2021 Mar 3. Calcif Tissue Int. 2021. PMID: 33660037 Review. - Mitochondrial fission inhibition protects against hypertension induced by angiotensin II.
Preston KJ, Kawai T, Torimoto K, Kuroda R, Nakayama Y, Akiyama T, Kimura Y, Scalia R, Autieri MV, Rizzo V, Hashimoto T, Osei-Owusu P, Eguchi S. Preston KJ, et al. Hypertens Res. 2024 May;47(5):1338-1349. doi: 10.1038/s41440-024-01610-0. Epub 2024 Feb 21. Hypertens Res. 2024. PMID: 38383894 - Targeting mitochondrial shape: at the heart of cardioprotection.
Hernandez-Resendiz S, Prakash A, Loo SJ, Semenzato M, Chinda K, Crespo-Avilan GE, Dam LC, Lu S, Scorrano L, Hausenloy DJ. Hernandez-Resendiz S, et al. Basic Res Cardiol. 2023 Nov 13;118(1):49. doi: 10.1007/s00395-023-01019-9. Basic Res Cardiol. 2023. PMID: 37955687 Free PMC article. - Mitochondrial Dysfunction and Oxidative Stress in Alzheimer's Disease.
Misrani A, Tabassum S, Yang L. Misrani A, et al. Front Aging Neurosci. 2021 Feb 18;13:617588. doi: 10.3389/fnagi.2021.617588. eCollection 2021. Front Aging Neurosci. 2021. PMID: 33679375 Free PMC article. Review. - Defining the Role of Mitochondrial Fission in Corneal Myofibroblast Differentiation.
Jeon KI, Kumar A, Wozniak KT, Nehrke K, Huxlin KR. Jeon KI, et al. Invest Ophthalmol Vis Sci. 2022 Apr 1;63(4):2. doi: 10.1167/iovs.63.4.2. Invest Ophthalmol Vis Sci. 2022. PMID: 35377925 Free PMC article.
References
- Andreyev AY, Kushnareva YE, Starkov AA. Mitochondrial metabolism of reactive oxygen species. Biochemistry (Mosc ) 2005;70:200–214. - PubMed
- Batandier C, Guigas B, Detaille D, El-Mir MY, Fontaine E, Rigoulet M, Leverve XM. The ROS production induced by a reverse-electron flux at respiratory-chain complex 1 is hampered by metformin. J Bioenerg Biomembr. 2006;38:33–42. - PubMed
- Brand MD, Goncalves RL, Orr AL, Vargas L, Gerencser AA, Borch JM, Wang YT, Melov S, Turk CN, Matzen JT, Dardov VJ, Petrassi HM, Meeusen SL, Perevoshchikova IV, Jasper H, Brookes PS, Ainscow EK. Suppressors of Superoxide-H2O2 Production at Site IQ of Mitochondrial Complex I Protect against Stem Cell Hyperplasia and Ischemia-Reperfusion Injury. Cell Metab. 2016;24:582–592. - PMC - PubMed
MeSH terms
Substances
Grants and funding
- R21 NS096538/NS/NINDS NIH HHS/United States
- R01 NS085165/NS/NINDS NIH HHS/United States
- R01 NS064978/NS/NINDS NIH HHS/United States
- P01 HD016596/HD/NICHD NIH HHS/United States
- R01 GM067180/GM/NIGMS NIH HHS/United States
- R01 GM089853/GM/NIGMS NIH HHS/United States
LinkOut - more resources
Full Text Sources
Other Literature Sources
Molecular Biology Databases
Research Materials
Miscellaneous


