Myosin-dependent cell-cell communication controls synchronicity of division in acute and chronic stages of Toxoplasma gondii - PubMed (original) (raw)
Myosin-dependent cell-cell communication controls synchronicity of division in acute and chronic stages of Toxoplasma gondii
Karine Frénal et al. Nat Commun. 2017.
Abstract
The obligate intracellular parasite Toxoplasma gondii possesses a repertoire of 11 myosins. Three class XIV motors participate in motility, invasion and egress, whereas the class XXII myosin F is implicated in organelle positioning and inheritance of the apicoplast. Here we provide evidence that TgUNC acts as a chaperone dedicated to the folding, assembly and function of all Toxoplasma myosins. The conditional ablation of TgUNC recapitulates the phenome of the known myosins and uncovers two functions in parasite basal complex constriction and synchronized division within the parasitophorous vacuole. We identify myosin J and centrin 2 as essential for the constriction. We demonstrate the existence of an intravacuolar cell-cell communication ensuring synchronized division, a process dependent on myosin I. This connectivity contributes to the delayed death phenotype resulting from loss of the apicoplast. Cell-cell communication is lost in activated macrophages and during bradyzoite differentiation resulting in asynchronized, slow division in the cysts.
Conflict of interest statement
The authors declare no competing financial interests.
Figures
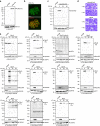
Figure 1. TgUNC is a myosin chaperone essential for tachyzoite survival.
(a) WB performed on total extract of extracellular tachyzoites, wild type (ΔKU80) or expressing the endogenously tagged TgUNC (UNC-3Ty). Actin (ACT) was used as loading control. (b) UNC-3Ty was detected in the cytosol of intracellular tachyzoites co-stained with the peripheral marker GAP45. Scale bar, 2 μm. (c) The regulation of the Tet-inducible cell line of TgUNC (MycUNC-iKD) was assessed by WB on total extract of extracellular tachyzoites. ACT was used as loading control. (d) TgUNC depletion has a severe impact on parasite survival as shown by plaque assay treated for 7 days±ATc. (e) All classes of myosin heavy chains are destabilized on TgUNC depletion. All the myosin motors, except TgMyoA and TgMyoD, have been endogenously tagged with 3xTy in the MycUNC-iKD strain and their expression level was followed by WB on total extracts of extracellular tachyzoites treated or not with ATc for 24 or 48 h. Expression of TgMyoD was followed using α-MLC2 antibodies. GAP40 or ACT were used as loading controls. MycUNC-iKD was tightly regulated in all samples. Stars indicate myosin subproducts. Uncropped gels are presented in Supplementary Fig. 11.
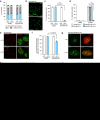
Figure 2. Impact of TgUNC depletion on tachyzoites.
(a) TgUNC depletion has no impact on intracellular growth. The number of parasites per vacuole was determined at 24 h after 48 h±ATc. (b) TgUNC-depleted parasites are not able to glide as shown by the ionophore-induced gliding assay performed after 48 h±ATc. Scale bar, 5 μm. (c) The invasion capacity of ΔKU80 and MycUNC-iKD strains was evaluated using a two-colour IFA performed after 48 h±ATc. Parasites were allowed to invade for 30 min before fixing. (d) Ionophore-induced egress assay of ΔKU80 and MycUNC-iKD strains performed by treating the parasites with DMSO or A23187 for 7 min after 56 h±ATc. (e) The presence of the apicoplast was assessed in MycUNC-iKD parasites using α-Cpn60 antibodies after 48 h±ATc. Scale bar, 2 μm. (f) A slight defect in apicoplast inheritance was monitored in TgUNC-depleted parasites. (g–i) The posterior pole (arrowheads) of intracellular tachyzoites was examined using the endogenously tagged MyoC (g), MORN1 (h) or centrin2 (CEN2) (i) in the MycUNC-iKD strain treated±ATc (48 h). Scale bar, 2 μm. (j) Electron micrographs of the basal pole of MycUNC-iKD parasites±ATc (48 h). The arrowheads point to the basal ends of the IMC. N: nucleus. Scale bar, 1 μm. (k–l) The synchronicity of division was followed using α-ISP1 and α-IMC1 antibodies that stain the apical cap and the rest of the IMC, respectively (k) and quantified in ΔKU80 and MycUNC-iKD strains at 24 h after 48 h±ATc (l). For a,c,d,f and l, the results are represented as mean±s.d. from three independent experiments. Their significance was assessed using a parametric paired _t_-test and the two-tailed _P_-values are written on the graphs when significant.
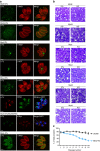
Figure 3. Localization and essentiality of myosin heavy chains in tachyzoites.
(a) Subcellular localization of the myosin heavy chains endogenously tagged with 3xTy. The peripheral marker α-IMC1 and the cytoplasmic marker α-ACT were also used to visualize the parasites. In addition, TgCEN2 and TgMORN1 were endogenously tagged with YFP and Myc, respectively, in the MyoJ-3Ty and the MyoK-3Ty background. Scale bar, 2 μm. Dashed lines represent the parasite periphery. (b) Plaque assays performed over 7 days on the 3Ty-tagged (3Ty) and knockout (KO) strains of myosins. No defect of fitness was monitored in the KO strains comparatively to the corresponding tagged strains except for MyoJ-KO as confirmed by competition assay using GFP-expressing parasites as an internal control (c). The results are presented as mean±s.d. from three independent experiments.
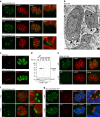
Figure 4. TgMyoJ and TgCEN2 are involved in the contraction of the basal complex.
(a) The signal of the endogenously tagged TgCEN2 (arrowheads) is not detected at the basal pole of MyoJ-KO in contrast to the one of MyoI-KO. In addition, the staining of endogenously tagged MyoC-3Ty (arrowheads) appears wider than in control parasites (Fig. 2g). Scale bar, 2 μm. (b) Electron micrographs of intracellular MyoJ-KO parasites. The arrowheads point to the basal ends of the IMC. N: nucleus, M: mitochondrion. Scale bar, 2 μm. (c) In MyoJ-KO parasites, the localization of TgMyoI is impaired and accumulates at the basal pole, inside the parasite, instead of being located at the residual body. Scale bar, 2 μm. (d) The regulation of the Tet-inducible TgCEN2 cell line (CEN2-YFP-iKD) was assessed by WB using α-GFP. Catalase (CAT) was used as loading control. Uncropped gels are presented in Supplementary Fig. 11. (e) The signal of CEN2-YFP-iKD was followed by IFA after 48 h±ATc. Scale bar, 2 μm. (f) In absence of CEN2, the signal of MyoJ is detectable at the basal pole but delineates a wider ring. The diameter of MyoJ ring is 0.88±0.03 μm (mean±s.d.) in untreated CEN2-YFP-iKD (_n_=32) and 1.48±0.13 μm after 48 h under ATc (_n_=34). The two-tailed _P_-value is <0.0001 (****). Scale bar, 2 μm. (g) Intracellular MyoJ-3Ty/CEN2-YFP treated±cytD (1 μm for 4 h). In treated parasites, MyoJ staining is wider (0.58±0.05 μm, _n_=25) than in untreated parasites (1.18±0.12 μm, _n_=33) and the staining of CEN2 at the posterior cup is not detectable. The two-tailed _P_-value is <0.0001 (****). Scale bar, 2 μm.
Figure 5. Deletion of TgMyoI or TgMyoJ does not impact on the residual body formation.
(a) The accumulation of amylopectin within the parasites in MyoI-KO/CDPK2-KO and MyoJ-KO/CDPK2-KO had no additional impact on their fitness as shown by competition assay using GFP-expressing parasites as internal control. Results are expressed as mean±s.d. (_n_=3). (b) PAS staining of ΔKU80, CDPK2-KO, MyoI-KO/CDPK2-KO and MyoJ-KO/CDPK2-KO parasites. In CDPK2-KO, amylopectin was mostly accumulated in the RB (arrowhead), whereas in MyoI-KO/CDPK2-KO and MyoJ-KO/CDPK2-KO, amylopectin was found in the RB (arrowheads) but also accumulating at the basal end of the parasites. Scale bar, 2 μm. (c) TEM sections of intracellular CDPK2-KO, MyoI-KO/CDPK2-KO and MyoJ-KO/CDPK2-KO parasites showing that one RB (arrowheads) is visible in each vacuole but not connected (arrows) to the parasites in MyoI-KO/CDPK2-KO and MyoJ-KO/CDPK2-KO.
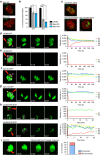
Figure 6. Intravacuolar TgMyoI-KO and TgMyoJ-KO parasites divide asynchronously and are not connected.
(a) IFA showing the intravacuolar asynchronicity of division in MyoI- and MyoJ-KO stained with α-ISP1 and α-IMC1 24 h post infection. Scale bar, 2 μm. (b) Quantification of the synchronicity of intravacuolar division after 24 and 30 h of growth. Results are represented as mean±s.d. from three independent experiments and the significance of the results was assessed using a parametric paired _t_-test. The two-tailed _P_-values are: 0.0219 (*) and 0.0175 (*) for MyoI-KO and MyoJ-KO, respectively, compared to ΔKU80 at 24 h and 0.0016 (**) and 0.0007 (***) at 30 h. (c) Transient transfection of SET8-HA shows that intravacuolar parasites are all in the same phase of their cell cycle in ΔKU80 in contrast to intravacuolar MyoI- and MyoJ-KO parasites. Scale bar, 2 μm. (d–h) Left panels: time-lapse imaging of FRAP experiments performed on type I tachyzoites ΔKU80 (d,e), MyoI-KO (f) and MyoJ-KO (g) transiently transfected with GFP or on type I tachyzoites ΔKU80 transiently transfected with SET8-GFP (h). The bleached areas are delineated in red. Right panels: quantification of the intensity of GFP fluorescence recorded in the areas numbered on the left panels. Scale bars, 2 μm (d–g) and 5 μm (h). (i) Time-lapse imaging of a representative FRAP experiment performed on intracellular type I tachyzoites (RH-YFP) collected by intraperitoneal (IP) lavage 3 days p.i. (scale bar, 2 μm) and quantification of parasites connection in 10 vacuoles tested.
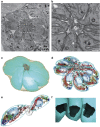
Figure 7. ΔKU80 parasite intravacuolar connection revealed by serial section TEM and 3D reconstruction.
(a) Section from the imaged volume through the PV with eight tachyzoites connected to the residual body (rb) outlined by white dashed square. The PV inside the host cell cytoplasm is surrounded by host mitochondria (hm) and located close to the host cell nucleus (hN). Scale bar, 1 μm. (b) High magnification view of the centre of the rosette. The tachyzoite organelles nucleus (N) with nucleolus (n), mitochondrion (m), rhoptry (rh), apicoplast (a) and dense granules (dg) are present. Scale bar, 0.5 μm. (c,d) 3D model of the reconstructed rosette from 33 serial sections of total imaged volume of 18.14 μm × 18.14 μm × 2.31 μm. (c) The individual tachyzoites (cyan) forming the rosette are connected to the residual body (grey) inside the PV (light brown). (d) Same model showing the tachyzoite organelles: nucleus (light blue), mitochondrion (red), rhoptry (orange), apicoplast (green), micronemes (dark blue) and dense granules (dark brown). (e) View of two isolated tachyzoites connected to the residual body with closely apposed mitochondria (red). (f) View from the centre of the residual body showing the connection opening at basal pole of three tachyzoites. The diameter of this opening has been measured (_n_=111) on several sections of three vacuoles and is estimated at 322±53 nm (mean±s.d.).
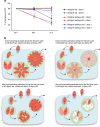
Figure 8. The intravacuolar connection contributes to the delayed death phenotype.
(a) The survival of the DD-MyoF-tail, DD-MyoF-tail/MyoI-KO and DD-MyoF-tail/MyoJ-KO parasites was assessed at 24, 48 and 72 h p.i. in absence or presence of Shield-1 (Shld-1) using GFP-expressing parasites as an internal control. For comparison, the ratios of GFP control parasites at 24 h have been normalized to 20%. The results are expressed as mean±s.d. (_n_=3). (b) Model of parasites' growth during the first lytic cycle depending on the presence or absence of TgMyoI and TgMyoJ and the defect (+ Shld-1) or not (− Shld-1) in apicoplast segregation. The diffusion of metabolites from the apicoplast (red dot) is represented in red. The different shades of red reflect the dilution of metabolites occurring on division when the apicoplast is not properly segregated.
Figure 9. The connectivity between type II parasites shows higher susceptibility to stress conditions than type I.
(a) Competition assay performed over six passages with type II ME49 wild type (WT), MyoI-KO and MyoJ-KO using GFP-expressing parasites as an internal control. As in type I, type II MyoJ-KO parasites exhibit a fitness defect. The results are expressed as mean±s.d. (_n_=3). (b) Quantification of the synchronicity of intravacuolar division 30 or 42 h p.i. Results are represented as mean±s.d. (_n_=3) and their significance was assessed using a parametric paired _t_-test. The two-tailed _P_-values are: 0.0120 (*) and 0.0025 (**) for MyoI-KO and MyoJ-KO, respectively, compared to WT at 30 h and 0.0057 (**) and 0.0028 (**) at 42 h. (c) Time-lapse imaging of representative FRAP experiment performed activated BMDMs, 24 h after infection by type I (RH) tachyzoites (top panel) or 48 h after infection by type II (ME49) tachyzoites (bottom panel), all stably expressing GFP. Scale bar, 2 μm. (d) Quantification of parasites connection in n different vacuoles recorded from two biological replicates: _n_=15 (RH, first column), _n_=36 (ME49, second column), _n_=26 (ME49, third column). Results are presented as mean±s.d. and their significance was assessed using a parametric paired _t_-test. The two-tailed _P_-values are: 0.0224 (left *) and 0.0172 (right *). (e) Quantification of tachyzoite to bradyzoite conversion assessed by DBA lectin staining of RH-GFP (24 h p.i.) or ME49 (48 h p.i.) infected BMDMs, in 100 vacuoles from two biological replicates. Results are presented as mean±s.d. and their significance was assessed using a parametric paired _t_-test. The two-tailed _P_-values are: 0.0168 (left *) and 0.0150 (right *).
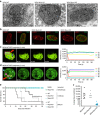
Figure 10. The connectivity between bradyzoites is lost both in vitro and in vivo.
(a) Electron micrographs of cyst-forming bradyzoites 14 days post-differentiation in vitro. No visible defect was detected in MyoI-KO or MyoJ-KO compared to WT. Scale bar, 2 μm. (b) The asynchronicity of division within cysts 14 days post-differentiation in vitro is visible in the MyoI-KO and MyoJ-KO but also in the WT strain using α-IMC1 (arrowheads). Scale bar, 5 μm. (c,d) Left panels: time-lapse imaging of FRAP experiments performed on WT bradyzoites 14 days after differentiation in vitro (c) or collected from mouse brain 4 weeks p.i (d). The bleached areas are delineated in red. Scale bar, 5 μm. Right panel: quantification of the intensity of GFP fluorescence recorded in the areas numbered on the left panel. (e) 500 or 1,000 ME49 tachyzoites of the parental (WT) or knockouts were injected intraperitoneally into CBA/J mice. In addition, 150,000 parasites of the ME49 MyoJ-KO strain have also been injected. Five animals were infected for each strain and their survival was monitored over time. (f) Average number of cysts per brain assessed after tissue cyst extraction.
Similar articles
- Toxoplasma gondii myosin F, an essential motor for centrosomes positioning and apicoplast inheritance.
Jacot D, Daher W, Soldati-Favre D. Jacot D, et al. EMBO J. 2013 Jun 12;32(12):1702-16. doi: 10.1038/emboj.2013.113. Epub 2013 May 21. EMBO J. 2013. PMID: 23695356 Free PMC article. - Genetic impairment of parasite myosin motors uncovers the contribution of host cell membrane dynamics to Toxoplasma invasion forces.
Bichet M, Touquet B, Gonzalez V, Florent I, Meissner M, Tardieux I. Bichet M, et al. BMC Biol. 2016 Nov 9;14(1):97. doi: 10.1186/s12915-016-0316-8. BMC Biol. 2016. PMID: 27829452 Free PMC article. - Toxoplasma gondii myosins B/C: one gene, two tails, two localizations, and a role in parasite division.
Delbac F, Sänger A, Neuhaus EM, Stratmann R, Ajioka JW, Toursel C, Herm-Götz A, Tomavo S, Soldati T, Soldati D. Delbac F, et al. J Cell Biol. 2001 Nov 12;155(4):613-23. doi: 10.1083/jcb.200012116. Epub 2001 Nov 12. J Cell Biol. 2001. PMID: 11706051 Free PMC article. - The Actomyosin Systems in Apicomplexa.
Frénal K, Krishnan A, Soldati-Favre D. Frénal K, et al. Adv Exp Med Biol. 2020;1239:331-354. doi: 10.1007/978-3-030-38062-5_14. Adv Exp Med Biol. 2020. PMID: 32451865 Review. - Review: Toxoplasma gondii cellular invasion.
Bonhomme A, Pingret L, Pinon JM. Bonhomme A, et al. Parassitologia. 1992 Dec;34(1-3):31-43. Parassitologia. 1992. PMID: 1339976 Review.
Cited by
- Architecture of the Toxoplasma gondii apical polar ring and its role in gliding motility and invasion.
Ren B, Haase R, Patray S, Nguyen Q, Maco B, Dos Santos Pacheco N, Chang YW, Soldati-Favre D. Ren B, et al. Proc Natl Acad Sci U S A. 2024 Nov 12;121(46):e2416602121. doi: 10.1073/pnas.2416602121. Epub 2024 Nov 8. Proc Natl Acad Sci U S A. 2024. PMID: 39514309 - Myosin A and F-Actin play a critical role in mitochondrial dynamics and inheritance in Toxoplasma gondii.
Oliveira Souza RO, Yang C, Arrizabalaga G. Oliveira Souza RO, et al. PLoS Pathog. 2024 Oct 7;20(10):e1012127. doi: 10.1371/journal.ppat.1012127. eCollection 2024 Oct. PLoS Pathog. 2024. PMID: 39374269 Free PMC article. - SPARK regulates AGC kinases central to the Toxoplasma gondii asexual cycle.
Herneisen AL, Peters ML, Smith TA, Shortt E, Lourido S. Herneisen AL, et al. Elife. 2024 Aug 13;13:RP93877. doi: 10.7554/eLife.93877. Elife. 2024. PMID: 39136687 Free PMC article. - BCC0 collaborates with IMC32 and IMC43 to form the Toxoplasma gondii essential daughter bud assembly complex.
Pasquarelli RR, Sha J, Wohlschlegel JA, Bradley PJ. Pasquarelli RR, et al. PLoS Pathog. 2024 Jul 18;20(7):e1012411. doi: 10.1371/journal.ppat.1012411. eCollection 2024 Jul. PLoS Pathog. 2024. PMID: 39024411 Free PMC article. - Cytokinetic abscission in Toxoplasma gondii is governed by protein phosphatase 2A and the daughter cell scaffold complex.
Marq JB, Gosetto M, Altenried A, Vadas O, Maco B, Dos Santos Pacheco N, Tosetti N, Soldati-Favre D, Lentini G. Marq JB, et al. EMBO J. 2024 Sep;43(17):3752-3786. doi: 10.1038/s44318-024-00171-9. Epub 2024 Jul 15. EMBO J. 2024. PMID: 39009675 Free PMC article.
References
- Heintzelman M. B. Gliding motility in apicomplexan parasites. Semin. Cell Dev. Biol. 46, 135–142 (2015). - PubMed
- Meissner M., Schluter D. & Soldati D. Role of Toxoplasma gondii myosin A in powering parasite gliding and host cell invasion. Science 298, 837–840 (2002). - PubMed
Publication types
MeSH terms
Substances
LinkOut - more resources
Full Text Sources
Other Literature Sources
Medical
