Increased alignment sensitivity improves the usage of genome alignments for comparative gene annotation - PubMed (original) (raw)
Comparative Study
. 2017 Aug 21;45(14):8369-8377.
doi: 10.1093/nar/gkx554.
Affiliations
- PMID: 28645144
- PMCID: PMC5737078
- DOI: 10.1093/nar/gkx554
Comparative Study
Increased alignment sensitivity improves the usage of genome alignments for comparative gene annotation
Virag Sharma et al. Nucleic Acids Res. 2017.
Abstract
Genome alignments provide a powerful basis to transfer gene annotations from a well-annotated reference genome to many other aligned genomes. The completeness of these annotations crucially depends on the sensitivity of the underlying genome alignment. Here, we investigated the impact of the genome alignment parameters and found that parameters with a higher sensitivity allow the detection of thousands of novel alignments between orthologous exons that have been missed before. In particular, comparisons between species separated by an evolutionary distance of >0.75 substitutions per neutral site, like human and other non-placental vertebrates, benefit from increased sensitivity. To systematically test if increased sensitivity improves comparative gene annotations, we built a multiple alignment of 144 vertebrate genomes and used this alignment to map human genes to the other 143 vertebrates with CESAR. We found that higher alignment sensitivity substantially improves the completeness of comparative gene annotations by adding on average 2382 and 7440 novel exons and 117 and 317 novel genes for mammalian and non-mammalian species, respectively. Our results suggest a more sensitive alignment strategy that should generally be used for genome alignments between distantly-related species. Our 144-vertebrate genome alignment and the comparative gene annotations (https://bds.mpi-cbg.de/hillerlab/144VertebrateAlignment\_CESAR/) are a valuable resource for comparative genomics.
© The Author(s) 2017. Published by Oxford University Press on behalf of Nucleic Acids Research.
Figures
Figure 1.
Alignment parameter sensitivity is crucial to align exons to their orthologous genomic locus. (A) UCSC genome browser screenshot showing the CATSPERD (cation channel sperm associated auxiliary subunit delta) gene locus in the human genome and genome alignments (chains of co-linear local alignments) to opossum computed with three different parameter sets (see text). Several exons of this gene only align to the opossum ortholog with more sensitive parameters (blue boxes) or using a subsequent round of highly sensitive alignments in addition (red boxes). (B–D) Three examples of local alignments covering exons of CATSPERD. Exonic bases are in upper case, intronic bases are in lower case.
Figure 2.
Sensitive alignment parameters can uncover thousands of new alignments between exons of orthologous genes. The figure compares the number of exons that align between orthologous genes for nine species at various evolutionary distances to human (axis at the bottom). Three alignment parameter sets were tested that differ in their sensitivity. The Y-axis shows the percent increase relative to the number of aligning exons with parameter set 1. The absolute number of aligning exons with parameter set 1 is given below the black dots, the absolute increase obtained with parameter set 2 and 3 is given alongside or above the black dots.
Figure 3.
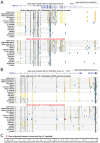
Highly sensitive alignment parameters detect additional alignments between human and non-mammalian vertebrates. UCSC genome browser screenshots compare the UCSC 100-way alignment (27) with our 144-vertebrate alignment for two genomic loci (A and B). Aligning sequence is visualized by black and grey boxes. The darker the color of the box, the higher is the sequence similarity in the alignment. Double horizontal lines indicate sequence that does not align between the reference (human) and the query species. Yellow background indicates regions where exon alignments can only be detected with sensitive parameters in our 144-way alignment. Orange background indicates additional non-exonic conserved regions. For visualization, only a subset of all 70 non-mammalian vertebrates is shown. (C) Representative additional exon alignment between human and frog that was only detected with highly-sensitive parameters (marked with a star in B).
Figure 4.
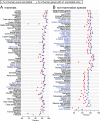
Comparative gene annotation in 143 vertebrate genomes. The X-axis shows the proportion of human exons (red circles) and genes for which CESAR annotated at least one exon (blue triangle) in 73 mammals (A) and 70 non-mammalian vertebrates (B). Species in blue font are not contained in the UCSC 100-way or primate alignment.
Figure 5.
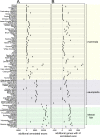
Increased alignment sensitivity detects thousands of additional conserved exons and hundreds of conserved genes between evolutionarily distant species. The figure shows the absolute number of exons (A) and genes (B) that are additionally annotated using our 144-vertebrate alignment, compared to the UCSC 100-way alignment. Only species for which the same assembly is included in both genome alignments are shown. Major clades are highlighted. Wallaby, parrot, scarlet macaw and spiny softshell turtle that have rather incomplete and fragmented genome assemblies are the only species were fewer exons or genes are annotated in our alignment. The reason is that fragmented assemblies result in short and low-scoring co-linear alignments that can be discarded by our more stringent filtering thresholds (see Methods). Manual inspection shows that such short co-linear alignments include paralogous gene alignments that would lead to incorrect gene annotations (Supplementary Figure S1). Given that our approach provides a consistent improvement in comparative gene annotation, better genome assemblies should substantially improve the gene annotation of these four species.
Similar articles
- Coding exon-structure aware realigner (CESAR) utilizes genome alignments for accurate comparative gene annotation.
Sharma V, Elghafari A, Hiller M. Sharma V, et al. Nucleic Acids Res. 2016 Jun 20;44(11):e103. doi: 10.1093/nar/gkw210. Epub 2016 Mar 25. Nucleic Acids Res. 2016. PMID: 27016733 Free PMC article. - CESAR 2.0 substantially improves speed and accuracy of comparative gene annotation.
Sharma V, Schwede P, Hiller M. Sharma V, et al. Bioinformatics. 2017 Dec 15;33(24):3985-3987. doi: 10.1093/bioinformatics/btx527. Bioinformatics. 2017. PMID: 28961744 - Coding Exon-Structure Aware Realigner (CESAR): Utilizing Genome Alignments for Comparative Gene Annotation.
Sharma V, Hiller M. Sharma V, et al. Methods Mol Biol. 2019;1962:179-191. doi: 10.1007/978-1-4939-9173-0_10. Methods Mol Biol. 2019. PMID: 31020560 - Differences between pair-wise and multi-sequence alignment methods affect vertebrate genome comparisons.
Margulies EH, Chen CW, Green ED. Margulies EH, et al. Trends Genet. 2006 Apr;22(4):187-93. doi: 10.1016/j.tig.2006.02.005. Epub 2006 Feb 24. Trends Genet. 2006. PMID: 16499991 Review. - Comparative Genome Annotation.
Nachtweide S, Romoth L, Stanke M. Nachtweide S, et al. Methods Mol Biol. 2024;2802:165-187. doi: 10.1007/978-1-0716-3838-5_7. Methods Mol Biol. 2024. PMID: 38819560 Review.
Cited by
- Distinct Genes with Similar Functions Underlie Convergent Evolution in Myotis Bat Ecomorphs.
Morales AE, Burbrink FT, Segall M, Meza M, Munegowda C, Webala PW, Patterson BD, Thong VD, Ruedi M, Hiller M, Simmons NB. Morales AE, et al. Mol Biol Evol. 2024 Sep 4;41(9):msae165. doi: 10.1093/molbev/msae165. Mol Biol Evol. 2024. PMID: 39116340 Free PMC article. - Phylogenomic analyses of all species of swordtail fishes (genus Xiphophorus) show that hybridization preceded speciation.
Du K, Ricci JMB, Lu Y, Garcia-Olazabal M, Walter RB, Warren WC, Dodge TO, Schumer M, Park H, Meyer A, Schartl M. Du K, et al. Nat Commun. 2024 Aug 4;15(1):6609. doi: 10.1038/s41467-024-50852-6. Nat Commun. 2024. PMID: 39098897 Free PMC article. - Genome Report: chromosome-scale genome assembly of the African spiny mouse (Acomys cahirinus).
Nguyen ED, Fard VN, Kim BY, Collins S, Galey M, Nelson BR, Wakenight P, Gable SM, McKenna A, Bammler TK, MacDonald J, Okamura DM, Shendure J, Beier DR, Ramirez JM, Majesky MW, Millen KJ, Tollis M, Miller DE. Nguyen ED, et al. G3 (Bethesda). 2023 Sep 30;13(10):jkad177. doi: 10.1093/g3journal/jkad177. G3 (Bethesda). 2023. PMID: 37552705 Free PMC article. - Integrating gene annotation with orthology inference at scale.
Kirilenko BM, Munegowda C, Osipova E, Jebb D, Sharma V, Blumer M, Morales AE, Ahmed AW, Kontopoulos DG, Hilgers L, Lindblad-Toh K, Karlsson EK; Zoonomia Consortium‡; Hiller M. Kirilenko BM, et al. Science. 2023 Apr 28;380(6643):eabn3107. doi: 10.1126/science.abn3107. Epub 2023 Apr 28. Science. 2023. PMID: 37104600 Free PMC article. - GENOME REPORT: Chromosome-scale genome assembly of the African spiny mouse ( Acomys cahirinus ).
Nguyen ED, Fard VN, Kim BY, Collins S, Galey M, Nelson BR, Wakenight P, Gable SM, McKenna A, Bammler TK, MacDonald J, Okamura DM, Shendure J, Beier DR, Ramirez JM, Majesky MW, Millen KJ, Tollis M, Miller DE. Nguyen ED, et al. bioRxiv [Preprint]. 2023 Apr 5:2023.04.03.535372. doi: 10.1101/2023.04.03.535372. bioRxiv. 2023. PMID: 37066261 Free PMC article. Updated. Preprint.
References
- Picardi E., Pesole G.. Computational methods for ab initio and comparative gene finding. Methods Mol. Biol. 2010; 609:269–284. - PubMed
- Burge C., Karlin S.. Prediction of complete gene structures in human genomic DNA. J. Mol. Biol. 1997; 268:78–94. - PubMed
- Stanke M., Waack S.. Gene prediction with a hidden Markov model and a new intron submodel. Bioinformatics. 2003; 19(Suppl. 2):ii215–i225. - PubMed
Publication types
MeSH terms
LinkOut - more resources
Full Text Sources
Other Literature Sources
Research Materials
Miscellaneous


