Indoxyl Sulfate Affects Glial Function Increasing Oxidative Stress and Neuroinflammation in Chronic Kidney Disease: Interaction between Astrocytes and Microglia - PubMed (original) (raw)
Indoxyl Sulfate Affects Glial Function Increasing Oxidative Stress and Neuroinflammation in Chronic Kidney Disease: Interaction between Astrocytes and Microglia
Simona Adesso et al. Front Pharmacol. 2017.
Abstract
Indoxyl sulfate (IS) is a protein-bound uremic toxin resulting from the metabolism of dietary tryptophan which accumulates in patients with impaired renal function, such as chronic kidney disease (CKD). IS is a well-known nephrovascular toxin but little is known about its effects on central nervous system (CNS) cells. Considering the growing interest in the field of CNS comorbidities in CKD, we studied the effect of IS on CNS cells. IS (15-60 μM) treatment in C6 astrocyte cells increased reactive oxygen species release and decreased nuclear factor (erythroid-derived 2)-like 2 (Nrf2) activation, and heme oxygenase-1 (HO-1) and NAD(P)H dehydrogenase quinone 1 expression. Moreover, IS increased Aryl hydrocarbon Receptor (AhR) and Nuclear Factor-kB (NF-kB) activation in these cells. Similiar observations were made in primary mouse astrocytes and mixed glial cells. Inducible nitric oxide synthase and cyclooxygenase-2 (COX-2) expression, tumor necrosis factor-α and interleukin-6 release and nitrotyrosine formation were increased by IS (15-60 μM) in primary mouse astrocytes and mixed glial cells. IS increased AhR and NF-kB nuclear translocation and reduced Nrf2 translocation and HO-1 expression in primary glial cells. In addition, IS induced cell death in neurons in a dose dependent fashion. Injection of IS (800 mg/kg, i.p.) into mice induced histological changes and increased COX-2 expression and nitrotyrosine formation in thebrain tissue. Taken together, our results show a significant contribution of IS in generating a neurotoxic enviroment and it could also have a potential role in neurodegeneration. IS could be considered also a potential therapeutical target for CKD-associated neurodegenerative complications.
Keywords: chronic kidney disease; indoxyl sulfate; neurodegeneration; neuroinflammation; oxidative stress; uremic toxins.
Figures
FIGURE 1
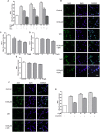
Effect of IS (15–60 μM) on ROS formation (A), evaluated by means of the probe H2DCF-DA, in C6 cells in presence of DPI and of NAC. Cellular fluorescence was evaluated using fluorescence-activated cell sorting analysis (FACSscan; Becton Dickinson) and elaborated with Cell Quest software. Values are expressed as mean fluorescence intensity (n = 12). Effect of IS (30 μM) on Nrf2 nuclear translocation in C6 cells in presence of DPI and NAC (B). Nuclear translocation of Nrf2 was detected using immunofluorescence confocal microscopy. Scale bar, 10 μm. Blue and green fluorescences indicate localization of the nucleus (DAPI) and Nrf2, respectively. Analysis was performed by confocal laser scanning microscopy. Effect of IS (15–60 μM) on HO-1 (C), NQO1 (D), and SOD (E) expression in C6 cells. Cellular fluorescence was evaluated using fluorescence-activated cell sorting analysis (FACSscan; Becton Dickinson) and elaborated with Cell Quest software. Effect of IS (30 μM) on AhR nuclear translocation in presence of DPI in C6 cells (F). Nuclear translocation of AhR was detected using immunofluorescence confocal microscopy. Scale bar, 10 μm. Blue and green fluorescences indicate localization of nucleus (DAPI) and AhR, respectively. Analysis was performed by confocal laser scanning microscopy and values are expressed as mean fluorescence intensity (n = 12). Effect of IS (15–60 μM) on ROS formation (G), evaluated by means of the probe H2DCF-DA, in C6 cells in presence of CH-223191. Values are expressed as mean fluorescence intensity (n = 9). ∘∘∘, ∘∘, and °denote P < 0.001, P < 0.01, and P < 0.05 vs. control. ∗∗∗ denotes P < 0.001, vs. IS alone.
FIGURE 2
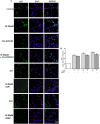
Effect of IS (30 μM) on p65 nuclear translocation in C6 cells in presence of the antagonists CH-223191, DPI and NAC in C6 cells (A). Nuclear translocation of NF-kB p65 subunit was detected using immunofluorescence confocal microscopy. Scale bar, 10 μm. Blue and green fluorescences indicate localization of the nucleus (DAPI) and p65, respectively. Analysis was performed by confocal laser scanning microscopy. Effect of IS (15–60 μM) on ROS formation (B), evaluated by means of the probe H2DCF-DA, in C6 cells in presence of NF-kB-inhibitor PDTC. Values are expressed as mean fluorescence intensity (n = 9).∘∘∘ denotes P < 0.001 vs. control. ∗∗∗ denotes P < 0.001 and ∗ denotes P < 0.05 vs. IS alone.
FIGURE 3
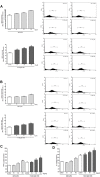
Effect of IS (15–60 μM) on ROS formation (A), evaluated by means of the probe H2DCF-DA, in astrocytes and mixed glial cells. Cellular fluorescence was evaluated using fluorescence-activated cell sorting analysis (FACSscan; Becton Dickinson) and elaborated with Cell Quest software. Effect of IS (15–60 μM) on nitrotyrosine formmation (B) in astrocytes and mixed glial cells. Cellular fluorescence was evaluated using fluorescence-activated cell sorting analysis (FACSscan; Becton Dickinson) and elaborated with Cell Quest software. Effect of IS (30 μM) on Nrf2 nuclear translocation in astrocytes and mixed glial cells (C). Nuclear translocation of Nrf2 was detected using immunofluorescence confocal microscopy. Scale bar, 10 μm. Blue and green fluorescences indicate localization of nucleus (DAPI) and Nrf2, respectively. Analysis was performed by confocal laser scanning microscopy. Effect of IS (15–60 μM) on HO-1 expression (D) in astrocytes and mixed glial cells. Cellular fluorescence was evaluated using fluorescence-activated cell sorting analysis (FACSscan; Becton Dickinson) and elaborated with Cell Quest software. Values are expressed as mean fluorescence intensity (n = 9). ∘∘∘, ∘∘, and °denote P < 0.001, P < 0.01, and P < 0.05 vs control. ∗∗ and ∗ denote P < 0.01 and P < 0.05 vs. astrocytes.
FIGURE 4
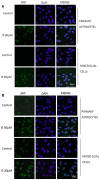
Effect of IS (30 μM) on AhR (A) and p65 (B) nuclear translocation in astrocytes and mixed glial cells. Nuclear translocation of AhR and p65 was detected using immunofluorescence confocal microscopy. Scale bar, 10 μm. Blue and green fluorescences indicate localization of nucleus (DAPI) and AhR and p65, respectively. Analysis (n = 9) was performed by confocal laser scanning microscopy.
FIGURE 5
Effect of IS (15–60 μM) on iNOS (A), COX-2 (B) expression by astrocytes and mixed glial cells. Cellular fluorescence was evaluated using fluorescence-activated cell sorting analysis (FACSscan; Becton Dickinson) and elaborated with Cell Quest software. Values are expressed as mean fluorescence intensity (n = 9). Effect of IS (15–60 μM) TNF-α (C) and IL-6 (D) release by astrocytes and mixed glial cells (n = 9). Cyokine release was assessed by ELISA assay and expressed as pg/ml (n = 9). ∘∘∘, ∘∘, and °denote P < 0.001, P < 0.01, and P < 0.05 vs. control. ∗∗∗,∗∗, and ∗ denote P < 0.001, P < 0.01, and P < 0.05 vs. astrocytes.
FIGURE 6
Effect of IS (15–60 μM) on cortical and on hippocampal neuronal cell viability. Values are expressed as percentage of cytotoxicity (n = 9). ∘∘∘and ° denote P < 0.001 and P < 0.05 vs. control, # denotes P < 0.05 vs. hippocampal neurons.
FIGURE 7
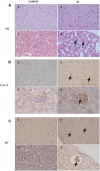
Histologic and immunohistochemical findings of brain and kidneys in treated mice (IS column). (A) (1) Brain; normal tissue from control mouse. (2) Brain; neuronal pyknosis associated with mild satellitosis. (3) Kidney; normal tissue from control mouse. (4) Kidney; Atrophic glomeruli and severe vacuolar degeneration of tubules with proteinaceous amorphous material and hypereosinophilic concretions within lumen (arrows); Hematoxylin and Eosin (HE) stain. (B) (1) Brain; normal tissue from control mouse. (2) Brain; strong immunoreactivity for COX-2 antibody in degenerating neurons (arrows) from treated mouse. (3) Kidney; normal tissue from control mouse. (4) Kidney; strong immunoreactivity for COX-2 antibody in blood vessels of the glomeruli (arrows) from treated mouse. Immunohistochemistry (HRP-method). (C) (1) Brain; normal tissue from control mouse. (2) Brain; the immunoreactivity with the anti-nitrotyrosine antibody is intensely detected in the neurons of a treated mice (arrows). (3) Kidney; normal tissue from control mouse. (4) Kidney; strong immunoreactivity in blood vessels of an atrophic glomerulus (arrow) from treated mouse. Immunohistochemistry (HRP-method). Data are from two independent experiments and represent mean ± SEM (n = 5–10 per group).
Similar articles
- AST-120 Reduces Neuroinflammation Induced by Indoxyl Sulfate in Glial Cells.
Adesso S, Paterniti I, Cuzzocrea S, Fujioka M, Autore G, Magnus T, Pinto A, Marzocco S. Adesso S, et al. J Clin Med. 2018 Oct 17;7(10):365. doi: 10.3390/jcm7100365. J Clin Med. 2018. PMID: 30336612 Free PMC article. - Antimalarial Drug Artemether Inhibits Neuroinflammation in BV2 Microglia Through Nrf2-Dependent Mechanisms.
Okorji UP, Velagapudi R, El-Bakoush A, Fiebich BL, Olajide OA. Okorji UP, et al. Mol Neurobiol. 2016 Nov;53(9):6426-6443. doi: 10.1007/s12035-015-9543-1. Epub 2015 Nov 25. Mol Neurobiol. 2016. PMID: 26607631 - L-F001, a novel multifunctional ROCK inhibitor, suppresses neuroinflammation in vitro and in vivo: Involvement of NF-κB inhibition and Nrf2 pathway activation.
Chen J, Yin W, Tu Y, Wang S, Yang X, Chen Q, Zhang X, Han Y, Pi R. Chen J, et al. Eur J Pharmacol. 2017 Jul 5;806:1-9. doi: 10.1016/j.ejphar.2017.03.025. Epub 2017 Mar 16. Eur J Pharmacol. 2017. PMID: 28320516 - Indoxyl sulfate and p-cresyl sulfate in chronic kidney disease. Could these toxins modulate the antioxidant Nrf2-Keap1 pathway?
Stockler-Pinto MB, Fouque D, Soulage CO, Croze M, Mafra D. Stockler-Pinto MB, et al. J Ren Nutr. 2014 Sep;24(5):286-91. doi: 10.1053/j.jrn.2013.11.006. Epub 2014 Jan 28. J Ren Nutr. 2014. PMID: 24480117 Review. - Indoxyl sulfate induces nephrovascular senescence.
Niwa T, Shimizu H. Niwa T, et al. J Ren Nutr. 2012 Jan;22(1):102-6. doi: 10.1053/j.jrn.2011.10.032. J Ren Nutr. 2012. PMID: 22200425 Review.
Cited by
- Increased Blood-Brain Barrier Permeability and Cognitive Impairment in Patients With ESKD.
Bobot M, Guedj E, Resseguier N, Faraut J, Garrigue P, Nail V, Hache G, Gonzalez S, McKay N, Vial R, Bouchouareb D, Lano G, Jourde-Chiche N, Duval-Sabatier A, Guilaume F, Guillet B, Burtey S. Bobot M, et al. Kidney Int Rep. 2024 Jul 20;9(10):2988-2995. doi: 10.1016/j.ekir.2024.07.021. eCollection 2024 Oct. Kidney Int Rep. 2024. PMID: 39430169 Free PMC article. - The Role of the Gut Microbiota in Complications among Hemodialysis Patients.
Du J, Zhao X, Ding X, Han Q, Duan Y, Ren Q, Wang H, Song C, Wang X, Zhang D, Zhu H. Du J, et al. Microorganisms. 2024 Sep 12;12(9):1878. doi: 10.3390/microorganisms12091878. Microorganisms. 2024. PMID: 39338552 Free PMC article. Review. - Magnetic Resonance Imaging in Uremic Encephalopathy: Identifying Key Imaging Patterns and Clinical Correlations.
Greco F, Buoso A, Cea L, D'Andrea V, Bernetti C, Beomonte Zobel B, Mallio CA. Greco F, et al. J Clin Med. 2024 Jul 12;13(14):4092. doi: 10.3390/jcm13144092. J Clin Med. 2024. PMID: 39064132 Free PMC article. Review. - Short-chain fatty acids suppresses astrocyte activation by amplifying Trp-AhR-AQP4 signaling in experimental autoimmune encephalomyelitis mice.
Lin X, Peng Y, Guo Z, He W, Guo W, Feng J, Lu L, Liu Q, Xu P. Lin X, et al. Cell Mol Life Sci. 2024 Jul 8;81(1):293. doi: 10.1007/s00018-024-05332-x. Cell Mol Life Sci. 2024. PMID: 38976012 Free PMC article. - From Gut Microbiomes to Infectious Pathogens: Neurological Disease Game Changers.
K M M, Ghosh P, Nagappan K, Palaniswamy DS, Begum R, Islam MR, Tagde P, Shaikh NK, Farahim F, Mondal TK. K M M, et al. Mol Neurobiol. 2024 Jul 5. doi: 10.1007/s12035-024-04323-0. Online ahead of print. Mol Neurobiol. 2024. PMID: 38967904 Review.
References
LinkOut - more resources
Full Text Sources
Other Literature Sources
Research Materials
