Integrated transcriptomics and metabolomics analysis to characterize cold stress responses in Nicotiana tabacum - PubMed (original) (raw)
Integrated transcriptomics and metabolomics analysis to characterize cold stress responses in Nicotiana tabacum
Jingjing Jin et al. BMC Genomics. 2017.
Abstract
Background: CB-1 and K326 are closely related tobacco cultivars; however, their cold tolerance capacities are different. K326 is much more cold tolerant than CB-1.
Results: We studied the transcriptomes and metabolomes of CB-1 and K326 leaf samples treated with cold stress. Totally, we have identified 14,590 differentially expressed genes (DEGs) in CB-1 and 14,605 DEGs in K326; there was also 200 differentially expressed metabolites in CB-1 and 194 in K326. Moreover, there were many overlapping genes (around 50%) that were cold-responsive in both plant cultivars, although there were also many differences in the cold responsive genes between the two cultivars. Importantly, for most of the overlapping cold responsive genes, the extent of the changes in expression were typically much more pronounced in K326 than in CB-1, which may help explain the superior cold tolerance of K326. Similar results were found in the metabolome analysis, particularly with the analysis of primary metabolites, including amino acids, organic acids, and sugars. The large number of specific responsive genes and metabolites highlight the complex regulatory mechanisms associated with cold stress in tobacco. In addition, our work implies that the energy metabolism and hormones may function distinctly between CB-1 and K326.
Conclusions: Differences in gene expression and metabolite levels following cold stress treatment seem likely to have contributed to the observed difference in the cold tolerance phenotype of these two tobacco cultivars.
Keywords: Cold stress; Metabolome; Tobacco; Transcriptome.
Conflict of interest statement
Competing interests
The authors declare that they have no competing interests.
Publisher's Note
Springer Nature remains neutral with regard to jurisdictional claims in published maps and institutional affiliations.
Figures
Fig. 1
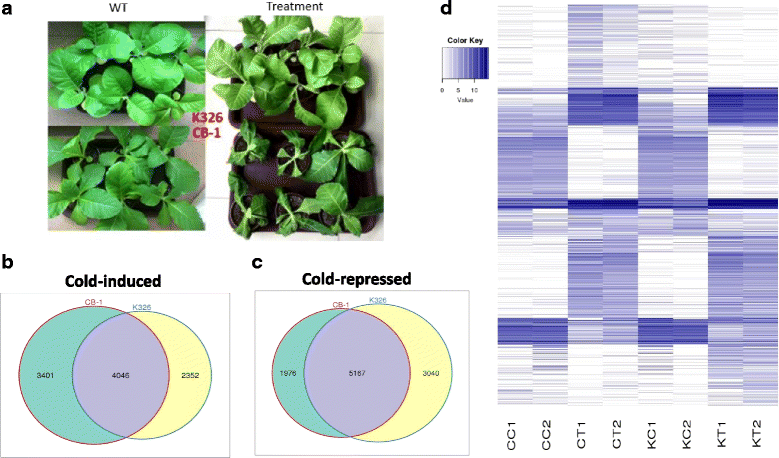
Overview of transcriptome analysis. a Phenotype for K326 and CB-1 under cold treatment. Left Panel: untreated plants; Right Panel: Plants after cold treatment. Up Panel: Wildtype and cold treated K326 plants; Down Panel: Wildtype and cold treated CB-1 plants. b Venn graph for CB-1 and K326 based on cold up-regulated (induced) genes. c Venn graph for CB-1 and K326 based on cold down-regulated (repressed) genes. d Heatmap of DEG expression in CC, CT, KC, and KT
Fig. 2
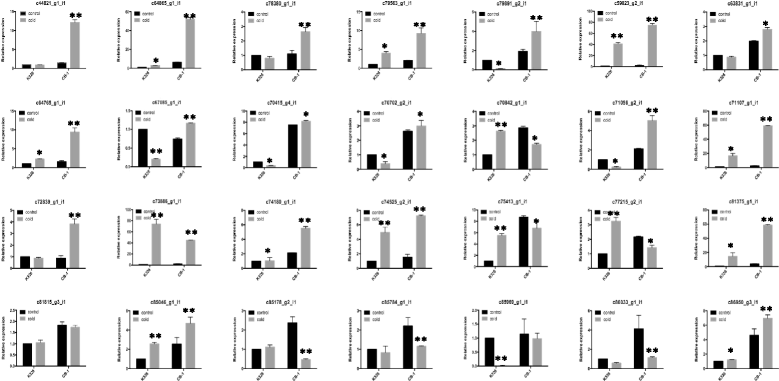
qRT-PCR analyses of unigenes. c44821_g1: MYB; c64865_g1: CRF6; c78380_g1: WRKY33; c79563_g1: DREB1D; c79891_g2: ERF109; c59823_g2: unknown; c63831_g1: ELF4; c64765_g1: DREB1F; c67085_g1: ARR6; c70415_g4: NFYB7; c70702_g2: DREB1B; c70842_g1: COR413; c71056_g1: DREB2H; c71107_g1: BHLH92; c72839_g1: ARR4; c73886_g1: DREB2A; c74180_g1: GAI; c74525_g2: ABR1; c75413_g1: RAV1; c77215_g2: unknown; c81375_g1: ERF053; c81815_g3: ARR14; c85046_g1: CMTA3; c85178_g2: AHK3; c85784_g1: HOS1; c85969_g1: AHK4; c86033_g1: ARR1; c86950_g3: SIZ1. ** means _p_-value < 0.01 between treatment and control; * means _p_-value < 0.05 between treatment and control
Fig. 3
Top 30 enriched pathways for overlapping cold responsive genes between K326 and CB-1
Fig. 4
Top 30 enriched pathways for specific cold responsive genes of CB-1 and K326. a Top 30 enriched pathways for CB-1 specific cold responsive genes. b Top 30 enriched pathways for K326 specific cold responsive genes
Fig. 5
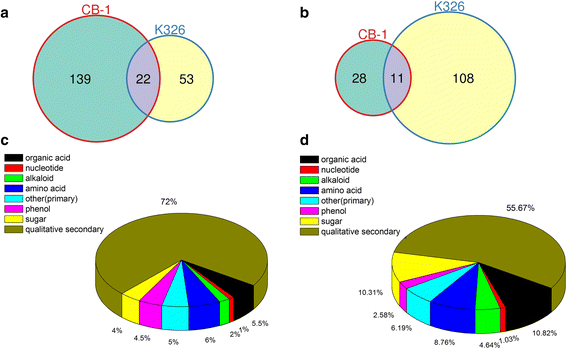
Classification of identified metabolites. a Venn graph for up-regulated differentially accumulated metabolites between CB-1 and K326. b Venn graph for down-regulated differentially accumulated metabolites between CB-1 and K326. c Pie graph for differentially accumulated metabolites in CB-1. d Pie graph for differentially accumulated metabolites in K326
Fig. 6
Different patterns for CB-1 and K326 based on the identified secondary metabolites. a Boxplot for ethylene levels in CC, CT, KC, and KT. b Boxplot for salicylic acid levels in CC, CT, KC, and KT. c Heatmap of differentially accumulated secondary metabolites for CC, CT, KC, and KT
Fig. 7
A parallel principal component analysis (PCA) of gene and metabolite profiles under cold treatment. Each point represents one experiments for gene expression and metabolite profiling. a PCA model for gene expression experiments. b PCA model for primary metabolite profiling. c PCA model for secondary metabolite profiling
Fig. 8
The energy metabolism through sugar and amino acids metabolic pathways under cold treatment. Red color represents the fold change between wild type and cold stress in CB-1. Blue color represents the fold change between wild type and cold stress in K326
Fig. 9
The levels of sugar metabolites and fatty acid metabolites. Y-axis represents the relative quantitate level of metabolites. a The relative metabolite levels for sugars. b The relative metabolite levels for fatty acids
Similar articles
- Metabolomic and transcriptomic analyses reveal differences in fatty acids in tobacco leaves across cultivars and developmental stages.
Chen Y, Wang S, He X, Gao J, Zhang X, Huang P, Yang X, Peng Y, Yu F, Li X, Pu W. Chen Y, et al. BMC Plant Biol. 2025 Mar 11;25(1):312. doi: 10.1186/s12870-025-06337-9. BMC Plant Biol. 2025. PMID: 40069610 Free PMC article. - Transcriptome-based gene regulatory network analyses of differential cold tolerance of two tobacco cultivars.
Luo Z, Zhou Z, Li Y, Tao S, Hu ZR, Yang JS, Cheng X, Hu R, Zhang W. Luo Z, et al. BMC Plant Biol. 2022 Jul 26;22(1):369. doi: 10.1186/s12870-022-03767-7. BMC Plant Biol. 2022. PMID: 35879667 Free PMC article. - Metabolomics combined with physiology and transcriptomics reveal how Nicotiana tabacum leaves respond to cold stress.
Song X, Wang H, Wang Y, Zeng Q, Zheng X. Song X, et al. Plant Physiol Biochem. 2024 Mar;208:108464. doi: 10.1016/j.plaphy.2024.108464. Epub 2024 Feb 28. Plant Physiol Biochem. 2024. PMID: 38442629 - Integrated transcriptomic and metabolomic analyses of yellow horn (Xanthoceras sorbifolia) in response to cold stress.
Wang J, Guo J, Zhang Y, Yan X. Wang J, et al. PLoS One. 2020 Jul 24;15(7):e0236588. doi: 10.1371/journal.pone.0236588. eCollection 2020. PLoS One. 2020. PMID: 32706804 Free PMC article. - Combined transcriptomic and metabolomic analyses uncover rearranged gene expression and metabolite metabolism in tobacco during cold acclimation.
Xu J, Chen Z, Wang F, Jia W, Xu Z. Xu J, et al. Sci Rep. 2020 Mar 23;10(1):5242. doi: 10.1038/s41598-020-62111-x. Sci Rep. 2020. PMID: 32251321 Free PMC article.
Cited by
- Transcriptomic and metabolomic profiling of strawberry during postharvest cooling and heat storage.
Zheng T, Lv J, Sadeghnezhad E, Cheng J, Jia H. Zheng T, et al. Front Plant Sci. 2022 Oct 12;13:1009747. doi: 10.3389/fpls.2022.1009747. eCollection 2022. Front Plant Sci. 2022. PMID: 36311118 Free PMC article. - ERF subfamily transcription factors and their function in plant responses to abiotic stresses.
Wu Y, Li X, Zhang J, Zhao H, Tan S, Xu W, Pan J, Yang F, Pi E. Wu Y, et al. Front Plant Sci. 2022 Nov 30;13:1042084. doi: 10.3389/fpls.2022.1042084. eCollection 2022. Front Plant Sci. 2022. PMID: 36531407 Free PMC article. Review. - Transcriptomics and metabolomics revealed that phosphate improves the cold tolerance of alfalfa.
Wang Y, Sun Z, Wang Q, Xie J, Yu L. Wang Y, et al. Front Plant Sci. 2023 Mar 9;14:1100601. doi: 10.3389/fpls.2023.1100601. eCollection 2023. Front Plant Sci. 2023. PMID: 36968379 Free PMC article. - Integrating transcriptomic and metabolomic analysis of hormone pathways in Acer rubrum during developmental leaf senescence.
Zhu C, Xiaoyu L, Junlan G, Yun X, Jie R. Zhu C, et al. BMC Plant Biol. 2020 Sep 3;20(1):410. doi: 10.1186/s12870-020-02628-5. BMC Plant Biol. 2020. PMID: 32883206 Free PMC article. - Higher Phytohormone Contents and Weaker Phytohormone Signal Transduction Were Observed in Cold-Tolerant Cucumber.
Salah R, Zhang RJ, Xia SW, Song SS, Hao Q, Hashem MH, Li HX, Li Y, Li XX, Lai YS. Salah R, et al. Plants (Basel). 2022 Apr 1;11(7):961. doi: 10.3390/plants11070961. Plants (Basel). 2022. PMID: 35406941 Free PMC article.
References
- Jeon J, Kim J. Cold stress signaling networks in Arabidopsis. Journal of Plant Biology. 2013;56(2):69–76. doi: 10.1007/s12374-013-0903-y. - DOI
Publication types
MeSH terms
Substances
LinkOut - more resources
Full Text Sources
Other Literature Sources
Molecular Biology Databases


