Mechanical cue-induced YAP instructs Skp2-dependent cell cycle exit and oncogenic signaling - PubMed (original) (raw)
Mechanical cue-induced YAP instructs Skp2-dependent cell cycle exit and oncogenic signaling
Wonyul Jang et al. EMBO J. 2017.
Abstract
Mechanical tensions are usually generated during development at spatially defined regions within tissues. Such physical cues dictate the cellular decisions of proliferation or cell cycle arrest. Yet, the mechanisms by which mechanical stress controls the cell cycle are not yet fully understood. Here, we report that mechanical cues function upstream of Skp2 transcription in human breast cancer cells. We found that YAP, the mechano-responsive oncogenic Hippo signaling effector, directly promotes Skp2 transcription. YAP inactivation induces cell cycle exit (G0) by down-regulating Skp2, causing p21/p27 to accumulate. Both Skp2 reconstitution and p21/p27 depletion can rescue the observed defect in cell cycle progression. In the context of a tissue-mimicking 3D culture system, Skp2 inactivation effectively suppresses YAP-driven oncogenesis and aberrant stiff 3D matrix-evoked epithelial tissue behaviors. Finally, we also found that the expression of Skp2 and YAP is positively correlated in breast cancer patients. Our results not only reveal the molecular mechanism by which mechanical cues induce Skp2 transcription, but also uncover a role for YAP-Skp2 oncogenic signaling in the relationship between tissue rigidity and cancer progression.
Keywords: YAP; Skp2; cancer; cell cycle; mechanical cue.
© 2017 The Authors.
Figures
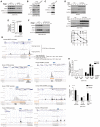
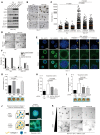
Figure 1. Mechanical stress and YAP regulate Skp2 expression
- Relative levels of Skp2 mRNA in MDA‐MB‐231 and MCF10A cells either adherent (Adh.) or suspended (Susp.) for 17 h in poly‐HEMA‐coated dishes as measured by qPCR (N = 3).
- Relative mRNA levels for the indicated genes in MCF10A cells seeded first as sparse (6 × 10³/cm2) or dense (2 × 10⁵/cm2) monolayers. Each density was then harvested after 2, 3, and 4 days for analysis by qPCR. CTGF and Cyr61 were used as positive controls that respond to mechanical cues (N = 3).
- Relative mRNA levels for the indicated genes in MCF10A cells grown on stiff (fibronectin‐coated plastic) or soft (acrylamide hydrogels of 0.7 kPa) substrates for 2 days, as measured by qPCR (N = 3).
- Relative mRNA levels for the indicated genes, as measured by qPCR, in MCF10A cells treated for 14 h with or without Lat. B (5 μM) or Y27632 (40 μM; N = 3).
- Immunoblots of RPE1, MCF10A, and MDA‐MB‐231 cells transfected with control siRNAs (siCTL) or YAP‐specific siRNAs (siYAP).
- Immunoblots with the indicated antibodies. At the indicated time points, whole‐cell lysates were taken from MDA‐MB‐231 cells transfected with the indicated siRNAs and treated with MG132 (10 μM).
- YAP depletion reduces Skp2 expression irrespective of cell cycle phase. (Above) Experimental protocol schematic. (Below) Immunoblots of cells treated with 100 ng/ml nocodazole (Noc) 30 h after siRNA transfection (siC: siControl, siY: siYAP) to arrest them in mitosis. Mitotic cells were then collected via a mechanical shake‐off. As a control, non‐transfected mitotic mock (Mo) cells were washed with PBS several times and released into early G1 (Noc. Rel.).
- Immunoblots of RPE1 and MCF10A cells expressing vector (Vec) or the indicated YAP mutants.
- (Left) Immunoblots of MDA‐MB‐231 cells stably expressing vector or active 5SA‐YAP that were incubated with cyclohexamide (CHX, 100 μg/ml) for the indicated times. (Right) Relative Skp2 immunoblot band intensity normalized to GAPDH.
- Skp2 staining of drug‐inducible 5SA‐YAP‐expressing MCF10A cells (Tet‐ON: 5SA‐YAP) in the absence or presence of doxycycline for 2 days. DAPI was used as a nuclear counterstain. Note that YAP activation increases Skp2 staining in individual nuclei. Scale bars: white (50 μm), yellow (20 μm).
Data information: All error bars indicate standard error of the mean (s.e.m.) from N independent experiments. Statistical significance, as determined by a two‐tailed _t_‐test, is indicated above each bar.
Figure EV1. YAP and TEAD directly promote Skp2 transcription in response to mechanical cues.
- Immunoblots with the indicated antibodies. At the indicated time points, whole‐cell lysates were taken from MCF10A cells transfected with the indicated siRNAs and treated with MG132 (10 μM).
- Immunoblots of MDA‐MB‐468 cells infected with retroviruses encoding an empty vector (Vec) or the indicated YAP mutant clones.
- Immunoblots of HeLa cells transduced with flag 5SA‐YAP via retroviral infection.
- Immunoblots of RPE1 (above) or MCF10A cells (below) stably expressing vector or 5SA‐YAP and incubated with cyclohexamide (CHX) for the indicated times. Relative Skp2 immunoblot band intensity normalized to β‐actin is also shown for MCF10A cells.
- Relative mRNA levels of the indicated genes, as determined by qPCR, from MDA‐MB‐231 cells transfected with control siRNAs or TEAD1/3/4‐specific siRNAs. Data were collected from seven independent experiments (N = 7).
- MDA‐MB‐231 cells were transfected with control siRNAs or TEAD1/3/4‐specific siRNAs. After 48 h, the cells were treated with MG132 (10 μM). Shown are immunoblots from whole‐cell lysates prepared at the indicated times with the indicated antibodies.
- Using the UCSC genome browser, we compared our own ChIP‐seq results with those of two published reports (Galli et al, 2015; Stein et al, 2015). We looked specifically at well‐known YAP targets including AMOTL2, CTGF, ANKRD1, Cyr61, KIBRA, TEAD4, and LATS2.
- Relative Skp2 and CTGF mRNA levels, as measured by qPCR, in MCF10A cells stably expressing vector or 5SA‐YAP and treated with Y27632 (20 μM, 14 h) or not (N = 3).
- Enrichment of endogenous YAP at TB2 in the Skp2 promoter in MCF10A cells cultured as sparse or highly dense monolayers, as determined by ChIP‐qPCR. The CTGF promoter (prmt) and the genomic region 3′ of the CTGF gene were used as positive (pos.ctl) and negative controls (neg.ctl), respectively (N = 2).
Data information: All error bars indicate s.e.m. Statistical significance, as determined by a two‐tailed _t_‐test, is indicated above each bar.
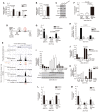
Figure 2. YAP and TEAD directly control mechanical cue‐dependent Skp2 transcription
- A
Relative mRNA levels for the indicated genes in MDA‐MB‐231 cells transfected with either control siRNAs or YAP‐specific siRNAs, as measured by qPCR (N = 3). - B
Relative Skp2 mRNA expression in MDA‐MB‐231 cells transduced with vector or 5SA‐YAP retroviruses (N = 6). - C
Immunoblots of MDA‐MB‐231 cells transfected with the indicated siRNAs. - D
Schematic depicting the human Skp2 promoter, which contains two TEAD‐binding motifs (TB1, TB2). White boxes indicate exons (Ex). - E
ChIP‐seq of the human Skp2 promoter. (Above) ChIP‐seq using a Flag‐specific antibody on Flag‐5SA‐YAP‐expressing MCF10A cells. Flag‐5SA‐YAP binds to TB1 and TB2 in the Skp2 promoter. (Below) ChIP‐seq using YAP‐ or TEAD1‐specific antibodies on the SF268 human glioblastoma cell line (Stein et al, 2015). Endogenous YAP and TEAD1 bind TB2 in the Skp2 promoter. - F
Enrichment of endogenous YAP at TB2 in the Skp2 promoter, as determined by ChIP‐qPCR. The genomic region 3′ of the CTGF or Skp2 genes were used as negative controls (neg. ctl; N = 3). - G
Enrichment of Flag‐tagged 5SA‐YAP or 5SA/94A‐YAP at TB2 in the Skp2 promoter, as determined by ChIP‐qPCR. The CTGF promoter (prmt) and the genomic region 3′ of the CTGF gene were used as positive (pos.ctl) and negative controls (neg.ctl), respectively (N = 3). - H
Luciferase reporter assays with a wild‐type TB2 sequence‐containing Skp2 promoter (TB2‐WT) or a mutant TB2‐containing promoter (CATTCC‐>AGAAAA; TB2‐Mut) in MCF10A cells stably expressing vector, 5SA‐YAP, or 5SA/94A‐YAP (N = 4). - I
MDA‐MB‐231 cells were transduced with the indicated retroviruses and suspended on poly‐HEMA‐coated dishes. Then, qPCR (above, N = 3) or immunoblotting (below) was performed at the indicated times. - J
MDA‐MB‐231 cells expressing vector or 5SA‐YAP were transfected with either control siRNAs or TEAD1/3/4‐specific siRNAs. After 2 days, the cells were suspended for the indicated times and harvested for qPCR analyses (N = 3). - K
Relative Skp2 and CTGF mRNA levels, as measured by qPCR, in MCF10A cells transduced with either vector or 5SA‐YAP retroviruses and then either non‐treated or treated with 5 μM Lat. B for 14 h (N = 3). - L, M
Enrichment of endogenous YAP at TB2 in the Skp2 promoter in MCF10A cells treated with either DMSO or Lat. B for 14 h (L) or suspended for 2 h (M), as determined by ChIP‐qPCR. The CTGF promoter (prmt) and the genomic region 3′ of the CTGF gene were used as positive (pos.ctl) and negative controls (neg.ctl), respectively.
Data information: All error bars indicate standard error of the mean (s.e.m.) from N independent experiments. Statistical significance, as determined by a two‐tailed _t_‐test, is indicated above each bar.
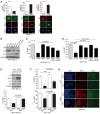
Figure 3. Skp2 is a gatekeeper for YAP depletion‐induced cell cycle exit
- (Above) Quantification of Ki67‐, p21‐, or p27‐positive cells among control and YAP‐depleted cells. > 150 cells were analyzed for each of three independent experiments. (Below) Representative immunofluorescence images of RPE1 cells transfected with control siRNAs or YAP‐specific siRNAs and stained with the indicated antibodies. DAPI was used as a nuclear counterstain. Scale bars: 20 μm.
- Immunoblots of MDA‐MB‐231 cells transfected with the indicated siRNAs.
- BrdU incorporation assays (1 h) on cells prepared as in (B). BrdU status was determined via immunofluorescence with a BrdU‐specific antibody and DAPI staining. > 600 cells were analyzed for each of four independent experiments.
- MCF10A cells prepared as in (B). Ki67‐positive cells were quantified by immunofluorescence with a Ki67‐specific antibody and DAPI staining. > 500 cells were analyzed in each of three independent experiments.
- (Above) Immunoblots of whole‐cell lysates from MDA‐MB‐231 cells 2 days after transduction with either vector or Skp2 lentiviruses and then transfection with either control siRNAs or YAP‐specific siRNAs. (Below) BrdU incorporation assays (1 h) on cells prepared as described above. > 600 cells were analyzed for each of three independent experiments.
- MCF10A cells expressing either vector or Skp2 were transfected with the indicated siRNAs. After 1 h of BrdU incorporation, BrdU‐ and Ki67‐specific antibodies were used to quantify BrdU‐ or Ki67‐positive cells. > 400 cells were analyzed for each of three independent experiments.
- Representative images for (F). Scale bars: 50 μm.
Data information: All error bars indicate standard error of the mean (s.e.m.) for N independent experiments. Statistical significance, as determined by a two‐tailed _t_‐test, is indicated above each bar.
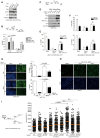
Figure 4. In a 2D culture system, Skp2 inhibition does not effectively suppress YAP‐driven cell proliferation or cell cycle reentry
- (Above) Immunoblots of MDA‐MB‐231 cells stably expressing vector or 5SA‐YAP and either serum‐starved or not. (Below) Identical plates of cells were incorporated with BrdU for 5 h, fixed, and stained with a BrdU‐specific antibody. > 1,500 cells were analyzed in each of three independent experiments.
- (Above) Schematic depicting the treatment regimens for the experiment below. (Below) Serum‐starved cells were incubated in either the indicated conditioned media or standard media containing 10% FBS for 1 day. BrdU‐positive cells were counted as described in (A). > 500 cells were analyzed in each of three independent experiments.
- (Above) MDA‐MB‐231 cells expressing 5SA‐YAP and either control shRNAs (shCTL) or Skp2‐specific shRNAs (shSkp2) were serum‐starved for 2 days. (Below) BrdU‐positive cells were then counted as described in (A). Mock indicates non‐transduced cells. > 1,500 cells were analyzed in each of three independent experiments.
- MCF10A cells stably expressing 5SA‐YAP and either control shRNAs (shCTL) or Skp2‐specific shRNAs (shSkp2 #1, #2) were analyzed as in (C). > 500 cells were analyzed in each of four independent experiments.
- MCF10A cells as in (D) were treated with Lat. B (5 μM) to trigger cytokinesis failure‐induced exit from the cell cycle. After 24 h, the cells were labeled with BrdU for 1 h. (Left) Representative images showing the continued proliferation of active YAP‐expressing cells even after cytokinesis failure (tetraploidy). Scale bars: 20 μm. (right) BrdU‐positive cell quantification. > 500 cells were analyzed in each of three independent experiments.
Data information: All error bars indicate standard error of the mean (s.e.m.) from N independent experiments. The significance, as determined by a two‐tailed _t_‐test, is indicated above each bar. N.S. indicates non‐significance.
Figure EV2. Inactivation of Skp2 does not effectively suppress YAP‐driven cell cycle control in a 2D culture system.
- Using the CRISPR‐Cas9 system, we generated control or Skp2 knockout MCF10A clones. These were further manipulated to generate the doxycycline‐inducible 5SA‐YAP expression system (Tet‐ON: 5SA‐YAP). Immunoblots confirmed both the Skp2 knockout and the function of the inducible 5SA‐YAP expression system.
- (Above) Experimental protocol schematic. (Below) Cells prepared as in (A) were treated with or without doxycycline for 2 days. Then, cells were either serum‐starved or not in the absence or presence of 2 days of doxycycline. After 1 h of BrdU incorporation, the BrdU‐positive cells were counted. > 500 cells were analyzed in each of three independent experiments.
- (Above) Experimental protocol schematic. Doxycycline‐inducible 5SA‐YAP‐expressing MCF10A cells were either serum‐starved or not. After 2 days, some cells were fixed and others were treated with doxycycline. After an additional 2 days, the cells were fixed and stained with a Ki67‐specific antibody and DAPI.
- Immunoblots of cells treated as in (C).
- Quantification of Ki67 positivity among cells treated as in (C). > 300 cells were analyzed for each of two independent experiments.
- Doxycycline‐inducible 5SA‐YAP‐expressing MDA‐MB‐231 cells treated as in (C) except for an additional 1 h of BrdU incorporation. > 300 cells were analyzed for each of two independent experiments.
- MCF10A cells were infected with lentiviruses encoding either vector or Skp2. The cells were then serum‐starved for 2 days to induce cell cycle exit. After 1 h BrdU incorporation, the cells were fixed and stained with BrdU‐ or Ki67‐specific antibodies. (Left) Representative cells stained for BrdU and counterstained with DAPI. Scale bars: 50 μm. (Right) Quantification of BrdU‐ or Ki67‐positive cells. > 800 cells were analyzed in each of three independent experiments.
- RPE1 cells were treated with DMSO or SZL P1‐41. After 48 h, cells were fixed and stained with a p27‐specific antibody and DAPI. Scale bars: 20 μm.
- (Left) Experimental protocol schematic. Doxycycline‐inducible 5SA‐YAP‐expressing cells were grown on 3D Matrigel for acinus formation. After arresting acinar growth 8 days later, one group was fixed and the other two were treated with or without doxycycline for 3 days before also being fixed. (Right) All fixed samples were visualized and quantified using phase contrast microscopy and the ImageJ program. Orange bars indicate the median. > 200 acini were analyzed for each of two independent experiments.
Data information: All error bars indicate s.e.m. Statistical significance, as determined by a two‐tailed _t_‐test, is indicated in the graph. N.S. indicates non‐significance.
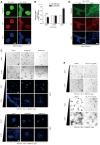
Figure 5. Skp2 depletion represses the formation of YAP‐driven tumor spheroid‐like acini and aberrant epithelial tissue behaviors in a 3D stiff matrix
- A
Immunoblots of MCF10A cells expressing vector or 5SA‐YAP and transduced with the indicated shRNA lentiviruses. - B
Mammary acini formation in MCF10A cells as in (A) grown on 3D Matrigel. After 17 days, acini were fixed and imaged using phase contrast microscopy. Images representative of two independent experiments are shown. Scale bars: 100 μm. - C
Quantification of individual acinar size for (B). Orange bars indicate the median. > 250 acini were analyzed for each of two independent experiments. - D
Mammary acini formation by MCF10A cells expressing vector or 5SA‐YAP and treated with dimethylsulfoxide (DMSO) or the Skp2 inhibitor SZP P1‐41 (20 μM). Acini were treated as in (B). Images representative of three independent experiments are shown. Scale bars: 50 μm. - E
Acini formed as in (B) immunostained with an E‐cadherin‐specific antibody (E‐Cad) and counterstained with DAPI. Representative single confocal images or serial _Z_‐stacks. Yellow arrows indicate lumen formation. Scale bars: 50 μm. - F
Acinar lumen formation as determined by analysis of serial _Z_‐stacks from (E). Irregular acini with ambiguous lumens were classified “Not determined”. Error bars indicate s.e.m. > 30 acini were analyzed for each of two independent experiments. - G
(Above) Glucose uptake was measured in adherent (Adh.) or suspended (Susp.) MCF10A cells expressing control or 5SA‐YAP using the Glucose Assay (GO) kit. (Below) Image depicting the color of the medium from cultures of the indicated cells. - H, I
Control or 5SA‐YAP‐expressing MCF10A cells infected by the indicated shRNA lentiviruses were suspended. After 20 h, glucose uptake (H) and lactate concentration (I) in the indicated cells were measured. Representative images depicting the color of the medium from cultures of the indicated cells (I, below). - J
Schematic depicting the basement membrane (BM; Matrigel) and collagen 1 (COL1)‐based BM/COL1 3D soft and stiff matrices as well as representative phalloidin‐stained images of MCF10A cells grown in each of them. Scale bars: 50 μm. - K
5SA‐YAP‐expressing MCF10A cells infected by the indicated shRNA lentiviruses were embedded in soft or stiff 3D BM/COL1 gels. After 7–8 days of growth, the cells were imaged by phase contrast. Images representative of four independent experiments are shown. Scale bars: 100 μm. See Fig EV4C.
Data information: All error bars indicate standard error of the mean (s.e.m.) from N independent experiments. The significance, as determined by a two‐tailed _t_‐test, is indicated above each bar. N.S. indicates non‐significance.
Figure EV3. YAP‐Skp2 axis affects aerobic glycolysis.
- A, B
MCF10A cells expressing vector or 5SA‐YAP were suspended with DMSO or LY294002 (50 μM) treatment. After 20 h, glucose uptake (A) and lactate production (B) were measured in the indicated cells. - C
Relative mRNA levels for the indicated genes in suspended MCF10A cells expressing control and 5SA‐YAP with the indicated shRNA lentiviruses, as measured by qPCR.
Data information: All error bars indicate s.e.m. Statistical significance, as determined by a two‐tailed _t_‐test, is indicated in the graph.
Figure EV4. Skp2 inactivation effectively suppreses YAP‐driven aberrant stiff 3D matrix‐evoked epithelial tissue behaviors.
- MCF10A cells were embedded in soft or stiff 3D BM/COL1 gels. After 8 days of growth, the cells were fixed and stained with phalloidin and a YAP‐specific antibody. DAPI was used as a nuclear counterstain. Images were taken by confocal microscopy. Scale bars: 50 μm.
- Relative mRNA levels for the indicated genes in MCF10A cells treated as in (A), as measured by qPCR. Error bars indicate standard error of the mean (s.e.m.) for four independent experiments. Statistical significance, as determined by a two‐tailed _t_‐test, is indicated in the graph. N.S. indicates non‐significance.
- Vector or 5SA‐YAP‐expressing MCF10A cells infected by the indicated shRNA lentiviruses were embedded in soft or stiff 3D BM/COL1 gels. After 7–8 days of growth, the cells were imaged by phase contrast (gray) or confocal microscopy (blue: DAPI). Scale bars: black, 100 μm; white, 50 μm.
- Empty vector‐ or 5SA‐YAP‐expressing MCF10A cells were embedded in stiff 3D BM/COL1 gels. After 7–8 days of growth, the cells were treated as in (A). Scale bars: 50 μm.
- Vector‐ or 5SA‐YAP‐expressing MCF10A cells were embedded with either DMSO or the Skp2 inhibitor SZL P1‐41 (20 μM) in soft or stiff 3D BM/COL1 gels. After 7–8 days of growth, the cells were fixed and imaged by phase contrast microscopy. Images are representative of three independent experiments. Scale bars: 100 μm.
Figure 6. Oncogenic functions of YAP‐induced Skp2
- A, B
Anchorage‐independent soft agar assays for vector‐ or 5SA‐YAP‐expressing MDA‐MB‐231 cells (A) or MCF10A cells (B) depleted with the indicated shRNA lentiviruses. After 21 days, colonies were stained with crystal violet and counted. Statistical significance, as determined by the one‐way ANOVA, is indicated above each bar. (A, below) Images representative of three independent experiments. Scale bars: 100 μm. - C
Primary mammosphere assays for vector‐ or 5SA‐YAP‐expressing MCF10A cells treated with SZL P1‐41 (SZL; 5 and 10 μM) or the same amount of DMSO (N = 2). - D
(Above) Primary mammosphere assays for MCF10A cells as prepared in (A). Statistical significance, as determined by a two‐tailed _t_‐test, is indicated above each bar. (Below) Images representative of four independent experiments. Scale bars: 150 μm.
Data information: All error bars indicate standard error of the mean (s.e.m.) from N independent experiments.
Figure 7. The YAP‐Skp2 axis does not seem to be conserved in mice
- Immunoblots of mouse or human cell lines transduced with vector‐ or 5SA‐YAP‐encoding retroviruses. Although 5SA‐YAP expression induces the expression of Ctgf, the best‐known Yap target gene, in both mouse and human cells, it only induces Skp2 expression in human cells.
- Immunoblot of Lats1−/− Lats2fl/fl MEFs infected with the indicated shRNA lentiviruses and transduced with or without Cre. The specificity of the antibody for mouse Skp2 was validated using Skp2 knockdown.
- Immunoblot of mouse cell lines transfected with the indicated siRNAs for 2 days.
- (Above) Experimental protocol schematic. (Below) immunoblots of MDA‐MB‐231 (left) or 4T1 cells (right) treated with 100 ng/ml nocodazole (Noc) 30 h after siRNA transfection (siC: siControl, siY: siYAP) to arrest them in mitosis. Mitotic cells were then collected via a mechanical shake‐off. As a control, non‐transfected mitotic mock (Mo) cells were washed with PBS several times and released into early G1 (Noc. Rel.).
- Immunoblot of 4T1 cells transfected with the indicated siRNAs for 2 days and then treated with MG132 for 4 h.
- Immunoblots of vector‐ or 5SA‐YAP‐expressing AML12 mouse cells placed in suspension for the indicated times.
- A sequence alignment of the region of the Skp2 promoter surrounding the TB2 TEAD‐binding consensus site for several mammalian species.
- TEAD‐binding motifs −5,000 to +5,000 bp from the TSS in the Skp2 promoter of the indicated species.
- Immunoblots of MDCK cells (a dog cell line) transduced with either vector‐ or 5SA‐YAP‐encoding retroviruses.
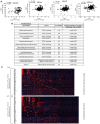
Figure 8. YAP expression and Skp2 expression are positively correlated in breast cancer patients
- Scatter plot comparing Skp2 and YAP mRNA expression from breast cancer patient microarrays (n = 159 for GSE1456; n = 508 for GSE25066; n = 198 for GSE7390; r = Pearson's correlation coefficient). See Fig EV5A.
- Heatmap analysis using cBioPortal showing Skp2 and YAP target gene sets in breast invasive carcinoma patients. Data are presented as fold change in Log2.
- Immunohistochemical analysis of tissues used for microarrays (TMA) from breast cancer patients using YAP‐ and Skp2‐specific antibodies. Representative images and statistical analysis of the tissue microarray data are shown. _P_‐value was calculated using the chi‐square test. Scale bars: 50 μm.
Figure EV5. Positive correlation of YAP and Skp2 expression in breast cancer patients.
- Scatter plot comparing Skp2 and YAP1 mRNA expression in breast cancer patient microarray data. r = Pearson's correlation coefficient.
- Summary and statistical analysis of the correlation between YAP and Skp2 mRNA expression in various cancer patients using cBioPortal.
- Heatmap analysis using cBioPortal showing Skp2 and YAP target gene sets in kidney renal clear cell carcinoma and brain lower‐grade glioma.
Comment in
- A forceful connection: mechanoregulation of oncogenic YAP.
Böttcher RT, Sun Z, Fässler R. Böttcher RT, et al. EMBO J. 2017 Sep 1;36(17):2467-2469. doi: 10.15252/embj.201797527. Epub 2017 Jul 19. EMBO J. 2017. PMID: 28724528 Free PMC article.
Similar articles
- Hippo Signaling Suppresses Cell Ploidy and Tumorigenesis through Skp2.
Zhang S, Chen Q, Liu Q, Li Y, Sun X, Hong L, Ji S, Liu C, Geng J, Zhang W, Lu Z, Yin ZY, Zeng Y, Lin KH, Wu Q, Li Q, Nakayama K, Nakayama KI, Deng X, Johnson RL, Zhu L, Gao D, Chen L, Zhou D. Zhang S, et al. Cancer Cell. 2017 May 8;31(5):669-684.e7. doi: 10.1016/j.ccell.2017.04.004. Cancer Cell. 2017. PMID: 28486106 Free PMC article. - SKP2- and OTUD1-regulated non-proteolytic ubiquitination of YAP promotes YAP nuclear localization and activity.
Yao F, Zhou Z, Kim J, Hang Q, Xiao Z, Ton BN, Chang L, Liu N, Zeng L, Wang W, Wang Y, Zhang P, Hu X, Su X, Liang H, Sun Y, Ma L. Yao F, et al. Nat Commun. 2018 Jun 11;9(1):2269. doi: 10.1038/s41467-018-04620-y. Nat Commun. 2018. PMID: 29891922 Free PMC article. - Simvastatin-induced cell cycle arrest through inhibition of STAT3/SKP2 axis and activation of AMPK to promote p27 and p21 accumulation in hepatocellular carcinoma cells.
Wang ST, Ho HJ, Lin JT, Shieh JJ, Wu CY. Wang ST, et al. Cell Death Dis. 2017 Feb 23;8(2):e2626. doi: 10.1038/cddis.2016.472. Cell Death Dis. 2017. PMID: 28230855 Free PMC article. - The Hippo transducers TAZ and YAP in breast cancer: oncogenic activities and clinical implications.
Maugeri-Saccà M, Barba M, Pizzuti L, Vici P, Di Lauro L, Dattilo R, Vitale I, Bartucci M, Mottolese M, De Maria R. Maugeri-Saccà M, et al. Expert Rev Mol Med. 2015 Jul 2;17:e14. doi: 10.1017/erm.2015.12. Expert Rev Mol Med. 2015. PMID: 26136233 Review. - YAP is essential for 3D organogenesis withstanding gravity.
Asaoka Y, Nishina H, Furutani-Seiki M. Asaoka Y, et al. Dev Growth Differ. 2017 Jan;59(1):52-58. doi: 10.1111/dgd.12338. Epub 2017 Jan 16. Dev Growth Differ. 2017. PMID: 28093734 Review.
Cited by
- Transient proliferation by reversible YAP and mitogen-control of the cyclin D1/p27 ratio.
Ferrick KR, Fan Y, Ratnayeke N, Teruel MN, Meyer T. Ferrick KR, et al. bioRxiv [Preprint]. 2024 Nov 4:2024.10.11.617852. doi: 10.1101/2024.10.11.617852. bioRxiv. 2024. PMID: 39416132 Free PMC article. Preprint. - YAP promotes global mRNA translation to fuel oncogenic growth despite starvation.
Hwang D, Baek S, Chang J, Seol T, Ku B, Ha H, Lee H, Cho S, Roh TY, Kim YK, Lim DS. Hwang D, et al. Exp Mol Med. 2024 Oct;56(10):2202-2215. doi: 10.1038/s12276-024-01316-w. Epub 2024 Oct 1. Exp Mol Med. 2024. PMID: 39349825 Free PMC article. - YAP/TAZ enhances P-body formation to promote tumorigenesis.
Shen X, Peng X, Guo Y, Dai Z, Cui L, Yu W, Liu Y, Liu CY. Shen X, et al. Elife. 2024 Jul 24;12:RP88573. doi: 10.7554/eLife.88573. Elife. 2024. PMID: 39046443 Free PMC article. - Hippo-YAP/TAZ signalling coordinates adipose plasticity and energy balance by uncoupling leptin expression from fat mass.
Choi S, Kang JG, Tran YTH, Jeong SH, Park KY, Shin H, Kim YH, Park M, Nahmgoong H, Seol T, Jeon H, Kim Y, Park S, Kim HJ, Kim MS, Li X, Bou Sleiman M, Lee E, Choi J, Eisenbarth D, Lee SH, Cho S, Moore DD, Auwerx J, Kim IY, Kim JB, Park JE, Lim DS, Suh JM. Choi S, et al. Nat Metab. 2024 May;6(5):847-860. doi: 10.1038/s42255-024-01045-4. Epub 2024 May 29. Nat Metab. 2024. PMID: 38811804 Free PMC article. - Targeting the Hippo pathway to prevent radioresistance brain metastases from the lung (Review).
Taylor J, Dubois F, Bergot E, Levallet G. Taylor J, et al. Int J Oncol. 2024 Jul;65(1):68. doi: 10.3892/ijo.2024.5656. Epub 2024 May 24. Int J Oncol. 2024. PMID: 38785155 Free PMC article. Review.
References
- Aragona M, Panciera T, Manfrin A, Giulitti S, Michielin F, Elvassore N, Dupont S, Piccolo S (2013) A mechanical checkpoint controls multicellular growth through YAP/TAZ regulation by actin‐processing factors. Cell 154: 1047–1059 - PubMed
- Cerami E, Gao J, Dogrusoz U, Gross BE, Sumer SO, Aksoy BA, Jacobsen A, Byrne CJ, Heuer ML, Larsson E, Antipin Y, Reva B, Goldberg AP, Sander C, Schultz N (2012) The cBio cancer genomics portal: an open platform for exploring multidimensional cancer genomics data. Cancer Discov 2: 401–404 - PMC - PubMed
MeSH terms
Substances
LinkOut - more resources
Full Text Sources
Other Literature Sources
Medical
Research Materials
Miscellaneous

