Cancer-associated fibroblasts induce metalloprotease-independent cancer cell invasion of the basement membrane - PubMed (original) (raw)
doi: 10.1038/s41467-017-00985-8.
Philipp Oertle 2, Pascale Mariani 3, Aleksandra Chikina 1, Fatima El Marjou 1, Youmna Attieh 1, Francois Zaccarini 1, Marick Lae 3, Damarys Loew 4, Florent Dingli 4, Philemon Sirven 5, Marie Schoumacher 1, Basile G Gurchenkov 1, Marija Plodinec 2 6, Danijela Matic Vignjevic 7
Affiliations
- PMID: 29030636
- PMCID: PMC5640679
- DOI: 10.1038/s41467-017-00985-8
Cancer-associated fibroblasts induce metalloprotease-independent cancer cell invasion of the basement membrane
Alexandros Glentis et al. Nat Commun. 2017.
Erratum in
- Author Correction: Cancer-associated fibroblasts induce metalloprotease-independent cancer cell invasion of the basement membrane.
Glentis A, Oertle P, Mariani P, Chikina A, El Marjou F, Attieh Y, Zaccarini F, Lae M, Loew D, Dingli F, Sirven P, Schoumacher M, Gurchenkov BG, Plodinec M, Vignjevic DM. Glentis A, et al. Nat Commun. 2018 Mar 7;9(1):1036. doi: 10.1038/s41467-018-03304-x. Nat Commun. 2018. PMID: 29515130 Free PMC article.
Abstract
At the stage of carcinoma in situ, the basement membrane (BM) segregates tumor cells from the stroma. This barrier must be breached to allow dissemination of the tumor cells to adjacent tissues. Cancer cells can perforate the BM using proteolysis; however, whether stromal cells play a role in this process remains unknown. Here we show that an abundant stromal cell population, cancer-associated fibroblasts (CAFs), promote cancer cell invasion through the BM. CAFs facilitate the breaching of the BM in a matrix metalloproteinase-independent manner. Instead, CAFs pull, stretch, and soften the BM leading to the formation of gaps through which cancer cells can migrate. By exerting contractile forces, CAFs alter the organization and the physical properties of the BM, making it permissive for cancer cell invasion. Blocking the ability of stromal cells to exert mechanical forces on the BM could therefore represent a new therapeutic strategy against aggressive tumors.Stromal cells play various roles in tumor establishment and metastasis. Here the authors, using an ex-vivo model, show that cancer-associated fibroblasts facilitate colon cancer cells invasion in a matrix metalloproteinase-independent manner, likely by pulling and stretching the basement membrane to form gaps.
Conflict of interest statement
The authors declare no competing financial interests.
Figures
Fig. 1
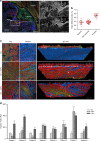
CAFs stimulate cancer cell invasion through the basement membrane. a Human colon carcinoma in situ. Basement membrane visualized by laminin staining (green), CAFs with αSMA (red), and DNA (DAPI, blue). Scale bar, 1000 µm. Boxed region was magnified; Invasive area showing accumulation of CAFs, and disorganization of the basement membrane. Scale bar, 200 µm. b Quantification of proportion of CAFs in human colon tissues: adjacent to the tumor (normal), non-invasive, and invasive carcinoma. Area occupied by CAFs was calculated as a ratio between αSMA and vimentin staining. For each patient five different areas were averaged. *p < 0.001, ANOVA, Krusskal–Wallis methods. c HCT116 colon cancer cells (CC) were cultured atop mouse mesenteric BM (top view) for 10 days, either alone or in the presence of NAFs or CAFs embedded in type I collagen matrix on the other side of the mesentery (bottom view). 3D view shows bottom part of the mesentery. Cells visualized by staining the actin cytoskeleton (phalloidin, red) and DNA (DAPI, green). The mesentery is detected by reflection (blue). Arrows show cancer cells and arrow heads show CAFs. Scale bars, 20 µm. d Quantification of cancer cell invasion through the mesenteric BM in the presence of NAFs or CAFs from eight different patients. The invasion index was calculated as the number of cancer cells per field on the underside of the BM. NAFs and CAFs from each patient are normalized to their respective controls. For each patient-derived CAFs and NAFs, and their respected controls about n = 5–12 fields were scored from one or two independent experiments. Mean ± s.e.m.***p < 0.0001; **p < 0.001; *p < 0.05; ANOVA, Dunn’s, or Holm–Sidak methods
Fig. 2
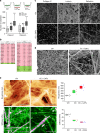
CAFs remodel the BM and stimulate cancer cell invasion. a Quantification of cancer cell invasion through mesenteric BM in the physical presence of CAFs (CAF PP) or their secreted molecules (CAF SM) from patients 1 and 3. Data are represented as box and whiskers (10–90 percentile) plus outliers. Data are presented from two independent experiments, n = 12 fields per condition. ***p < 0.0001; ANOVA, Dunn method used. b Manually selected list of ECM-related proteins present in higher (pink) or lower (green) amounts in CAFs from patients 1 and 2 compared with their paired NAFs. For each protein, fold change and _p_-value are presented. Peptide ratios with a _p_-value ≤ 0.05 are reported as significant. c Comparison of non-treated mesentery (Ctrl) and mesentery treated with HCT116 cancer cells and CAFs (CC + CAFs). Collagen IV and laminin networks were revealed using specific antibodies. ECM organization was evaluated by reflection microscopy. Scale bars, 20 µm. d Scanning electron micrographs showing non-treated mesentery (Ctrl) and mesentery treated with cancer cells and CAFs from patient 3 (CC + CAFs). Scale bars, 2 µm. e (Top) AFM quasi-height maps show roughness of non-treated mesentery (Ctrl) (color scale = 1.2 µm) and mesentery treated with cancer cells and CAFs from patient 3 (CC + CAFs) (color scale = 2.4 µm). Maps are 30 µm × 15 µm, n = 3–5 maps on one mesentery per condition from three independent experiments, dagger = p < 0.01, double dagger = p < 0.005, paired Student’s t test. (Bottom) AFM stiffness maps display sparse stiff fibers and many fibers with intermediate stiffness for the Ctrl condition, while in the CC + CAF condition, only few thick fibers appear, interspersed through an inhomogeneous soft mass. Color scales = 20–250 kPa, Maps are 30 µm × 15 µm, n = 3–5 maps on one mesentery per condition from three independent experiments. Dagger = p < 0.01, double dagger = p < 0.005, paired Student’s t test
Fig. 3
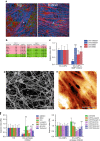
CAFs can stimulate cancer cell invasion in an MMP-independent manner. a HCT116 cancer cells co-cultured with CAFs on mouse mesentery for 10 days. Top view: CAFs (arrow head) breached the BM and migrated into the cancer cell (arrow) compartment. Bottom view: fibroblast compartment. Cells visualized by staining of the F-actin cytoskeleton (phalloidin, red) and DNA (DAPI, green). The basement membrane detected by reflection (blue). Scale bars, 20 µm. b Manually selected list of proteins with protease activity present in higher (pink) or lower (green) amounts in CAFs from patients 1 or 2 compared to their paired counterparts NAFs. For each protein, fold change and _p_-value are presented. c Quantification of cancer cell invasion through mesenteric BM in the presence of different drugs. For MMP inhibitor GM6001 and CAFs from patients 1 and 2, data from one experiment (n = 5–8 per condition) are presented. For MMP inhibitor BB94 and CAFs from patients 3 (n = 13–17 per condition) and 4 (n = 10–11 per condition), data are presented from three (patient 3) and two (patient 4) independent experiments. All conditions are reported to their respective controls. Mean ± s.e.m. ***p < 0.0001; **p < 0.001; *p < 0.05; pANOVA, Holm–Sidak method. d Scanning electron micrograph of cancer cell and CAF-modified BM in the presence of 10 µM BB94. Scale bar: 2 µm. e AFM quasi-height maps show roughness of mesentery cultured with cancer cells and CAFs, and treated with BB94. f Quantification of HCT116 cancer cell invasion through mesenteric BM in the presence of different drugs. Left: invasion of cancer cells cultured alone. Right: cancer cells cultured with CAFs. Data are presented from two independent experiments for Pepstatin A, Aprotinin, and Talabostat and three independent experiments for BB94. All conditions are reported to their respective controls. Mean ± s.e.m. ***p < 0.0001; **p < 0.001; *p < 0.05; pANOVA, Holm–Sidak method
Fig. 4
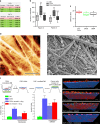
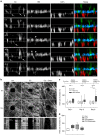
CAFs contractility is crucial to remodel the BM and make it permissive for cancer cell invasion. a Manually selected list of contractility-related proteins present in higher (pink) or lower (green) amounts in CAFs from patients 1 and 2 compared with their paired NAFs. For each protein, fold change and _p_-value are presented. Peptide ratios with a _p_-value ≤0.05 are reported as significant ratios. b Quantification of cancer cell invasion through the mesenteric BM in the presence of CAFs from patients 2 and 3 and the myosin II inhibitor Blebbistatin. Data are presented from two independent experiments (n = 11–13 fields per condition). Mean ± s.e.m. ***p < 0.0001; ANOVA, Holm–Sidak method. c Quantification of stiffness mesenteries remodeled by HCT116 cancer cells and CAFs extracted from patient 3. AFM maps are 30 µm × 15 µm, n = 3–5 maps on one mesentery per condition from three independent experiments. Dagger = p < 0.01, double dagger = p < 0.005, paired Student’s t test. d AFM quasi-height maps show roughness of mesentery cultured with cancer cells and CAFs, and treated with Blebbistatin. e Scanning electron micrograph of cancer cells and CAF-modified BM in the presence of Blebbistatin. Scale bar: 2 µm. f Invasion of cancer cells through CAF-modified BMs. BMs were modified with CAFs 2 for 7 days in the distant presence of cancer cells. CAFs were then killed to generate CAF-modified BM on which cancer cells were cultured for 5 days. GM6001 and Blebbistatin were added either during the CAF remodeling phase or during the cancer cell invasion phase. Right: 3D view showing cancer cells that have invaded mesentery in different conditions. Cells visualized by staining the actin cytoskeleton (phalloidin, red) and DNA (DAPI, green). Mesentery detected by reflection (blue). Scale bars: 20 µm. Left: quantification of cancer cell invasion of the non-modified (Ctrl) and CAF-modified BM. Blebbistatin or GM6001 were added either during the CAF remodeling phase (CAFs remodeling + drug) or during the cancer cell invasion phase (CC invasion + drug). Invasion of cancer cells normalized to Ctrl. N = 1–2, n = 5–13 per condition. Mean ± s.e.m. *p < 0.05; ANOVA, Dunn’s method
Fig. 5
CAFs exert physical forces on the BM to stimulate cancer cell invasion. a Time-lapse analysis of BM invasion. y/z resliced images of co-cultures of cancer cells expressing cytoplasmic GFP (green) and CAFs labeled by vital dye (red) over time (in hours). Mesentery revealed by reflection (cyan). Scale bars, 20 µm. Imaging started at 5 days of co-culture. Arrow head points to gaps in the BM. Arrows indicate cancer cell protrusions that extend into the BM and cancer cells translocated on the other side of the BM. Asterisks indicate CAFs that pull the BM. Dashed line guides for eye representing the BM borders. b CAFs widen already existing holes in the mesentery. Top: x/y projections of mouse mesentery revealed by reflection microscopy. Mesenteries were cultured for 3 days either without cells (Ctrl), with cancer cells, or with both cancer cells and CAFs 2. 100 µm2 holes were created in the mesentery using laser ablation at time 0. The size of the hole was followed over a period of 12 h. Scale bars, 20 µm. Bottom: kymograph showing the size of the hole over 12 h. c Increase in gap size after 12 h relative to the initial size of the hole at the beginning of the experiment performed on the control mesentery without any cells (Ctrl), cultured with cancer cells alone or with cancer cells and CAFs from patient 2. The ablation and measurements are taken after 1, 3, or 8 days of culture. Data from one (1 day culture) and two (3 and 8 days culture) independent experiments are presented, n = 5–14 per condition; *p < 0.05; ANOVA, Dunn’s method used. d Increase of the hole size after 12 h performed on the mesentery cultured with cancer cells and CAFs from patient 2 for 8 days in the presence of GM6001 and Blebbistatin, n = 4–7 fields per condition from one experiment. *p < 0.05; ANOVA, Shapiro–Wilk method used
Similar articles
- Significance of oral cancer-associated fibroblasts in angiogenesis, lymphangiogenesis, and tumor invasion in oral squamous cell carcinoma.
Lin NN, Wang P, Zhao D, Zhang FJ, Yang K, Chen R. Lin NN, et al. J Oral Pathol Med. 2017 Jan;46(1):21-30. doi: 10.1111/jop.12452. Epub 2016 May 27. J Oral Pathol Med. 2017. PMID: 27229731 - Role of metalloproteinases MMP-9 and MT1-MMP in CXCL12-promoted myeloma cell invasion across basement membranes.
Parmo-Cabañas M, Molina-Ortiz I, Matías-Román S, García-Bernal D, Carvajal-Vergara X, Valle I, Pandiella A, Arroyo AG, Teixidó J. Parmo-Cabañas M, et al. J Pathol. 2006 Jan;208(1):108-18. doi: 10.1002/path.1876. J Pathol. 2006. PMID: 16278822 - Synthesis and degradation of basement membranes and extracellular matrix and their regulation by TGF-beta in invasive carcinomas (Review).
Hagedorn HG, Bachmeier BE, Nerlich AG. Hagedorn HG, et al. Int J Oncol. 2001 Apr;18(4):669-81. doi: 10.3892/ijo.18.4.669. Int J Oncol. 2001. PMID: 11251160 Review. - Cancer-associated fibroblasts induce cancer cell apoptosis that regulates invasion mode of tumours.
Itoh G, Chida S, Yanagihara K, Yashiro M, Aiba N, Tanaka M. Itoh G, et al. Oncogene. 2017 Aug;36(31):4434-4444. doi: 10.1038/onc.2017.49. Epub 2017 Apr 3. Oncogene. 2017. PMID: 28368418 - Cancer-associated fibroblasts modulate growth factor signaling and extracellular matrix remodeling to regulate tumor metastasis.
Erdogan B, Webb DJ. Erdogan B, et al. Biochem Soc Trans. 2017 Feb 8;45(1):229-236. doi: 10.1042/BST20160387. Biochem Soc Trans. 2017. PMID: 28202677 Free PMC article. Review.
Cited by
- Development of cancer-associated fibroblasts-targeting polymeric nanoparticles loaded with 8-_O_-methylfusarubin for breast cancer treatment.
Rodponthukwaji K, Thongchot S, Deureh S, Thongkleang T, Thaweesuvannasak M, Srichan K, Srisawat C, Thuwajit P, Nguyen KT, Tadpetch K, Thuwajit C, Punnakitikashem P. Rodponthukwaji K, et al. Int J Pharm X. 2024 Oct 17;8:100294. doi: 10.1016/j.ijpx.2024.100294. eCollection 2024 Dec. Int J Pharm X. 2024. PMID: 39507587 Free PMC article. - Enhanced tumor control and survival in preclinical models with adoptive cell therapy preceded by low-dose radiotherapy.
Puebla-Osorio N, Fowlkes NW, Barsoumian HB, Xega K, Srivastava G, Kettlun-Leyton C, Nizzero S, Voss T, Riad TS, Wong C, Huang A, Hu Y, Mitchell J, Kim M, Rafiq Z, He K, Sezen D, Hsu E, Masrorpour F, Maleki A, Leuschner C, Cortez MA, Oertle P, Loparic M, Plodinec M, Markman JL, Welsh JW. Puebla-Osorio N, et al. Front Oncol. 2024 Oct 9;14:1407143. doi: 10.3389/fonc.2024.1407143. eCollection 2024. Front Oncol. 2024. PMID: 39445067 Free PMC article. - Tumor Cell Communications as Promising Supramolecular Targets for Cancer Chemotherapy: A Possible Strategy.
Alekseenko I, Zhukova L, Kondratyeva L, Buzdin A, Chernov I, Sverdlov E. Alekseenko I, et al. Int J Mol Sci. 2024 Sep 27;25(19):10454. doi: 10.3390/ijms251910454. Int J Mol Sci. 2024. PMID: 39408784 Free PMC article. Review. - Cancer-associated fibroblast cell surface markers as potential biomarkers or therapeutic targets in lung cancer.
Tokhanbigli S, Haghi M, Dua K, Oliver BGG. Tokhanbigli S, et al. Cancer Drug Resist. 2024 Sep 10;7:32. doi: 10.20517/cdr.2024.55. eCollection 2024. Cancer Drug Resist. 2024. PMID: 39403603 Free PMC article. Review.
References
Publication types
MeSH terms
Substances
LinkOut - more resources
Full Text Sources
Other Literature Sources
