Three-dimensional microCT imaging of murine embryonic development from immediate post-implantation to organogenesis: application for phenotyping analysis of early embryonic lethality in mutant animals - PubMed (original) (raw)
Three-dimensional microCT imaging of murine embryonic development from immediate post-implantation to organogenesis: application for phenotyping analysis of early embryonic lethality in mutant animals
Olga Ermakova et al. Mamm Genome. 2018 Apr.
Abstract
In this work, we applied three-dimensional microCT imaging to study murine embryogenesis in the range from immediate post-implantation period (embryonic day 5.5) to mid-gestation (embryonic day 12.5) with the resolution up to 1.4 µm/voxel. Also, we introduce an imaging procedure for non-invasive volumetric estimation of an entire litter of embryos within the maternal uterine structures. This method allows for an accurate, detailed and systematic morphometric analysis of both embryonic and extra-embryonic components during embryogenesis. Three-dimensional imaging of unperturbed embryos was performed to visualize the egg cylinder, primitive streak, gastrulation and early organogenesis stages of murine development in the C57Bl6/N mouse reference strain. Further, we applied our microCT imaging protocol to determine the earliest point when embryonic development is arrested in a mouse line with knockout for tRNA splicing endonuclease subunit Tsen54 gene. Our analysis determined that the embryonic development in Tsen54 null embryos does not proceed beyond implantation. We demonstrated that application of microCT imaging to entire litter of non-perturbed embryos greatly facilitate studies to unravel gene function during early embryogenesis and to determine the precise point at which embryonic development is arrested in mutant animals. The described method is inexpensive, does not require lengthy embryos dissection and can be applicable for detailed analysis of mutant mice at laboratory scale as well as for high-throughput projects.
Figures
Fig. 1
Maximum intensity projection (MIP) images of murine gravid uteri at different days after fertilization (p.c.) imaged with the 19 µm/voxel resolution. a Embryonic day 5.5, (E5.5); b embryonic day 6.5 (E6.5); c embryonic day 7.5 (E7.5); d embryonic day 8.5 (E8.5); e embryonic day 9.5 (E9.5). Arrows indicate maternal blood cells (MB) within developing decidua
Fig. 2
3D microCT analysis of murine immediate post-implantation development within conceptus at E5.5 and E6.5 days. a, b High-resolution (1.4 µm/voxel) 2D virtual sections of volume reconstructed microCT images of E5.5 murine conceptus with the embryo at egg cylinder stage, Theiler Stage (TS08); sagittal (a) and transverse (b) sections. c Histological analysis of E5.5 conceptus from the Atlas of Mouse Development (Kaufman 1999) page 24, panel a; 1 mesometrium; 2 remnant of uterine lumen; 3 zone of decidual reaction; 4 yolk sac cavity; 5 inner circular layer of myometrial smooth muscle; 6 outer longitudinal layer of myometrial smooth muscle; 7 egg cylinder stage embryo at centre of decidual reaction; 8 uterine glands. d High-resolution (1.4 µm/voxel) 2D virtual sagittal section of volume reconstructed microCT images of E6.5 conceptus with the embryo at advanced egg cylinder stage (TS09). e Schematic representation of the advanced egg cylinder stage embryo from The Atlas of Mouse Development (Kaufman 1999) page 12; Fig. 1a: 9 ectoplacental cone; 10 yolk sac cavity; 11 visceral endoderm; 12 parietal endoderm; 13 embryonic endoderm; 14 amniotic cavity; 15 intra-embryonic mesoderm. f Transverse 2D virtual section of the 3D reconstructed E6.5 murine conceptus. g Magnified transverse section from panel f. h Quantification of the volume occupied by the embryo within conceptus at E5.5 and E6.5 developmental days; Student’s t test **P < 0.005
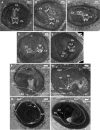
Fig. 3
Three-dimensional microCT imaging of murine gastrulation period. a–c Virtual 2D section derived from reconstructed volume of murine conceptuses imaged during gastrulation period (frontal view) with the resolution of 1.4 µm/voxel: E7.5, advanced TS10 (a) and E7.75 staged as TS11 (b–c). d–f Schematic representation of the embryonic development during stages of gastrulation from The Atlas of Mouse Development (Kaufman 1999), page 12, Fig. 1: proamniotic canal present (d); proamniotic canal closed (e) and presomite head fold embryo (f). g–i Sagittal 2D virtual sections of the embryos at different stages of gastrulation in correspondence to the schematic representation on the left; a, b, c; a’, b’, c’ and a”, b”, c” indicate the planes of the transverse sections. j–r. Transverse 2D virtual sections derived from the volume images of murine conceptuses (respective planes of the sectioning are indicated by small letters at the low-right corner). s–u Histological sections of the mouse embryo from The Atlas of Mouse Development aligned to 2D microCT image from adjacent left panel of the figure. s The Atlas of Mouse Development page 32 panel i; t page 34 panel n; r page 36 panel f. 1 ectoplacental cone; 2 yolk sac cavity; 3 visceral endoderm; 4 mesoderm; 5 embryonic ectoderm; 6 parietal endoderm; 7 proamniotic canal; 8 anterior amniotic fold; 9 posterior amniotic fold; 10 allantois; 11 ectoplacental cavity; 12 exocoelomic cavity; 13 amniotic cavity; 14 amnion; 15 chorion; 16 reichert’s membrane; 17 embryonic ectoderm and mesoderm; 18 embryonic endoderm; 19 ectoplacental cone; 20 intra-embryonic mesoderm; 21 neural groove; 22 neural ectoderm; 23 caudal region of notochordal plate; 24 primitive groove; hf head fold; MB maternal blood; YS yolk sac; EpC ectoplacental cone; Al allantois; UW uterine wall; ExC exocoelomic cavity; PC proamniotic canal
Fig. 4
3D imaging of embryonic post-implantation development. a–c 2D sections of the microCT produced volume images of the murine conceptus at E8.5 (TS12; 7 pairs of somites) with resolution of 3.9 µm/voxel: sagittal section (a); transverse view of the primitive head region (b); transverse view through the forming heart plane (c); transverse view of the somites and neural lumen (d). e, f 2D virtual sections of the murine conceptus at E8.75 (TS14; 14 pairs of somites) imaged at resolution 3.9 µm/voxel; sagittal (e) and coronal (f) views. g, h Virtual 2D sections through the volume image of the murine conceptus at E9.5 (TS15; 23 pairs of somites) imaged at 3.9 µm/voxel resolution; sagittal (g) and coronal (h) views. YS yolk sac; YsC yolk sac cavity; Al allantois; UW uterine wall; EpC ectoplacental cone; Am amnion; Hd head; CNt caudal notochord; DA dorsal aorta; NP neural plate; Ne neuroepithelium in prospective hindbrain; H heart; NL neural lumen; Sm somites; OV otic vesicle; HB hindbrain; MB midbrain; FB forebrain; NT neural tube; HD hindgut diverticulum; BA first branchial arch; BAA first branchial arch artery; UC umbilical cord
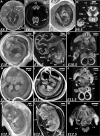
Fig. 5
Whole-uterus microCT imaging of the murine conceptuses from E8.5–E12.5 treated with potassium iodine contrast. a, b MicroCT derived volume image of the E8.5 (TS13; 8 pairs of somites) at 3.9 µm/voxel resolution. Virtual 3D volume rendering (a) and transverse section at the level of the forming embryonic head (b). c, d MicroCT derived volume of the E9.5 (TS15; 21 pairs of somites) conceptus imaged at 3.9 µm/voxel. Virtual 3D volume rendering (c) and transverse (d). e–g MicroCT derived volume image of the E10.5 (TS16-17) conceptus at 3.9 µm/voxel resolution: 3D volume rendering (e), sagittal (f) and transverse (g) 2D virtual sections. h–j Digital images of the E11.5 (TS18) conceptus imaged with the 4.4 µm/voxel resolution: 3D volume rendering (h); sagittal (i) and transverse (j) 2D virtual sections. k–m Digital images of the E12.5 (TS20) conceptus imaged with the 7.9 µm/voxel resolution: 3D volumes rendering (k); sagittal (l) and transverse (m) 2D virtual cross sections. YS yolk sac; H heart; Al allantois; UW uterine wall; EpC ectoplacental cone; Sm somites; Hd head; DA dorsal aorta; Am amnios; Hg hindgut; VA vitelline artery; BA branchial arch; BAA branchial arch artery; HV head vein; FV fourth ventricle; NT neuronal tube; FB forebrain vesicle; TV telencephalic vesicle; MV mesencephalic vesicle; HB hindbrain (roof); AC atrial chamber of heart; McBA mandibular component of first branchial arch; BC bulbus cordis; MgL midgut loop with the umbilical hernia; LS lumen of stomach; MB main bronchus; PRV primitive right ventricle; PLV primitive left ventricle; OP Olfactory pit; L liver; RA right atrium; LA left atrium; RV right ventricle; LV left ventricle; LaV lateral ventrical; Tr trachea; TM tongue muscles; J jaw (lower); GT genital tubercle
Fig. 6
Three-dimensional microCT imaging of embryo “turning” process in C57Bl6/N animals. a–e Transverse sections from the 3D volumes through the caudal and cephalic planes of embryos undergoing “turning” (3.9 µm/voxel resolution). “Unturned” embryo at E8.5 of development with 8 pairs of somites (a). Embryo initiated the rotation along the body axis; embryo with 10 pairs of somites (b); rotation proceed anticlockwise at this stage the embryo is rotated about 90°; embryo with 11 pairs of somites (c); and more than 100° embryo with 12 pairs of somites (d). The process of “turning” is almost completed and rotation close to 180° is observed; This embryo at E9.5 with 24 pairs of somites (e). f–i Coronal sections through the mid-trunk region of the volume reconstructed conceptuses presented to visualize positions of extra-embryonic membranes during turning. f, g Unturned embryo, the same as in panel a: volume rendering (f) and 2D view of the volume section (g). h, i Embryo is advanced in “turning”; the stage presented in panel d: volume rendering (h) and 2D view of the volume section (i). Ca caudal part of embryo; Ce cephalic part of embryo; EpC ectoplacental cone; NT neural tube; Nc notochord; Sm somites; Al allantois; Am amnion; YS yolk sac; H heart
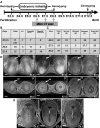
Fig. 7
Phenotyping analysis of embryonic lethality in Tsen54 null animals. a Schematic representation of phenotyping analysis performed to determine the interval of early embryonic lethality. The developmental window in which the embryonic lethality occurs is first determined by genotyping. The microCT imaging of the gravid uteri is performed to determined developmental window at which delayed embryos can be visualized. b Summary of the genotyping analysis performed on the littermates obtained from Tsen54 tm1b/+ heterozygous breeding (r in process of resorption). c Summary of the microCT imaging analysis of the pregnancies derived from the Tsen54 tm1b/+ heterozygous crosses. The embryos with the developmental delay are detected in mendelian ratio as early as E6.5 of development. d The representative microCT scans of normal and delayed embryos with the uterine tissues at resolution of the 19 µm/voxel: (a, b, c) volume images at indicated interval of the embryonic development (radiogram modality); (a’, b’, c’) 2D virtual cross sections of volume reconstructed gravid uteri. e The 2D cross sections from the reconstructed high-resolution volume images (1.4 µm/voxel) of the Tsen54 tm1b/tm1b null embryos at E6.5, E7.5 and E8.5 developmental days
Similar articles
- Ex utero mouse embryogenesis from pre-gastrulation to late organogenesis.
Aguilera-Castrejon A, Oldak B, Shani T, Ghanem N, Itzkovich C, Slomovich S, Tarazi S, Bayerl J, Chugaeva V, Ayyash M, Ashouokhi S, Sheban D, Livnat N, Lasman L, Viukov S, Zerbib M, Addadi Y, Rais Y, Cheng S, Stelzer Y, Keren-Shaul H, Shlomo R, Massarwa R, Novershtern N, Maza I, Hanna JH. Aguilera-Castrejon A, et al. Nature. 2021 May;593(7857):119-124. doi: 10.1038/s41586-021-03416-3. Epub 2021 Mar 17. Nature. 2021. PMID: 33731940 - High-resolution contrast-enhanced microCT reveals the true three-dimensional morphology of the murine placenta.
De Clercq K, Persoons E, Napso T, Luyten C, Parac-Vogt TN, Sferruzzi-Perri AN, Kerckhofs G, Vriens J. De Clercq K, et al. Proc Natl Acad Sci U S A. 2019 Jul 9;116(28):13927-13936. doi: 10.1073/pnas.1902688116. Epub 2019 Jun 27. Proc Natl Acad Sci U S A. 2019. PMID: 31249139 Free PMC article. - Three-dimensional microCT imaging of mouse development from early post-implantation to early postnatal stages.
Hsu CW, Wong L, Rasmussen TL, Kalaga S, McElwee ML, Keith LC, Bohat R, Seavitt JR, Beaudet AL, Dickinson ME. Hsu CW, et al. Dev Biol. 2016 Nov 15;419(2):229-236. doi: 10.1016/j.ydbio.2016.09.011. Epub 2016 Sep 23. Dev Biol. 2016. PMID: 27671873 Free PMC article. - Three-dimensional microCT imaging of mouse heart development from early post-implantation to late fetal stages.
Li-Villarreal N, Rasmussen TL, Christiansen AE, Dickinson ME, Hsu CW. Li-Villarreal N, et al. Mamm Genome. 2023 Jun;34(2):156-165. doi: 10.1007/s00335-022-09976-7. Epub 2023 Jan 3. Mamm Genome. 2023. PMID: 36595063 Free PMC article. Review. - Ex utero embryogenesis of non-human primate embryos and beyond.
Yao H, Sun N, Shao H, Wang T, Tan T. Yao H, et al. Curr Opin Genet Dev. 2023 Oct;82:102093. doi: 10.1016/j.gde.2023.102093. Epub 2023 Aug 11. Curr Opin Genet Dev. 2023. PMID: 37573834 Review.
Cited by
- Lentiviral in situ targeting of stem cells in unperturbed intestinal epithelium.
Garside GB, Sandoval M, Beronja S, Rudolph KL. Garside GB, et al. BMC Biol. 2023 Jan 11;21(1):6. doi: 10.1186/s12915-022-01466-1. BMC Biol. 2023. PMID: 36627630 Free PMC article. - An optimized workflow for microCT imaging of formalin-fixed and paraffin-embedded (FFPE) early equine embryos.
Handschuh S, Okada CTC, Walter I, Aurich C, Glösmann M. Handschuh S, et al. Anat Histol Embryol. 2022 Sep;51(5):611-623. doi: 10.1111/ahe.12834. Epub 2022 Jul 18. Anat Histol Embryol. 2022. PMID: 35851500 Free PMC article. - Expression and function of PDGF-C in development and stem cells.
Tian Y, Zhan Y, Jiang Q, Lu W, Li X. Tian Y, et al. Open Biol. 2021 Dec;11(12):210268. doi: 10.1098/rsob.210268. Epub 2021 Dec 1. Open Biol. 2021. PMID: 34847773 Free PMC article. Review. - 3DMOUSEneST: a volumetric label-free imaging method evaluating embryo-uterine interaction and decidualization efficacy.
Savolainen A, Kapiainen E, Ronkainen VP, Izzi V, Matzuk MM, Monsivais D, Prunskaite-Hyyryläinen R. Savolainen A, et al. Development. 2024 Aug 15;151(16):dev202938. doi: 10.1242/dev.202938. Epub 2024 Aug 29. Development. 2024. PMID: 39023143 Free PMC article. - Mouse embryo phenotyping using X-ray microCT.
Handschuh S, Glösmann M. Handschuh S, et al. Front Cell Dev Biol. 2022 Sep 16;10:949184. doi: 10.3389/fcell.2022.949184. eCollection 2022. Front Cell Dev Biol. 2022. PMID: 36187491 Free PMC article. Review.
References
- Downs KM, Davies T. Staging of gastrulating mouse embryos by morphological landmarks in the dissecting microscope. Development. 1993;118(4):1255–1266. - PubMed
Publication types
MeSH terms
Grants and funding
- Progetto d'Interesse Strategico Invecchiamento 2012-2016/Consiglio Nazionale delle Ricerche/International
- 223263/FP7 Health/International
- 261492/FP7 Health/International
- 18931/FP6-LIFESCIHEALTH/International
LinkOut - more resources
Full Text Sources
Other Literature Sources
Molecular Biology Databases


