Hedgehog-YAP Signaling Pathway Regulates Glutaminolysis to Control Activation of Hepatic Stellate Cells - PubMed (original) (raw)
Hedgehog-YAP Signaling Pathway Regulates Glutaminolysis to Control Activation of Hepatic Stellate Cells
Kuo Du et al. Gastroenterology. 2018 Apr.
Abstract
Background & aims: Cirrhosis results from accumulation of myofibroblasts derived from quiescent hepatic stellate cells (Q-HSCs); it regresses when myofibroblastic HSCs are depleted. Hedgehog signaling promotes transdifferentiation of HSCs by activating Yes-associated protein 1 (YAP1 or YAP) and inducing aerobic glycolysis. However, increased aerobic glycolysis alone cannot meet the high metabolic demands of myofibroblastic HSCs. Determining the metabolic processes of these cells could lead to strategies to prevent progressive liver fibrosis, so we investigated whether glutaminolysis (conversion of glutamine to alpha-ketoglutarate) sustains energy metabolism and permits anabolism when Q-HSCs become myofibroblastic, and whether this is controlled by hedgehog signaling to YAP.
Methods: Primary HSCs were isolated from C57BL/6 or Smoflox/flox mice; we also performed studies with rat and human myofibroblastic HSCs. We measured changes of glutaminolytic genes during culture-induced primary HSC transdifferentiation. Glutaminolysis was disrupted in cells by glutamine deprivation or pathway inhibitors (bis-2-[5-phenylacetamido-1,2,4-thiadiazol-2-yl] ethyl sulfide, CB-839, epigallocatechin gallate, and aminooxyacetic acid), and effects on mitochondrial respiration, cell growth and migration, and fibrogenesis were measured. Hedgehog signaling to YAP was disrupted in cells by adenovirus expression of Cre-recombinase or by small hairpin RNA knockdown of YAP. Hedgehog and YAP activity were inhibited by incubation of cells with cyclopamine or verteporfin, and effects on glutaminolysis were measured. Acute and chronic liver fibrosis were induced in mice by intraperitoneal injection of CCl4 or methionine choline-deficient diet. Some mice were then given injections of bis-2-[5-phenylacetamido-1,2,4-thiadiazol-2-yl] ethyl sulfide to inhibit glutaminolysis, and myofibroblast accumulation was measured. We also performed messenger RNA and immunohistochemical analyses of percutaneous liver biopsies from healthy human and 4 patients with no fibrosis, 6 patients with mild fibrosis, and 3 patients with severe fibrosis.
Results: Expression of genes that regulate glutaminolysis increased during transdifferentiation of primary Q-HSCs into myofibroblastic HSCs, and inhibition of glutaminolysis disrupted transdifferentiation. Blocking glutaminolysis in myofibroblastic HSCs suppressed mitochondrial respiration, cell growth and migration, and fibrogenesis; replenishing glutaminolysis metabolites to these cells restored these activities. Knockout of the hedgehog signaling intermediate smoothened or knockdown of YAP inhibited expression of glutaminase, the rate-limiting enzyme in glutaminolysis. Hedgehog and YAP inhibitors blocked glutaminolysis and suppressed myofibroblastic activities in HSCs. In livers of patients and of mice with acute or chronic fibrosis, glutaminolysis was induced in myofibroblastic HSCs. In mice with liver fibrosis, inhibition of glutaminase blocked accumulation of myofibroblasts and fibrosis progression.
Conclusions: Glutaminolysis controls accumulation of myofibroblast HSCs in mice and might be a therapeutic target for cirrhosis.
Keywords: Fibrogenesis; Hippo Pathway; Liver Diseases; Metabolic Reprogramming.
Copyright © 2018 AGA Institute. Published by Elsevier Inc. All rights reserved.
Conflict of interest statement
Disclosures: The authors declare no conflicts of interest.
Figures
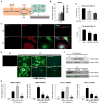
Figure 1. Glutaminolysis is induced during primary HSC activation
(A) Glutamine is converted into glutamate by glutaminase (Gls), and then into α-KG by GDH or transaminases (GOT2, GPT2) to fuel the TCA cycle and sustain ATP production and anabolism by supplying biosynthetic precursors for nucleic acids, amino acids (AA) and lipids. Glutaminolysis inhibitors include the Gls1 inhibitor CB-839 and BPTES, the GDH inhibitor EGCG, and the GOT2 and GPT2 inhibitor AOA. (B) Primary HSCs were isolated from adult mice (n=4 mice/experiment). A portion of the pooled isolate was harvested for Q-HSCs (Day 0; D0) and remaining cells were cultured for up to 7 days. At the indicated times, mRNA was analyzed using qRT-PCR. Results are expressed as mean ± SEM of 3–5 independent experiments. *p<0.05 vs D0. (C) Representative immunocytochemistry of α-SMA, Gls1 and DAPI staining. (D–G) Primary HSCs were cultured in complete medium containing both glucose (Glc) and glutamine (Gln) (Glc/Gln +/+) until day 4. In some cultures, medium was then replaced with Glc/Gln −/+ or Glc/Gln +/− medium, or supplemented with glutaminolysis inhibitors (CB-839, 0.3 μM or BPTES, 10 μM) or vehicle (0.1% DMSO). On day 7, cell growth was assessed by CCK8 assay and compared to Glc/Gln +/+ group or vehicle group (100%) (D), changes in α-SMA protein were assessed by ICC (E) and western blotting (F), and changes in mRNA expression were assessed by qRT-PCR (G). Bars represent mean ± SEM of n= 3–4 experiments. *p < 0.05 vs D0. #p < 0.05 vs Glc/Gln +/+ group or vehicle group on day 7.
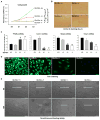
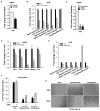
Figure 2. MF/HSCs are highly dependent on glutamine
Rat myofibroblastic HSCs (8B cells) were grown in conditional medium Glc/Gln ±/± for 3 days. (A) Cell growth determined by CCK8 assay at 450nm. (B) Lipid content assessed by Oil Red O staining on day 3. (C) Gene expression quantified by RT-PCR on day 3. (D) Collagen I expression assessed by ICC on day 3. (E) Cell migration determined by scratch/wound-healing assay. Bars represent mean ± SEM of n = 4–5 assays. *p < 0.05 vs Glc/Gln +/+ group; #p < 0.05 vs Glc/Gln −/+ group.
Figure 3. Inhibiting glutaminolysis suppresses myofibroblastic HSCs proliferative-myofibroblastic state
(A–C) Rat myofibroblastic HSCs (8B cells) were grown in complete medium treated with glutaminolysis inhibitors or vehicle (0.1% DMSO) for 3 days. Cells growing in Glc/Gln +/− medium were used as positive controls. Cell growth was determined by CCK8 assay. (D) Gene expression was quantified by qRT-PCR. (E) Collagen I expression was assessed by ICC. (F) Lipid accumulation was assessed by Oil Red O staining. (G) Cell migration was assessed by scratch/wound-healing assay. Bars represent mean ± SEM of n = 4–5 assays. *p < 0.05 vs vehicle group (0.1% DMSO).
Figure 4. Glutaminolysis sustains energy metabolism and anabolism of myofibroblastic HSCs
(A) Rat myofibroblastic HSCs (8B cells) were cultured in Glc/Gln +/+ or +/− or −/+ medium overnight. Oxygen consumption rate (OCR) was measured using a Seahorse XFp Analyzer. Bars represent mean ± SEM of triplicate assays. *p < 0.05 vs Glc/Gln +/+ group, #p < 0.05 vs Glc/Gln +/− group. (B) To measure the acute response of cells to glucose or glutamine, cells were cultured in Glc/Gln −/− medium overnight. Glucose or glutamine was then added back acutely and OCR was measured. Bars represent mean ± SEM of triplicate assays. *p < 0.05 vs Glc/Gln −/− group, #p < 0.05 vs Glc/Gln +/− group. (C) Cell growth assessed by CCK8 assay after 3 days culture in various medium conditions ± 4 mM dimethyl α-ketoglutarate (DKG). Bars represent mean ± SEM of n=4–5 assays. *p < 0.05 vs Glc/Gln +/+ group, #p < 0.05 vs DKG (−) group. (D) Lipid accumulation assessed by Oil Red O staining of cells described in (C).
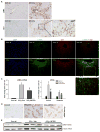
Figure 5. Glutaminolysis activates myofibroblastic HSCs in acute liver injury
Adult mice were injected intraperitoneally with corn oil vehicle or CCl4 (1200 mg/kg), and BPTES or its vehicle were injected at 6h and 30h post-CCl4 injection. (A) Representative Gls1 and α-SMA IHC stained liver sections. (B) Representative Gls1 and α-SMA co-immunofluorescence stained liver sections. (C) mRNA levels of α-SMA, Col1α1 and Vimentin determined by qRT-PCR. (D) Representative α-SMA stained liver sections. (E) Western blot for α-SMA using β-actin as the loading control. Bars represent mean ± SEM of n=4–6 mice/group. *p < 0.05 vs corn oil, #p < 0.05 vs CCl4+vehicle group.
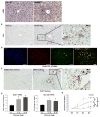
Figure 6. Glutaminolysis is induced in chronically-injured fibrotic livers
(A–B) Adult mice were injected intraperitoneally with corn oil or CCl4 (0.6 ml/kg) twice per week for 10 weeks; livers were harvested at 48h post last injection. Representative α-SMA and Gls1 IHC stained liver sections (A). Representative α-SMA and Gls1 co-immunofluorescence (B). (C–D) GLS1 IHC stained liver sections (C) and GLS1 and SLC1A5 mRNA expression (D) from healthy liver and NAFLD livers with different stages of liver fibrosis. Bars represent mean ± SEM of n=3–6 patients/group. *p < 0.05 vs fibrosis stage 0. (E) Human HSCs were grown in conditional Glc/Gln ±/± medium for 3 days. Cell growth was determined by CCK8 assay. Bars represent mean ± SEM of n = 4 assays. *p < 0.05 vs Glc/Gln +/+ group; #p < 0.05 vs Glc/Gln −/+ group.
Figure 7. Hedgehog-YAP signaling regulates glutaminolysis in MF/HSCs
(A) Primary HSCs isolated from Smoflox/flox mice were transduced with adenovirus harboring either GFP or Cre recombinase on culture day 4. Total RNA was harvested on day 7 and analyzed for Gls1 mRNAs by qRT-PCR. (B, E) Rat myofibroblastic HSCs (8B cells) were treated with cyclopamine or verteporfin or vehicle (0.1% DMSO) overnight. OCR was measured using a Seahorse XFp Analyzer. (C) Rat myofibroblastic HSCs were treated with YAP (YAPΔ1, YAPΔ2) or non-targeting control shRNA lentiviruses and analyzed for Gls1 mRNAs by qRT-PCR. (D) Rat myofibroblastic HSCs were treated with verteporfin or its vehicle (0.1% DMSO) for 72h. Gene expression was quantified by qRT-PCR. (F) Cell growth was assessed by CCK8 assay after 3 days culture in cyclopamine- or verteporfin- or vehicle-treated medium ± 4 mM dimethyl α-ketoglutarate (DKG). (E) Representative phase contrast images to illustrate growth differences ± DKG. Bars represent mean ± SEM of n = 4–5 assays. *p < 0.05 vs the GFP (A), scrambled (C), vehicle (0.1% DMSO) control (B, D, E, F). #p < 0.05 vs DKG (−) group (F).
Comment in
- YAPping About Glutaminolysis in Hepatic Fibrosis.
Harvey LD, Chan SY. Harvey LD, et al. Gastroenterology. 2018 Apr;154(5):1231-1233. doi: 10.1053/j.gastro.2018.03.007. Epub 2018 Mar 3. Gastroenterology. 2018. PMID: 29510133 Free PMC article. No abstract available. - Glutamine Breakdown as a Potential Metabolic Biomarker for Nonalcoholic Steatohepatitis.
Garcia Whitlock AE, Titchenell PM. Garcia Whitlock AE, et al. Cell Mol Gastroenterol Hepatol. 2020;10(1):195-196. doi: 10.1016/j.jcmgh.2020.03.001. Epub 2020 Mar 24. Cell Mol Gastroenterol Hepatol. 2020. PMID: 32220558 Free PMC article. No abstract available.
Similar articles
- Hedgehog controls hepatic stellate cell fate by regulating metabolism.
Chen Y, Choi SS, Michelotti GA, Chan IS, Swiderska-Syn M, Karaca GF, Xie G, Moylan CA, Garibaldi F, Premont R, Suliman HB, Piantadosi CA, Diehl AM. Chen Y, et al. Gastroenterology. 2012 Nov;143(5):1319-1329.e11. doi: 10.1053/j.gastro.2012.07.115. Epub 2012 Aug 8. Gastroenterology. 2012. PMID: 22885334 Free PMC article. - _Gli2_-regulated activation of hepatic stellate cells and liver fibrosis by TGF-β signaling.
Yan J, Hu B, Shi W, Wang X, Shen J, Chen Y, Huang H, Jin L. Yan J, et al. Am J Physiol Gastrointest Liver Physiol. 2021 May 1;320(5):G720-G728. doi: 10.1152/ajpgi.00310.2020. Epub 2021 Mar 17. Am J Physiol Gastrointest Liver Physiol. 2021. PMID: 33728992 - Hedgehog pathway activation and epithelial-to-mesenchymal transitions during myofibroblastic transformation of rat hepatic cells in culture and cirrhosis.
Choi SS, Omenetti A, Witek RP, Moylan CA, Syn WK, Jung Y, Yang L, Sudan DL, Sicklick JK, Michelotti GA, Rojkind M, Diehl AM. Choi SS, et al. Am J Physiol Gastrointest Liver Physiol. 2009 Dec;297(6):G1093-106. doi: 10.1152/ajpgi.00292.2009. Epub 2009 Oct 8. Am J Physiol Gastrointest Liver Physiol. 2009. PMID: 19815628 Free PMC article. - Mitochondria: A critical hub for hepatic stellate cells activation during chronic liver diseases.
Ezhilarasan D. Ezhilarasan D. Hepatobiliary Pancreat Dis Int. 2021 Aug;20(4):315-322. doi: 10.1016/j.hbpd.2021.04.010. Epub 2021 Apr 28. Hepatobiliary Pancreat Dis Int. 2021. PMID: 33975780 Review. - Wnt signaling in liver fibrosis: progress, challenges and potential directions.
Miao CG, Yang YY, He X, Huang C, Huang Y, Zhang L, Lv XW, Jin Y, Li J. Miao CG, et al. Biochimie. 2013 Dec;95(12):2326-35. doi: 10.1016/j.biochi.2013.09.003. Epub 2013 Sep 13. Biochimie. 2013. PMID: 24036368 Review.
Cited by
- Rotavirus rewires host cell metabolic pathways toward glutamine catabolism for effective virus infection.
Mitra S, Datta Chaudhuri R, Sarkar R, Banerjee S, Mukherjee A, Sharma R, Gope A, Kitahara K, Miyoshi SI, Chawla-Sarkar M. Mitra S, et al. Gut Microbes. 2024 Jan-Dec;16(1):2428425. doi: 10.1080/19490976.2024.2428425. Epub 2024 Nov 20. Gut Microbes. 2024. PMID: 39567865 Free PMC article. - Metabolic reprogramming and renal fibrosis: what role might Chinese medicine play?
Wang W, Dai R, Cheng M, Chen Y, Gao Y, Hong X, Zhang W, Wang Y, Zhang L. Wang W, et al. Chin Med. 2024 Oct 28;19(1):148. doi: 10.1186/s13020-024-01004-x. Chin Med. 2024. PMID: 39465434 Free PMC article. Review. - Causal relationship between circulating glutamine levels and idiopathic pulmonary fibrosis: a two-sample mendelian randomization study.
Xu T, Liu C, Ning X, Gao Z, Li A, Wang S, Leng L, Kong P, Liu P, Zhang S, Zhang P. Xu T, et al. BMC Pulm Med. 2024 Sep 13;24(1):451. doi: 10.1186/s12890-024-03275-4. BMC Pulm Med. 2024. PMID: 39272013 Free PMC article. - Ammonia-induced stress response in liver disease progression and hepatic encephalopathy.
Gallego-Durán R, Hadjihambi A, Ampuero J, Rose CF, Jalan R, Romero-Gómez M. Gallego-Durán R, et al. Nat Rev Gastroenterol Hepatol. 2024 Nov;21(11):774-791. doi: 10.1038/s41575-024-00970-9. Epub 2024 Sep 9. Nat Rev Gastroenterol Hepatol. 2024. PMID: 39251708 Review. - Mesenchymal stem cells-derived exosomes alleviate liver fibrosis by targeting Hedgehog/SMO signaling.
Zong R, Zheng Y, Yan Y, Sun W, Kong L, Huang Y, Liu Y, Jiang C, Ping J, Li C. Zong R, et al. Hepatol Int. 2024 Dec;18(6):1781-1791. doi: 10.1007/s12072-024-10717-y. Epub 2024 Aug 13. Hepatol Int. 2024. PMID: 39138757
References
- Angulo P, Machado MV, Diehl AM. Fibrosis in nonalcoholic Fatty liver disease: mechanisms and clinical implications. Semin Liver Dis. 2015;35:132–45. - PubMed
- Cairns RA, Harris IS, Mak TW. Regulation of cancer cell metabolism. Nat Rev Cancer. 2011;11:85–95. - PubMed
Publication types
MeSH terms
Substances
LinkOut - more resources
Full Text Sources
Other Literature Sources
Medical
Research Materials
Miscellaneous
