Quantifying Nucleation In Vivo Reveals the Physical Basis of Prion-like Phase Behavior - PubMed (original) (raw)
Quantifying Nucleation In Vivo Reveals the Physical Basis of Prion-like Phase Behavior
Tarique Khan et al. Mol Cell. 2018.
Erratum in
- Quantifying Nucleation In Vivo Reveals the Physical Basis of Prion-like Phase Behavior.
Khan T, Kandola TS, Wu J, Venkatesan S, Ketter E, Lange JJ, Gama AR, Box A, Unruh JR, Cook M, Halfmann R. Khan T, et al. Mol Cell. 2019 Feb 21;73(4):857. doi: 10.1016/j.molcel.2019.01.045. Mol Cell. 2019. PMID: 30794793 Free PMC article. No abstract available.
Abstract
Protein self-assemblies modulate protein activities over biological timescales that can exceed the lifetimes of the proteins or even the cells that harbor them. We hypothesized that these timescales relate to kinetic barriers inherent to the nucleation of ordered phases. To investigate nucleation barriers in living cells, we developed distributed amphifluoric FRET (DAmFRET). DAmFRET exploits a photoconvertible fluorophore, heterogeneous expression, and large cell numbers to quantify via flow cytometry the extent of a protein's self-assembly as a function of cellular concentration. We show that kinetic barriers limit the nucleation of ordered self-assemblies and that the persistence of the barriers with respect to concentration relates to structure. Supersaturation resulting from sequence-encoded nucleation barriers gave rise to prion behavior and enabled a prion-forming protein, Sup35 PrD, to partition into dynamic intracellular condensates or to form toxic aggregates. Our results suggest that nucleation barriers govern cytoplasmic inheritance, subcellular organization, and proteotoxicity.
Keywords: DAmFRET; amyloid; low-complexity sequences; nucleation barrier; phase transition; photoswitchable; prions; protein aggregation; proteotoxicity; supersaturation.
Copyright © 2018 Elsevier Inc. All rights reserved.
Figures
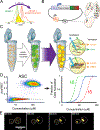
Figure 1.. Distributed Amphifluoric FRET (DAmFRET) reveals nucleation barriers to self-assembly in vivo.
(A) Proteins of interest were tagged to mEos3.1, which is photoconvertible by violet light and in a highly controlled and reproducible manner. (B) The 2μ-origin of the plasmid, along with strong selection enables variable and high copy numbers in a population of cells. The Gal promoter ensures high concentrations of protein in an inducible manner. (C) Cells were genetically engineered to undergo cell cycle arrest upon Gal induction, thereby eliminating propagation via cell division and ensuring each nucleation event is an independent one in a de facto closed reaction vessel. Non-collinearity of the 488 nm (in blue) and 561 nm (in green) lasers in the ImageStream®x MkII ensures that direct and sensitized emission (FRET) of the red molecules can be distinguished. See also Method S1. (D) DAmFRET plot of human ASC. The dashed line approximates the mean AmFRET value of cells expressing fully monomeric protein. The blue curve to the right represents the fit of the DAmFRET plot to a Weibull distribution (see Method Details). The parameter δ relates to the sharpness of the transition and describes the persistence of the low population with respect to concentration. The green and red curves represent hypothetical distributions with values of δ that are lower or higher, respectively, than that of the blue curve. (E) Montage of cells expressing ASC protein, showing switch-like acquisition of puncta. Images represent sum projection of confocal slices.
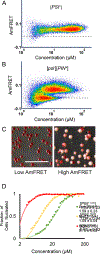
Figure 2.. Amyloid structure determines the persistence of the nucleation barrier with respect to concentration.
(A) DAmFRET plots of Sup35 PrD in cells with amyloids of endogenous Rnq1 ([PIN+]) and Sup35 ([PSI+]). (B) Same as (A), but without Sup35 amyloids ([_PSI_−]) (C) Representative images of colonies of cells from Sup35 colony color assay. Left and right panels show colonies grown from cells sorted from the low or high AmFRET populations, respectively, as shown in figure 2B. (D) Weibull fits of DAmFRET of Sup35 PrD in cells with different amyloid isoforms of endogenous Rnq1: [PIN+high], [PIN+medium], and [PIN+low]. The inset shows δ ± error. See also Fig. S2.
Figure 3:. Nucleation barriers govern prion behavior
(A) Fits of DAmFRET of known amyloid-forming yeast polypeptides that exhibit bimodal distributions. The inset shows δ ± error. All fits are of [PIN+] cells, except for Rnq1. See also Fig. S3 A, B. (B)SDD-AGE of Ngr1 PrL and Sla1 PrL in [PIN+] or [_pin_−] cells. Alternate lanes were intentionally left blank. See also Fig. S3C. (C) DAmFRET of sesA, showing a bimodal distribution characteristic of prions. (D) Representative images of ThT-stained cells expressing sesA, positive control Sup35 PrD in [PIN+] and negative control Sup35 PrD in [_pin_−]. (E) SDD-AGE of sesA in [PIN+] and [_pin_−] cells. The dashed line indicates the two adjacent lanesshown are spliced from different positions in the gel. See also Fig. S3D.
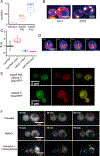
Figure 4.. A large nucleation barrier allows the archetypal prion protein, Sup35 PrD, to partition into physiological mRNP condensates
(A) Box-Whisker plot showing mean AmFRET of Sup35 PrD. The box is the SD of the mean, and the whiskers are the 5th and 95th percentiles of AmFRET values, for more than 2000 cells expressing between 80 and 200 μM of either unfused mEos3.1 (black) or Sup35 PrD in [_pin_−] (red) or [PIN+] cells (blue). See also Fig. S4A. (B) Representative confocal images of Sup35 PrD puncta in [_pin_−] (left) or [PIN+] cells (right). (C) Fluorescence recovery timescales of Sup35 PrD puncta in [_pin_−] cells as measured by FRAP. Error bars represent SD. (D) Time-lapse microscopy showing coalescence of Sup35 PrD puncta. Single confocal slice of a [_pin_−] cell expressing Sup35 PrD, showing two puncta (white arrows from 0–5 min) coalesce into one larger punctum (single arrow from 10 min). See also Fig. S4B. (E) Images of single confocal slices of cells co-expressing Sup35 PrD fused with mEos3.1 (and unfused mEos3.1 as control) and RFP-fused Dcp2 at 100X magnification. (F) Montage of cells expressing Sup35 PrD showing the formation of liquid droplets upon treatment with NaAsO2 (middle row) or antimycin + 2-deoxyglucose (bottom), versus untreated cells (top). See also Movies S2–4.
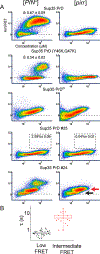
Figure 5.. Sup35 PrD mutants illuminate nucleation mechanisms in vivo
(A) DAmFRET plots of select mutants and scrambled sequence variants (of overall identical amino acid composition) of Sup35 PrD in [PIN+] and [_pin_−] cells. Boxes in the plots for #25 designate the region considered prion-positive, with the percentage of total cells indicated. See also Fig. S5A. The red and black arrows indicate the “intermediate” and “low” AmFRET populations, respectively, that were sorted for microscopy analyses. (B) Quantification of fluorescence recovery times after half-puncta photobleaching for low (n = 28 cells) and intermediate AmFRET (n = 18 cells) states of [_pin_−] cells expressing Sup35 PrD #24. Boxes cover the SE, while the square inside the box shows the mean and the line shows the median. Whiskers delineate the 5th and 95th percentiles. See also Fig. S5 C, D.
Figure 6.. Nucleation barriers enable proteotoxic assemblies to accumulate
(A) [_pin_-] cells harboring plasmids encoding the indicated proteins spotted as five-fold serial dilutions onto media with either galactose (inducing) or glucose (repressing). (B) Budding indices of cells expressing Sup35 PrD #24 or unfused mEos3.1 to the same intensity (5000 – 7000 AU). Solid red and checkered bars denote [_pin_-] and [PIN+] cells, respectively. The latter is divided into “high” (amyloid) and “low” (non-amyloid) AmFRET subpopulations. Shown are means of five experiments; error bars represent 95 % CI; ****, p<0.0001 (ANOVA).
Figure 7.. A conceptual framework to deconstruct nucleation barriers.
(A) Schematic intracellular protein phase diagram for Sup35, with concentration on x-axis and stress/acidity on y-axis (increasing from top to bottom). Blue shading also indicates concentration. The cell physiologically resides in the amyloid “A” regime, and yet endogenous Sup35 remains soluble over cellular timescales due to the large kinetic barrier to amyloid nucleation. Cells cross into the condensate “C” regime either upon exposure to stress (represented by travel downward) or upon experimental over-expression of Sup35 (horizontal travel). (B) Schematic intracellular protein phase diagram that distinguish the dispersed “D”, condensate “C”, and amyloid “A” phases. The phase space for amyloid encompasses that of condensation resulting in absence of the latter at equilibrium. For clarity, coexisting phases are not illustrated. (C) Energy landscape of phases as a function of the order parameters Density (on the x-axis) and Structural Order (on the y-axis) that distinguish the state of the protein within each phase. Contour lines describe free energy from low (blue) to high (red). Ridges between basins indicate nucleation barriers. In the absence of a pre-existing amyloid template in the cell, amyloid nucleation proceeds through metastable condensates, as illustrated by the arrow. (D) Condensates can also be so stable as to increase the barrier to amyloid nucleation. (E) Heterogeneous templates such as [PIN+] bias the conformational ensemble of dispersed species toward that of amyloid, leading to a reduced nucleation barrier for amyloid formation that enables nucleation without prior condensation.
Comment in
- A First Glimpse of Nucleation of Phase Transitions in Living Cells.
Posey AE, Pappu RV. Posey AE, et al. Mol Cell. 2018 Jul 5;71(1):1-3. doi: 10.1016/j.molcel.2018.06.028. Mol Cell. 2018. PMID: 29979961
Similar articles
- A viral expression factor behaves as a prion.
Nan H, Chen H, Tuite MF, Xu X. Nan H, et al. Nat Commun. 2019 Jan 21;10(1):359. doi: 10.1038/s41467-018-08180-z. Nat Commun. 2019. PMID: 30664652 Free PMC article. - Phase separation of a yeast prion protein promotes cellular fitness.
Franzmann TM, Jahnel M, Pozniakovsky A, Mahamid J, Holehouse AS, Nüske E, Richter D, Baumeister W, Grill SW, Pappu RV, Hyman AA, Alberti S. Franzmann TM, et al. Science. 2018 Jan 5;359(6371):eaao5654. doi: 10.1126/science.aao5654. Science. 2018. PMID: 29301985 - Nucleation seed size determines amyloid clearance and establishes a barrier to prion appearance in yeast.
Villali J, Dark J, Brechtel TM, Pei F, Sindi SS, Serio TR. Villali J, et al. Nat Struct Mol Biol. 2020 Jun;27(6):540-549. doi: 10.1038/s41594-020-0416-6. Epub 2020 May 4. Nat Struct Mol Biol. 2020. PMID: 32367069 Free PMC article. - The three faces of Sup35.
Lyke DR, Dorweiler JE, Manogaran AL. Lyke DR, et al. Yeast. 2019 Aug;36(8):465-472. doi: 10.1002/yea.3392. Epub 2019 Jul 1. Yeast. 2019. PMID: 30963611 Free PMC article. Review. - More than just trash bins? Potential roles for extracellular vesicles in the vertical and horizontal transmission of yeast prions.
Kabani M, Melki R. Kabani M, et al. Curr Genet. 2016 May;62(2):265-70. doi: 10.1007/s00294-015-0534-6. Epub 2015 Nov 9. Curr Genet. 2016. PMID: 26553335 Free PMC article. Review.
Cited by
- Protein assembly systems in natural and synthetic biology.
Chiesa G, Kiriakov S, Khalil AS. Chiesa G, et al. BMC Biol. 2020 Mar 26;18(1):35. doi: 10.1186/s12915-020-0751-4. BMC Biol. 2020. PMID: 32216777 Free PMC article. Review. - Mapping of Prion Structures in the Yeast Rnq1.
Galliamov AA, Malukhina AD, Kushnirov VV. Galliamov AA, et al. Int J Mol Sci. 2024 Mar 17;25(6):3397. doi: 10.3390/ijms25063397. Int J Mol Sci. 2024. PMID: 38542372 Free PMC article. - Functional constraints of wtf killer meiotic drivers.
Srinivasa AN, Campbell S, Venkatesan S, Nuckolls NL, Lange JJ, Halfmann R, Zanders SE. Srinivasa AN, et al. bioRxiv [Preprint]. 2025 Jan 9:2024.08.27.609905. doi: 10.1101/2024.08.27.609905. bioRxiv. 2025. PMID: 39677646 Free PMC article. Updated. Preprint. - A tool to dissect heterotypic determinants of homotypic protein phase behavior.
Kimbrough H, Jensen J, Weber C, Miller T, Maddera LE, Blanck JF, Babu VMP, Redwine WB, Halfmann R. Kimbrough H, et al. Protein Sci. 2025 Jul;34(7):e70194. doi: 10.1002/pro.70194. Protein Sci. 2025. PMID: 40521644 - The wtf4 meiotic driver utilizes controlled protein aggregation to generate selective cell death.
Nuckolls NL, Mok AC, Lange JJ, Yi K, Kandola TS, Hunn AM, McCroskey S, Snyder JL, Bravo Núñez MA, McClain M, McKinney SA, Wood C, Halfmann R, Zanders SE. Nuckolls NL, et al. Elife. 2020 Oct 27;9:e55694. doi: 10.7554/eLife.55694. Elife. 2020. PMID: 33108274 Free PMC article.
References
- Asherie N (2004). Protein crystallization and phase diagrams. Methods 34, 266–272. - PubMed
- Asherie N, Lomakin A, and Benedek GB (1996). Phase diagram of colloidal solutions. Phys. Rev. Lett 77, 4832–4835. - PubMed
Publication types
MeSH terms
Substances
LinkOut - more resources
Full Text Sources
Other Literature Sources
Miscellaneous


