Transcriptional programming of lipid and amino acid metabolism by the skeletal muscle circadian clock - PubMed (original) (raw)
. 2018 Aug 10;16(8):e2005886.
doi: 10.1371/journal.pbio.2005886. eCollection 2018 Aug.
Michaël Jean Hubert 1, Ashfaq Ali Mir 1, Stefano Ciciliot 2, Dominik Lutter 1, Franziska Greulich 1, Fabiana Quagliarini 1, Maximilian Kleinert 1, Katrin Fischer 1, Thomas Oliver Eichmann 3, Lauren Emily Wright 4, Marcia Ivonne Peña Paz 2, Alberto Casarin 5, Vanessa Pertegato 5, Vanina Romanello 2, Mattia Albiero 2, Sara Mazzucco 6, Rosario Rizzuto 4, Leonardo Salviati 5, Gianni Biolo 6, Bert Blaauw 2 4, Stefano Schiaffino 2, N Henriette Uhlenhaut 1 7
Affiliations
- PMID: 30096135
- PMCID: PMC6105032
- DOI: 10.1371/journal.pbio.2005886
Transcriptional programming of lipid and amino acid metabolism by the skeletal muscle circadian clock
Kenneth Allen Dyar et al. PLoS Biol. 2018.
Erratum in
- Correction: Transcriptional programming of lipid and amino acid metabolism by the skeletal muscle circadian clock.
PLOS Biology Staff. PLOS Biology Staff. PLoS Biol. 2018 Sep 26;16(9):e3000035. doi: 10.1371/journal.pbio.3000035. eCollection 2018 Sep. PLoS Biol. 2018. PMID: 30256783 Free PMC article.
Abstract
Circadian clocks are fundamental physiological regulators of energy homeostasis, but direct transcriptional targets of the muscle clock machinery are unknown. To understand how the muscle clock directs rhythmic metabolism, we determined genome-wide binding of the master clock regulators brain and muscle ARNT-like protein 1 (BMAL1) and REV-ERBα in murine muscles. Integrating occupancy with 24-hr gene expression and metabolomics after muscle-specific loss of BMAL1 and REV-ERBα, here we unravel novel molecular mechanisms connecting muscle clock function to daily cycles of lipid and protein metabolism. Validating BMAL1 and REV-ERBα targets using luciferase assays and in vivo rescue, we demonstrate how a major role of the muscle clock is to promote diurnal cycles of neutral lipid storage while coordinately inhibiting lipid and protein catabolism prior to awakening. This occurs by BMAL1-dependent activation of Dgat2 and REV-ERBα-dependent repression of major targets involved in lipid metabolism and protein turnover (MuRF-1, Atrogin-1). Accordingly, muscle-specific loss of BMAL1 is associated with metabolic inefficiency, impaired muscle triglyceride biosynthesis, and accumulation of bioactive lipids and amino acids. Taken together, our data provide a comprehensive overview of how genomic binding of BMAL1 and REV-ERBα is related to temporal changes in gene expression and metabolite fluctuations.
Conflict of interest statement
The authors have declared that no competing interests exist.
Figures
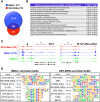
Fig 1. Genome-wide binding of clock transcription factors BMAL1 and REV-ERBα in mouse skeletal muscle.
(A) Overlap of BMAL1 and REV-ERBα “high confidence” peaks identified in gastrocnemius muscle from WT mice. (B) Functional enrichment analysis (GREAT) of 653 shared muscle BMAL1 and REV-ERBα peaks. (C) Aligned genome browser tracks showing binding of BMAL1, REV-ERBα, and RNAP2 at selected clock-associated transcriptional regulators. The left axis indicates sequence-tag counts. Arrow indicates a REV-ERBα-specific peak in the Per1 promoter. (D) Representative top-ranking motifs found in chromatin sites occupied by BMAL1 and REV-ERBα in vivo (selected from S2 Table). Underlying data can be found in supporting files S1 and S2 Tables, and at Gene Expression Omnibus (accession number GSE108650). ARE, androgen response element; bHLH, basic helix-loop-helix; BMAL1, brain and muscle ARNT-like protein 1; CLOCK, circadian locomotor output cycles kaput; DR1, direct repeat 1; DR2, direct repeat 2; FDR, false discovery rate; GO, Gene Ontology; GRE, glucocorticoid response element; GREAT, Genomic Regions Enrichment of Annotations Tool; IR3, inverted repeat 3; MEF2, myocyte enhancer binding factor 2; MGI, Mouse Genome Informatics; MSigDB, Molecular Signatures Database; MYF5, myogenic factor 5; MYOD, myoblast determination protein; MYOG, myogenin; NPAS2, neuronal PAS domain protein 2; PPARE, peroxisome proliferator–activated receptor response element; RNAP2, RNA polymerase II; RXR, retinoid X receptor; THRα, thyroid hormone receptor alpha; WT, wild type; ZT, Zeitgeber time.
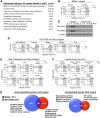
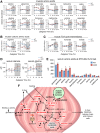
Fig 2. Transcriptional reprogramming of metabolic pathways in mKO muscles.
(A) REACTOME pathway enrichment analysis of 931 differentially expressed genes from mKO TA muscles. (B) Diurnal expression profiles of selected BMAL1-dependent circadian genes in TA determined by microarray and plotted as absolute expression levels (n = 3 × timepoint; mean ± SEM *p = 0.05, **p = 0.01, ***p = 0.001, 2-way ANOVA with Bonferroni correction). (C) Diurnal REV-ERBα and REV-ERBβ protein levels determined by western blot in vastus lateralis; GAPDH used as loading control. (D-F) Diurnal expression profiles in TA muscle of selected (D) REV-ERBα and HDAC3 target genes, (E) PPARα/δ-regulated mediators of lipid catabolism and oxidation, (F) GR-regulated mediators of protein turnover (n = 3 × timepoint; mean ± SEM *p = 0.05, **p = 0.01, ***p = 0.001, 2-way ANOVA with Bonferroni correction). (G) Venn diagram showing relative overlap and pathway enrichment of differentially regulated mKO genes with BMAL1 and REV-ERBα ChIP-seq peaks. Underlying data can be found in supporting files S1 Data, S1 Table, and at Gene Expression Omnibus (accession number GSE43071). BMAL1, brain and muscle ARNT-like protein 1; ChIP-seq, chromatin immunoprecipitation followed by next-generation sequencing; CLOCK, circadian locomotor output cycles kaput; GAPDH, glyceraldehyde 3-phosphate dehydrogenase; GR, glucocorticoid receptor; HDAC3, histone deacetylase 3; MAPK, mitogen-activated protein kinase; MEF2, myocyte enhancer binding factor 2; mKO, myocyte-specific loss of BMAL1; NFκB, nuclear factor kappa B; NPAS2, neuronal PAS domain protein 2; PPARα/δ, peroxisome proliferator–activated receptor alpha/delta; RORα, RAR-related orphan receptor alpha; TA, tibialis anterior; TGFβ, transforming growth factor beta; WT, wild type; ZT, Zeitgeber time.
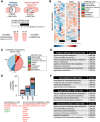
Fig 3. Global metabolite alterations associated with muscle-specific clock disruption.
(A) Experimental design showing integration of 24-hr metabolomics data with transcriptomics data from contralateral muscles. (B) Global 24-hr metabolomics of TA muscles from WT and mKO mice. Heatmap shows mean scaled abundance (n = 5 × timepoint × group) of detected metabolites across the light/dark cycle (white/black bar). Metabolites are sorted by phase according to WT muscle and aligned between groups to show effect in mKO. (C) Class distribution of metabolites significantly impacted by muscle-specific Bmal1 KO (genotype effect p < 0.05, mixed effects model). (D) Integrated pathway enrichment analysis combining metabolomics and transcriptomics data. (E) Class distribution of metabolites oscillating with a 24-hr period (p < 0.05, JTK_CYCLE; red = significantly increased in mKO muscles; green = significantly reduced). (F) Integrated pathway enrichment and topology analysis of 24-hr cycling metabolites. Underlying data can be found in supporting file S1 Data. KO, knockout; mKO, myocyte-specific loss of BMAL1; TA, tibialis anterior; WT, wild type; ZT, Zeitgeber hour.
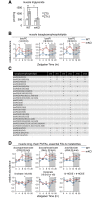
Fig 4. Impaired storage of neutral lipids and accumulation of bioactive lipids in mKO muscles.
(A) Muscle triglyceride extracted from gastrocnemius muscles, quantified by HPLC, and normalized to cell protein (mean ± SEM; n = 5 × group × timepoint; **p < 0.01, *p < 0.05, Student’s t test). (B) Diurnal variations of selected lysoglycerophospholipids in WT and mKO TA muscles (mean ± SEM; n = 5 × group × timepoint; *p < 0.05, repeated measures ANOVA). (C) Temporal distribution of significantly increased lysoglycerophospholipids comparing WT and mKO TA (+p < 0.05, Ŧ_p_ < 0.1, repeated measures ANOVA). (D) Diurnal variations of selected long-chain PUFAs, essential FAs, and related metabolites in WT and mKO TA muscles (mean ± SEM; n = 5 × group × timepoint; *p < 0.05, repeated measures ANOVA). Underlying data can be found in supporting files S1 Data and S3 Table. FA, fatty acid; HPLC, high-performance liquid chromatography; HODE, hydroxyoctadecadienoate; lysoPC, lysoglycerophosphocholine; lysoPE, lysoglycerophosphoethanolamine; lysoPI, lysoglycerophosphoinositol; mKO, myocyte-specific loss of BMAL1; PUFA, polyunsaturated fatty acid; TA, tibialis anterior; WT, wild type; ZT, Zeitgeber time.
Fig 5. Increased amino acids in mKO muscles linked to TCA cycle anaplerosis.
(A-C) Diurnal levels of selected amino acids (A), cationic amino acids (B), and TCA cycle intermediates (C) in WT and mKO TA muscles (mean ± SEM; n = 5 × group × time point; *p < 0.05, repeated measures ANOVA). (D) Serum alanine (genotype effect p < 0.05) and glycine (genotype effect p < 0.01) from ad libitum fed mice (mean ± SEM; n = 3–4; 2-way ANOVA with Bonferroni correction). (E) Serum amino acids at ZT8 after a 6-hr fast. (mean ± SEM; n = 3–4; *p < 0.05 Student’s t test). (F) Simplified scheme showing interrelationships between increased amino acids, purine nucleotides, and TCA cycle intermediates in mKO muscle (indicated by red text). Increased glycolytic flux in the context of impaired PDH activity [7] may divert glycolytic intermediates to alternative biosynthetic pathways, including serine, glycine, and alanine formation. Circadian metabolomics data also suggest mKO muscles undergo increased rates of protein turnover, increased formation and release of alanine and glycine, and increased anaplerotic flow of carbon into an expanded TCA cycle via citrate, fumarate, and malate. Underlying data can be found in supporting file S1 Data. 3PG, 3-phosphoglycerate; α-KG, alpha-ketoglutarate; AMP, adenosine monophosphate; GDP, guanosine diphosphate; GTP, guanosine triphosphate; mKO, myocyte-specific loss of BMAL1; PDH, pyruvate dehydrogenase; TA, tibialis anterior; TCA, tricarboxylic acid; WT, wild type; ZT, Zeitgeber time.
Fig 6. Increased lipid oxidative capacity yet reduced mitochondrial efficiency in mKO muscles.
(A) Diurnal levels of selected acylcarnitines in TA muscles (mean ± SEM; n = 5 × group × time point; *p < 0.05, repeated measures ANOVA). (B) Palmitate oxidation in gastrocnemius homogenates (mean ± SEM; n = 12–13; **p < 0.01, Student’s t test). (C) CS activity in vastus lateralis muscle extracts (mean ± SEM; n = 18). (D) Maximum catalytic activity of Respiratory Chain Complex I (NADH:ubiquinone oxidoreductase; n = 6), Complex II (succinate dehydrogenase; n = 18), Complex III (decylubiquinol cytochrome c oxidoreductase; n = 18), Complex II+III (succinate cytochrome c reductase; n = 18), and Complex IV (cytochrome c oxidase; n = 18) in vastus lateralis muscle extracts (mean% relative to WT ± SEM; ***p < 0.001, Student’s t test). (E) Real-time fluorescence of isolated flexor digitorum brevis muscle fibers loaded with TMRM and imaged every 60 s; data expressed relative to initial fluorescence; 5 μM Olm and 4 μM FCCP were added where indicated (mean ± SEM; n = 21–24 fibers isolated from 5 animals per group). (F) Diurnal levels of GSSG and GSH in mKO and WT TA muscles (mean ± SEM; n = 5 × group × time point; *p < 0.05, repeated measures ANOVA). (G) Diurnal expression in TA and SOL muscles determined by microarray and plotted as absolute expression levels (n = 3 × time point; mean ± SEM *p = 0.05, **p = 0.01, 2-way ANOVA with Bonferroni correction). Underlying data can be found in supporting files S1 Data and at Gene Expression Omnibus (accession number GSE43071). CS, citrate synthase; FCCP, carbonylcyanide-p-trifluoromethoxyphenyl hydrazone; GSH, reduced glutathione; GSSG, oxidized glutathione; mKO, myocyte-specific loss of BMAL1; Olm, oligomycin; SOL, soleus; TA, tibialis anterior; TMRM, tetramethylrhodamine methyl ester; WT, wild type.
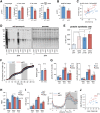
Fig 7. Muscle-specific loss of BMAL1 associated with fat-to-lean mass partitioning, increased rates of muscle protein synthesis, and increased EE.
(A-B) n = 11–12 mice; 5-mo-old male littermates; mean ± SEM; **p < 0.01, Student’s t test. (A) Normal bodyweight, increased percent lean mass, reduced percent fat mass, and increased lean-to-fat mass ratio in mKO mice. (B) About 30% reduced total body fat. (C) Increased muscle mass relative to bodyweight (TA; n = 44 five-mo-old male littermates; dashed line indicates mean trend line). (D-E) In vivo protein synthesis rates of TA measured by IV-SUnSET. (D) Representative image of western blot analysis for puromycin-labeled peptides followed by ponceau staining to verify equal protein loading. TA from a transgenic mouse with c.a.AKT was used as positive control. (E) Quantification of puromycin-labeled peptides expressed as a percentage of the values obtained in WT ZT4 (mean ± SEM; n = 10, ZT4; n = 5, ZT16; *p < 0.05, Student’s t test). (F-I) Effects of muscle-specific Bmal1 mKO on (F) food intake, (G) locomotor activity (X + Y axis counts and running wheel rotations), (H) RER (VCO2/VO2), and (I) EE all measured at thermoneutrality (30 °C). n = 10 four-mo-old male littermates; mean ± SEM; *p < 0.05, Student’s t test; ANCOVA genotype effect p = 0.046 (total EE) and p = 0.023 (dark phase EE) when considering body weight, lean mass, and fat mass as covariates. (J) Relationship between EE and lean mass at ZT16 (n = 10; dashed line indicates mean trend line). Underlying data can be found in supporting file S1 Data. BMAL1, brain and muscle ARNT-like protein 1; c.a.AKT, constitutively active AKT; EE, energy expenditure; IV-SUnSET, in vivo surface sensing of translation; mKO, myocyte-specific loss of BMAL1; n.s., not significant; RER, respiratory exchange ratio; TA, tibialis anterior; VCO2, volume carbon dioxide produced; VO2, volume oxygen consumed; WT, wild type; ZT, Zeitgeber time.
Fig 8. BMAL1 promotes diurnal muscle triglyceride synthesis by direct transcriptional activation of Dgat2.
(A) Diurnal expression profiles in TA muscles of selected key regulators of glycerophospholipid and triglyceride metabolism (n = 3 × time point; mean ± SEM *p < 0.05, **p < 0.01, ***p < 0.001, 2-way ANOVA with Bonferroni correction; see also S7A Fig). (B) Scheme showing alterations identified in mKO muscles related to reduced TG content and increased lysoPLs. Increased glycolytic flux in the context of impaired PDH activity [7] channels glycolytic intermediates to lysoPL biosynthesis. Red = increased gene expression or metabolite abundance in mKO relative to WT; green = reduced gene expression or abundance. (C) Validation of BMAL1 transcriptional targets by cotransfecting HEK-293T cells with LUC reporter constructs containing muscle BMAL1 binding sites from known and putative target promoters linked to LUC, along with expression plasmids for BMAL1 and CLOCK or empty control vector (pcDNA3). Data is expressed as mean fold-change normalized to the empty vector (n = 3; ±SEM). (D) In vivo BMAL1 occupancy at target sites in WT and mKO gastrocnemius at ZT4 and ZT16 (mean fold-enrichment over IgG ± SEM; n = 2 pooled biological replicates for each of 2 independent ChIP-qPCR experiments). Underlying data can be found in supporting file S1 Data and at Gene Expression Omnibus (accession number GSE43071). BMAL1, brain and muscle ARNT-like protein 1; ChIP-qPCR, chromatin immunoprecipitation–quantitative real-time PCR; CLOCK, circadian locomotor output cycles kaput; HEK-293T, human embryonic kidney 293T; IgG, immunoglobulin G; LUC, luciferase; lysoPL, lysoglycerophospholipid; mKO, myocyte-specific loss of BMAL1; PDH, pyruvate dehydrogenase; TA, tibialis anterior; WT, wild type; ZT, Zeitgeber time.
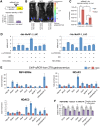
Fig 9. REV-ERBα controls muscle lipid and protein metabolism by directly repressing key regulators.
(A) Cotransfection of HEK-293T cells with empty control vector or mouse REV-ERBα expression plasmid, along with REV-ERB sensor (mBmal1::luc), containing 2 ROREs from the proximal promoter of Bmal1 linked to LUC. Data from 2 independent experiments are expressed as mean fold-change normalized to the empty vector (n = 6; ±SEM). (B) In vivo imaging of LUC activity in WT and mKO mouse TA muscles following electric pulse–mediated gene transfer of mBmal1::luc cotransfected either with empty vector or REV-ERBα expression plasmid. Imaging analysis was performed 3 d after gene transfer at ZT10 as described in Materials and methods. Pseudocolors overlaid on the image indicate the luminescence intensity from mBmal1::luc reporter gene activity as indicated by the scale bar radiance (photons/second/cm2/steradian). (C) Quantification of LUC activity in TA muscles normalized to mKate2, an exogenous spike-in control plasmid (mean ± SEM; n = 3 mice; *p < 0.05, **p < 0.01, ***p < 0.001, Student’s t test). (D) Cotransfection of HEK-293T cells with empty control vector, mouse REV-ERBα expression plasmid, mouse GR expression plasmid, or c.a.FOXO3A expression plasmid, along with GR:FOXO sensor containing −5 kb or −1 kb promoter sequence from mouse MuRF-1 linked to LUC. Data are expressed as mean fold-change normalized to the empty vector (n = 2–3; ±SEM). (E) In vivo REV-ERBα, NCoR1, and HDAC3 occupancy at target sites in control and mKO gastrocnemius at ZT8 (mean fold-enrichment over IgG ± SEM; n = 4 independent biological replicates from 4 independent ChIP-qPCR experiments; Foxl2 promoter used as negative control). (F) Gene expression (RT-qPCR) of mKO TA muscles at ZT10 following electric pulse-mediated gene transfer of REV-ERBα expression plasmids or empty vector. Data normalized to 36B4 expression and expressed as fold-change relative to contralateral muscle containing empty vector (mean ± SEM, n = 4 mice, *p < 0.05, Student’s t test). Underlying data can be found in supporting file S1 Data. BMAL1, brain and muscle ARTN-like protein 1; c.a.FOXO3A, constitutively active forkhead box O3; ChIP-qPCR, chromatin immunoprecipitation–quantitative real-time PCR; CLOCK, circadian locomotor output cycles kaput; GR, glucocorticoid receptor; HDAC3, histone deacetylase 3; HEK-293T, human embryonic kidney 293T; IgG, immunoglobulin G; LUC, luciferase; mKO, myocyte-specific loss of BMAL1; NCor1, nuclear receptor corepressor 1; PDH, pyruvate dehydrogenase; ROR, RAR-related orphan receptor; RORE, ROR response element; RT-qPCR, quantitative reverse transcription PCR; TA, tibialis anterior; ZT, Zeitgeber time.
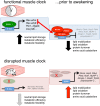
Fig 10. BMAL1- and REV-ERB-dependent programming of muscle metabolism.
Our integration of multiple “–omics” datasets indicates that the muscle clock may modulate diurnal fuel selection in anticipation of the feeding phase by direct BMAL1-dependent activation of genes promoting neutral lipid storage (Dgat2) and metabolic efficiency (Coq10b) while coordinating REV-ERB-mediated repression of a network of genes involved in lipid metabolism (Plin5, Acsl1, Ucp3, Pdk4) and muscle protein turnover (MuRF-1, Atrogin-1, polyubiquitin-C, Snat2). Muscle clock disruption causes loss of BMAL1-dependent activation and REV-ERB-dependent repression of target genes, resulting in a state of metabolic inefficiency characterized by increased lipid mobilization and oxidation and in increased protein turnover. BMAL1, brain and muscle ARNT-like protein 1; HDAC3, histone deacetylase 3; NCoR1, nuclear receptor corepressor 1; RORE, ROR response element.
Comment in
- Muscle circadian clock regulates lipid storage.
Leong I. Leong I. Nat Rev Endocrinol. 2018 Oct;14(10):563. doi: 10.1038/s41574-018-0089-y. Nat Rev Endocrinol. 2018. PMID: 30158550 No abstract available.
Similar articles
- The hepatic circadian clock regulates the choline kinase α gene through the BMAL1-REV-ERBα axis.
Gréchez-Cassiau A, Feillet C, Guérin S, Delaunay F. Gréchez-Cassiau A, et al. Chronobiol Int. 2015;32(6):774-84. doi: 10.3109/07420528.2015.1046601. Epub 2015 Jun 30. Chronobiol Int. 2015. PMID: 26125130 - Differential patterns in the periodicity and dynamics of clock gene expression in mouse liver and stomach.
Mazzoccoli G, Francavilla M, Pazienza V, Benegiamo G, Piepoli A, Vinciguerra M, Giuliani F, Yamamoto T, Takumi T. Mazzoccoli G, et al. Chronobiol Int. 2012 Dec;29(10):1300-11. doi: 10.3109/07420528.2012.728662. Epub 2012 Nov 6. Chronobiol Int. 2012. PMID: 23131081 - Identification of a novel circadian clock modulator controlling BMAL1 expression through a ROR/REV-ERB-response element-dependent mechanism.
Lee J, Lee S, Chung S, Park N, Son GH, An H, Jang J, Chang DJ, Suh YG, Kim K. Lee J, et al. Biochem Biophys Res Commun. 2016 Jan 15;469(3):580-6. doi: 10.1016/j.bbrc.2015.12.030. Epub 2015 Dec 12. Biochem Biophys Res Commun. 2016. PMID: 26692477 - The functional significance of the skeletal muscle clock: lessons from Bmal1 knockout models.
Schiaffino S, Blaauw B, Dyar KA. Schiaffino S, et al. Skelet Muscle. 2016 Oct 13;6:33. doi: 10.1186/s13395-016-0107-5. eCollection 2016. Skelet Muscle. 2016. PMID: 27752300 Free PMC article. Review. - Role of the clock gene Rev-erbα in metabolism and in the endocrine pancreas.
Vieira E, Merino B, Quesada I. Vieira E, et al. Diabetes Obes Metab. 2015 Sep;17 Suppl 1:106-14. doi: 10.1111/dom.12522. Diabetes Obes Metab. 2015. PMID: 26332975 Review.
Cited by
- The Circadian Clock and Obesity.
Sebti Y, Hebras A, Pourcet B, Staels B, Duez H. Sebti Y, et al. Handb Exp Pharmacol. 2022;274:29-56. doi: 10.1007/164_2021_579. Handb Exp Pharmacol. 2022. PMID: 35112237 - PRC2-EZH1 contributes to circadian gene expression by orchestrating chromatin states and RNA polymerase II complex stability.
Liu P, Nadeef S, Serag MF, Paytuví-Gallart A, Abadi M, Della Valle F, Radío S, Roda X, Dilmé Capó J, Adroub S, Hosny El Said N, Fallatah B, Celii M, Messa GM, Wang M, Li M, Tognini P, Aguilar-Arnal L, Habuchi S, Masri S, Sassone-Corsi P, Orlando V. Liu P, et al. EMBO J. 2024 Dec;43(23):6052-6075. doi: 10.1038/s44318-024-00267-2. Epub 2024 Oct 21. EMBO J. 2024. PMID: 39433902 Free PMC article. - Circadian rhythm, epigenetics and disease interaction.
Osum M, Kalkan R. Osum M, et al. Glob Med Genet. 2024 Nov 20;12(1):100006. doi: 10.1016/j.gmg.2024.100006. eCollection 2025 Mar. Glob Med Genet. 2024. PMID: 39925445 Free PMC article. Review. - Skeletal muscle p53-depletion uncovers a mechanism of fuel usage suppression that enables efficient energy conservation.
Lenihan-Geels G, Garcia Carrizo F, Leer M, Gohlke S, Oster M, Pöhle-Kronawitter S, Ott C, Chadt A, Reinisch IN, Galhuber M, Li C, Jonas W, Jähnert M, Klaus S, Al-Hasani H, Grune T, Schürmann A, Madl T, Prokesch A, Schupp M, Schulz TJ. Lenihan-Geels G, et al. J Cachexia Sarcopenia Muscle. 2024 Oct;15(5):1772-1784. doi: 10.1002/jcsm.13529. Epub 2024 Jul 15. J Cachexia Sarcopenia Muscle. 2024. PMID: 39010299 Free PMC article. - Integrated Amino Acids and Transcriptome Analysis Reveals Arginine Transporter SLC7A2 Is a Novel Regulator of Myogenic Differentiation.
Huang T, Zhou J, Wang B, Wang X, Xiao W, Yang M, Liu Y, Wang Q, Xiang Y, Lan X. Huang T, et al. Int J Mol Sci. 2023 Dec 20;25(1):95. doi: 10.3390/ijms25010095. Int J Mol Sci. 2023. PMID: 38203268 Free PMC article.
References
Publication types
MeSH terms
Substances
LinkOut - more resources
Full Text Sources
Other Literature Sources
Molecular Biology Databases
Research Materials
