The gut microbiota promotes hepatic fatty acid desaturation and elongation in mice - PubMed (original) (raw)
doi: 10.1038/s41467-018-05767-4.
Gerhard Liebisch 3, Thomas Clavel 4 5, Dirk Haller 5 6, Gabriele Hörmannsperger 5 6, Hongsup Yoon 5 6, Daniela Kolmeder 7, Alexander Sigruener 3, Sabrina Krautbauer 3, Claudine Seeliger 7, Alexandra Ganzha 7, Sabine Schweizer 7, Rosalie Morisset 7, Till Strowig 8, Hannelore Daniel 7, Dominic Helm 9, Bernhard Küster 9, Jan Krumsiek 10 11 12, Josef Ecker 13
Affiliations
- PMID: 30218046
- PMCID: PMC6138742
- DOI: 10.1038/s41467-018-05767-4
The gut microbiota promotes hepatic fatty acid desaturation and elongation in mice
Alida Kindt et al. Nat Commun. 2018.
Abstract
Interactions between the gut microbial ecosystem and host lipid homeostasis are highly relevant to host physiology and metabolic diseases. We present a comprehensive multi-omics view of the effect of intestinal microbial colonization on hepatic lipid metabolism, integrating transcriptomic, proteomic, phosphoproteomic, and lipidomic analyses of liver and plasma samples from germfree and specific pathogen-free mice. Microbes induce monounsaturated fatty acid generation by stearoyl-CoA desaturase 1 and polyunsaturated fatty acid elongation by fatty acid elongase 5, leading to significant alterations in glycerophospholipid acyl-chain profiles. A composite classification score calculated from the observed alterations in fatty acid profiles in germfree mice clearly differentiates antibiotic-treated mice from untreated controls with high sensitivity. Mechanistic investigations reveal that acetate originating from gut microbial degradation of dietary fiber serves as precursor for hepatic synthesis of C16 and C18 fatty acids and their related glycerophospholipid species that are also released into the circulation.
Conflict of interest statement
The authors declare no competing interests.
Figures
Fig. 1
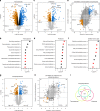
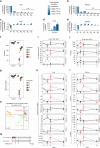
Transcriptomic, proteomic, and phosphoproteomic analyses of liver samples from SPF and GF mice. a Transcriptome data analyzed by _t_-tests, (n = 6/6). b KEGG pathway enrichment on transcriptome data. c Proteome data, analyzed by _t_-tests, (n = 5/5). d KEGG pathway enrichment in proteome data. e Transcriptome–proteome correlation. f GO enrichment analysis for biological processes of Q2 from e. g Phosphoproteome analyzed by _t_-tests, (n = 5/5). h Proteome–phosphoproteome comparison. i Venn diagram showing the overlap of detected genes, proteins, and phosphoproteins. e, h Q1, Q2, Q3, and Q4 mark the quadrants of the correlation plots; directed _p_-values are defined as–log10 (p) times the direction of the effect. b, d, f Red dots indicate lipid-related pathways. FDR: false discovery rate, GF: germfree, SPF: specific pathogen-free
Fig. 2
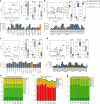
Quantitative lipidome analyses of liver and plasma from GF and SPF mice. Data from experiment 1 are shown (n = 6/6). Candidates verified in experiment 2 (SPF: n = 14; GF: n = 12) are displayed in blue (high in SPF) or orange (high in GF). a Total fatty acids (FA) in liver. b PC species in liver. c Total FA in plasma. d PC species in plasma. a–d Volcano plots: significance and log2 fold change in individual lipid species; boxplots: concentrations of saturated (SA), monounsaturated (MU), and polyunsaturated (PU) lipid species in GF and SPF mice; barplots: molecular lipid species profile of GF animals. In boxplots the thick lines represent the medians, the upper and lower lines of the boxes show the 25 and 75% quartiles and the whiskers are 1.5 times the interquartile range of the data. Error bars in the bar plots show the standard deviation. e Lipid class composition of liver samples, experiment 1. f Sphingolipid composition of liver samples, experiment 1. g Lipid class composition of plasma, experiment 1. GF: germfree, PC: phosphatidylcholine (diacyl), PC: O phosphatidylcholine (alkyl-acyl), SPF: specific pathogen-free, for other abbreviations, see Table 1
Fig. 3
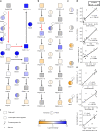
Reconstruction of FA metabolic pathways from multi-omics data and FA-glycerophospholipid species correlations. a Cellular de novo synthesis of palmitate, elongation to saturated and desaturation to monounsaturated FA. b Metabolism of _n_-3 and _n_-6 PUFA. (I–III) indicate the key processes altered in GF compared to SPF mice. c Transcription factors and regulators controlling a and b. d Correlation of product to precursor ratios with the appropriate gene or protein expression for reactions (II) and (III). e Correlation of FA species ratios with corresponding PC or LPC ratios for reactions (II) and (III). f Legend for the figure highlighting the strength and direction of the association for all molecular entities shown. FA: fatty acid, LPC: Lyso-PC, MUFA: monounsaturated fatty acids, PC: phosphatidylcholine, PUFA: polyunsaturated fatty acids, SAFA: saturated fatty acids, for other abbreviations, see Table 1
Fig. 4
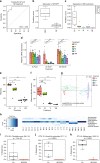
Effect of antibiotics on hepatic FA metabolism and association of cecal microbial species with FA metabolic consequences. SPF mice were treated with ampicillin (A, n = 6), metronidazole (M, n = 5), vancomycin (V, n = 6) or a combination of V and M (VM, n = 6). a Classification sensitivity and specificity of the calculated score separating GF and antibiotic-treated from the SPF mice. b Score for GF and SPF mice (GF: n = 5, SPF: n = 5) from a third experiment to validate the classification score. c Score for antibiotic-treated and untreated mice. d Relative mRNA expression of Fasn, Scd1, and Elovl5, mean and standard deviation are shown. e Alpha-diversity analysis shown as richness counts, and f Shannon effective counts. Samples from A-treated mice reproducibly generated too few sequences and thus could not be included in 16 S rRNA gene amplicon analysis. g Multidimensional scaling showing differences in the phylogenetic makeup of microbiota between samples (β-diversity) based on general UniFrac distances. h Microbiota composition at the phylum level. i-k Most significantly different OTUs after a Kruskal–Wallis analysis in untreated compared to antibiotics treated mice. N.S.: not significant, OTU: operational taxonomic unit. In boxplots the thick lines represent the medians, the upper and lower lines of the boxes show the 25 and 75% quartiles and the whiskers are 1.5 times the interquartile range of the data. In barplots the error bars show the standard deviation
Fig. 5
Fiber-derived FA 2:0 is precursor for hepatic synthesis of fatty acids and glycerophospholipids. SPF mice were supplemented with 13C-FA 2:0 via oral gavage with the indicated amount (n = 3/group), samples were taken 4 h after gavage. a Isotopologue distribution of FA 16:0 in liver and b plasma. c Fractional alterations (%) of M0, M1–M6 isotopologues relative to unlabeled control in liver and e plasma. d Fraction of de novo synthesized FA 16:0 in liver. SPF mice were treated for 2 days with VM (TP2), additional 2 (TP4) or 10 days (TP14) without antibiotics (n = 6/TP); control SPF mice did not receive antibiotics (n = 6/TP). f Alpha-diversity analysis shown as richness counts and g Shannon effective counts. h Multidimensional scaling showing differences in the phylogenetic makeup of microbiota between samples (β-diversity) based on general UniFrac distances. i Composition of major phylas determined in cecum content. j Portal vein SCFA levels. k Levels of selected MUFA, PUFA and MUPC in liver and l plasma. AB: antibiotics, Ac: acetate, VM: vancomycin in combination with metronidazole. Red dots and error bars in i–l indicate a significant difference (p < 0.05) between the control and VM group. m Experimental setup for the antibiotics experiment. In boxplots the thick lines represent the medians, the upper and lower lines of the boxes show the 25% and 75% quartiles and the whiskers are 1.5 times the interquartile range of the data. In barplots the error bars show the standard deviations. The dot plots in i–l show the mean and the standard deviation per group and condition
Similar articles
- Age-Related Changes in the Gut Microbiota Modify Brain Lipid Composition.
Albouery M, Buteau B, Grégoire S, Cherbuy C, Pais de Barros JP, Martine L, Chain F, Cabaret S, Berdeaux O, Bron AM, Acar N, Langella P, Bringer MA. Albouery M, et al. Front Cell Infect Microbiol. 2020 Jan 14;9:444. doi: 10.3389/fcimb.2019.00444. eCollection 2019. Front Cell Infect Microbiol. 2020. PMID: 31993375 Free PMC article. - Effects of perfluorinated fatty acids with different carbon chain length on fatty acid profiles of hepatic lipids in mice.
Kudo N, Yamazaki T, Sakamoto T, Sunaga K, Tsuda T, Mitsumoto A, Kawashima Y. Kudo N, et al. Biol Pharm Bull. 2011;34(6):856-64. doi: 10.1248/bpb.34.856. Biol Pharm Bull. 2011. PMID: 21628884 - Role of stearoyl-CoA desaturase-1 in skeletal muscle function and metabolism.
Stamatikos AD, Paton CM. Stamatikos AD, et al. Am J Physiol Endocrinol Metab. 2013 Oct 1;305(7):E767-75. doi: 10.1152/ajpendo.00268.2013. Epub 2013 Aug 13. Am J Physiol Endocrinol Metab. 2013. PMID: 23941875 Review. - Microbiota-Dependent Hepatic Lipogenesis Mediated by Stearoyl CoA Desaturase 1 (SCD1) Promotes Metabolic Syndrome in TLR5-Deficient Mice.
Singh V, Chassaing B, Zhang L, San Yeoh B, Xiao X, Kumar M, Baker MT, Cai J, Walker R, Borkowski K, Harvatine KJ, Singh N, Shearer GC, Ntambi JM, Joe B, Patterson AD, Gewirtz AT, Vijay-Kumar M. Singh V, et al. Cell Metab. 2015 Dec 1;22(6):983-96. doi: 10.1016/j.cmet.2015.09.028. Epub 2015 Oct 29. Cell Metab. 2015. PMID: 26525535 Free PMC article. - Transcriptional regulation of hepatic fatty acid metabolism.
Guillou H, Martin PG, Pineau T. Guillou H, et al. Subcell Biochem. 2008;49:3-47. doi: 10.1007/978-1-4020-8831-5_1. Subcell Biochem. 2008. PMID: 18751906 Review.
Cited by
- A review on shellfish polysaccharides: Extraction, characterization and amelioration of metabolic syndrome.
Xiang X, Jiang Q, Yang H, Zhou X, Chen Y, Chen H, Liu S, Chen L. Xiang X, et al. Front Nutr. 2022 Sep 13;9:974860. doi: 10.3389/fnut.2022.974860. eCollection 2022. Front Nutr. 2022. PMID: 36176638 Free PMC article. Review. - Participation of Short-Chain Fatty Acids and Their Receptors in Gut Inflammation and Colon Cancer.
Carretta MD, Quiroga J, López R, Hidalgo MA, Burgos RA. Carretta MD, et al. Front Physiol. 2021 Apr 8;12:662739. doi: 10.3389/fphys.2021.662739. eCollection 2021. Front Physiol. 2021. PMID: 33897470 Free PMC article. Review. - Curcumin Alleviates DSS-Induced Anxiety-Like Behaviors via the Microbial-Brain-Gut Axis.
Zhang F, Zhou Y, Chen H, Jiang H, Zhou F, Lv B, Xu M. Zhang F, et al. Oxid Med Cell Longev. 2022 Mar 18;2022:6244757. doi: 10.1155/2022/6244757. eCollection 2022. Oxid Med Cell Longev. 2022. PMID: 35345829 Free PMC article. - When fat meets the gut-focus on intestinal lipid handling in metabolic health and disease.
Wit M, Trujillo-Viera J, Strohmeyer A, Klingenspor M, Hankir M, Sumara G. Wit M, et al. EMBO Mol Med. 2022 May 9;14(5):e14742. doi: 10.15252/emmm.202114742. Epub 2022 Apr 19. EMBO Mol Med. 2022. PMID: 35437952 Free PMC article. Review. - Antibiotic-Induced Gut Microbiota Dysbiosis Modulates Host Transcriptome and m6A Epitranscriptome via Bile Acid Metabolism.
Yang M, Zheng X, Fan J, Cheng W, Yan TM, Lai Y, Zhang N, Lu Y, Qi J, Huo Z, Xu Z, Huang J, Jiao Y, Liu B, Pang R, Zhong X, Huang S, Luo GZ, Lee G, Jobin C, Eren AM, Chang EB, Wei H, Pan T, Wang X. Yang M, et al. Adv Sci (Weinh). 2024 Jul;11(28):e2307981. doi: 10.1002/advs.202307981. Epub 2024 May 7. Adv Sci (Weinh). 2024. PMID: 38713722 Free PMC article.
References
Publication types
MeSH terms
Substances
Grants and funding
- LI 923/4-1/Deutsche Forschungsgemeinschaft (German Research Foundation)/International
- STR 1343/2/Deutsche Forschungsgemeinschaft (German Research Foundation)/International
- EC 453/1-1/Deutsche Forschungsgemeinschaft (German Research Foundation)/International
- EC 453/2-1/Deutsche Forschungsgemeinschaft (German Research Foundation)/International
- 613979/EC | Seventh Framework Programme (European Union Seventh Framework Programme)/International
- 305280/EC | Seventh Framework Programme (European Union Seventh Framework Programme)/International
LinkOut - more resources
Full Text Sources
Other Literature Sources
Medical
