Flexible statistical methods for estimating and testing effects in genomic studies with multiple conditions - PubMed (original) (raw)
Flexible statistical methods for estimating and testing effects in genomic studies with multiple conditions
Sarah M Urbut et al. Nat Genet. 2019 Jan.
Abstract
We introduce new statistical methods for analyzing genomic data sets that measure many effects in many conditions (for example, gene expression changes under many treatments). These new methods improve on existing methods by allowing for arbitrary correlations in effect sizes among conditions. This flexible approach increases power, improves effect estimates and allows for more quantitative assessments of effect-size heterogeneity compared to simple shared or condition-specific assessments. We illustrate these features through an analysis of locally acting variants associated with gene expression (cis expression quantitative trait loci (eQTLs)) in 44 human tissues. Our analysis identifies more eQTLs than existing approaches, consistent with improved power. We show that although genetic effects on expression are extensively shared among tissues, effect sizes can still vary greatly among tissues. Some shared eQTLs show stronger effects in subsets of biologically related tissues (for example, brain-related tissues), or in only one tissue (for example, testis). Our methods are widely applicable, computationally tractable for many conditions and available online.
Conflict of interest statement
Competing interests The authors declare no competing financial interests.
Figures
Figure 1. Overview of fitting procedure in mash, which estimates the multivariate distribution of effects present in the data.
The data consist of a matrix of summary data (e.g., Z scores) for a large number of units (e.g., gene-SNP pairs) in multiple conditions (e.g., tissues), and, optionally, their standard errors (not shown). Color indicates the sign (positive, negative) of an effect (blue, yellow) or covariance (blue, red), with shading intensity indicating size. After selecting rows containing the strongest signals (1)—in this example, the top 6 rows—we apply covariance estimation techniques to estimate candidate “data-driven” covariance matrices U k (2). To these, we add “canonical” covariance matrices U k , including the identity matrix, and matrices representing condition-specific effects. Each covariance matrix represents a pattern of effects that may occur in the data. We scale each covariance matrix by a grid of scaling factors, ω l, varying from “very small” to “very large”, which allows for a priori effect sizes to range from very small to very large. Using the entire data set, we compute maximum-likelihood estimates of the weights (relative frequencies) π_k,l_ for each (U k,ω l) combination (3), thereby learning how commonly each pattern-effect size combination occurs in the data. Finally, we compute posterior statistics using the fitted model (4); the posterior mean estimates shown in the bottom-right illustrate that effect estimates are “shrunk” adaptively using the fitted mash model.
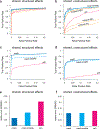
Figure 2. Comparison of methods on simulated data.
Results are shown for two simulation scenarios: “shared, structured effects”, in which the non-zero effects are shared among conditions in complex, structured ways similar to patterns of eQTL sharing in the GTEx data; and “shared, unstructured effects”, in which the non-zero effects are shared among conditions but independent. Each simulation result involves n = 20,000 independent units observed at R = 44 conditions, with 400 non-null units. Panels a–b show ROC curves for detecting significant units (n = 20,000 discoveries), based on unit-specific measures of significance (as in traditional meta-analyses). Panels c–d show ROC curves for detecting significant effects (n × R = 44 × 20,000 = 880,000 discoveries), which requires effect-specific measures of significance. In c–d, we also require the estimated sign (+/–) of each significant effect to be correct to be considered a “true positive”. Panels e and f summarize the error in the estimated effects relative to the error from a simple condition-by-condition analysis (Relative Root Mean Squared Error, or RRMSE for short). Our new method (mash) outperformed other methods, particularly in the “shared, structured effects” scenario.
Figure 3. Summary of primary patterns identified by mash in GTEx data.
Shown are the heatmap of the correlation matrix (a) and bar plots of the first three eigenvectors (b, c, d) of the covariance matrix U k corresponding to the dominant mixture component identified by mash (n = 16,069 independent gene-SNP pairs). This component accounts for 34% of all weight in the GTEx data. Tissues are color-coded as indicated by the tissue labels in the heatmap. The first eigenvector (b) reflects broad sharing among all tissues, with all effects in the same direction; the second eigenvector (c) captures differences between brain (and, to a lesser extent, testis and pituitary) and other tissues; the third eigenvector (d) primarily captures effects that are stronger in whole blood.
Figure 4. Examples illustrating that mash uses learned patterns of sharing to inform effect estimates in the GTEx data.
In panel a, each colored dot shows the original (“raw”) effect estimate for a single tissue (color-coded as in Fig. 3), with grey bars indicating ±2 standard errors. These are the data provided to mash. Panel b shows the corresponding mash estimates. In each case, mash combines information across all tissues, using the background information (patterns of sharing) learned from data on all eQTLs to produce more precise estimates. Panel c shows, for contrast, the corresponding estimates from mash-bmalite, which, due to its more restricted model, fails to capture features clearly apparent in the original data, such as strong brain effects in MCPH1. In b and c, colored dots are posterior means, and error bars depict ±2 posterior standard deviations. For all estimates, n = 83–430 individuals, depending on the tissue (Supplementary Table 3).
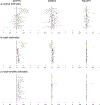
Figure 5. Number of tissues shared by sign and magnitude.
Histograms show estimated number of tissues in which top eQTLs are “shared,” considering all tissues (n = 12,171 gene-SNP pairs with a significant eQTL in at least one tissue), non-brain tissues (n = 12,117), and brain tissues only (n = 8,474), and using two different sharing definitions, by sign (a) and by magnitude (b). Sharing by sign means that the eQTLs have the same sign in the estimated effect; sharing by magnitude means that they also have similar effect sizes (within a factor of 2).
Figure 6. Pairwise sharing by magnitude of eQTLs among tissues.
For each pair of tissues, we considered the top eQTLs that were significant (lfsr < 0.05) in at least one of the two tissues, and plotted the proportion of these that are “shared in magnitude”—that is, have effect estimates that are the same sign and within a factor of 2 in size of one another (n = 5,605–9,811 gene-SNP pairs, depending on pair of tissues compared). Brackets surrounding tissue labels highlight groups of biologically related tissues mentioned in the text as showing particularly high levels of sharing.
Similar articles
- Conditional entropy in variation-adjusted windows detects selection signatures associated with expression quantitative trait loci (eQTLs).
Handelman SK, Seweryn M, Smith RM, Hartmann K, Wang D, Pietrzak M, Johnson AD, Kloczkowski A, Sadee W. Handelman SK, et al. BMC Genomics. 2015;16 Suppl 8(Suppl 8):S8. doi: 10.1186/1471-2164-16-S8-S8. Epub 2015 Jun 18. BMC Genomics. 2015. PMID: 26111110 Free PMC article. - Mapping eQTL by leveraging multiple tissues and DNA methylation.
Acharya CR, Owzar K, Allen AS. Acharya CR, et al. BMC Bioinformatics. 2017 Oct 18;18(1):455. doi: 10.1186/s12859-017-1856-9. BMC Bioinformatics. 2017. PMID: 29047346 Free PMC article. - Cis and trans effects of human genomic variants on gene expression.
Bryois J, Buil A, Evans DM, Kemp JP, Montgomery SB, Conrad DF, Ho KM, Ring S, Hurles M, Deloukas P, Davey Smith G, Dermitzakis ET. Bryois J, et al. PLoS Genet. 2014 Jul 10;10(7):e1004461. doi: 10.1371/journal.pgen.1004461. eCollection 2014 Jul. PLoS Genet. 2014. PMID: 25010687 Free PMC article. - Integrated genome-wide analysis of expression quantitative trait loci aids interpretation of genomic association studies.
Joehanes R, Zhang X, Huan T, Yao C, Ying SX, Nguyen QT, Demirkale CY, Feolo ML, Sharopova NR, Sturcke A, Schäffer AA, Heard-Costa N, Chen H, Liu PC, Wang R, Woodhouse KA, Tanriverdi K, Freedman JE, Raghavachari N, Dupuis J, Johnson AD, O'Donnell CJ, Levy D, Munson PJ. Joehanes R, et al. Genome Biol. 2017 Jan 25;18(1):16. doi: 10.1186/s13059-016-1142-6. Genome Biol. 2017. PMID: 28122634 Free PMC article. - Synthesis of 53 tissue and cell line expression QTL datasets reveals master eQTLs.
Zhang X, Gierman HJ, Levy D, Plump A, Dobrin R, Goring HH, Curran JE, Johnson MP, Blangero J, Kim SK, O'Donnell CJ, Emilsson V, Johnson AD. Zhang X, et al. BMC Genomics. 2014 Jun 27;15(1):532. doi: 10.1186/1471-2164-15-532. BMC Genomics. 2014. PMID: 24973796 Free PMC article.
Cited by
- Multi-context genetic modeling of transcriptional regulation resolves novel disease loci.
Thompson M, Gordon MG, Lu A, Tandon A, Halperin E, Gusev A, Ye CJ, Balliu B, Zaitlen N. Thompson M, et al. Nat Commun. 2022 Sep 28;13(1):5704. doi: 10.1038/s41467-022-33212-0. Nat Commun. 2022. PMID: 36171194 Free PMC article. - Oxygen-induced stress reveals context-specific gene regulatory effects in human brain organoids.
Umans BD, Gilad Y. Umans BD, et al. bioRxiv [Preprint]. 2024 Sep 3:2024.09.03.611030. doi: 10.1101/2024.09.03.611030. bioRxiv. 2024. PMID: 39282424 Free PMC article. Preprint. - Leveraging pleiotropy to discover and interpret GWAS results for sleep-associated traits.
Chun S, Akle S, Teodosiadis A, Cade BE, Wang H, Sofer T, Evans DS, Stone KL, Gharib SA, Mukherjee S, Palmer LJ, Hillman D, Rotter JI, Hanis CL, Stamatoyannopoulos JA, Redline S, Cotsapas C, Sunyaev SR. Chun S, et al. PLoS Genet. 2022 Dec 27;18(12):e1010557. doi: 10.1371/journal.pgen.1010557. eCollection 2022 Dec. PLoS Genet. 2022. PMID: 36574455 Free PMC article. - Leveraging drug perturbation to reveal genetic regulators of hepatic gene expression in African Americans.
Zhong Y, De T, Mishra M, Avitia J, Alarcon C, Perera MA. Zhong Y, et al. Am J Hum Genet. 2023 Jan 5;110(1):58-70. doi: 10.1016/j.ajhg.2022.12.005. Am J Hum Genet. 2023. PMID: 36608685 Free PMC article. - COX5A as a potential biomarker for disease activity and organ damage in lupus.
Cai M, Qin Y, Wan A, Jin H, Tang J, Chen Z. Cai M, et al. Clin Exp Med. 2023 Dec;23(8):4745-4756. doi: 10.1007/s10238-023-01215-w. Epub 2023 Oct 27. Clin Exp Med. 2023. PMID: 37891386
References
Methods-only references
- Bovy J, Hogg DW & Roweis ST Extreme Deconvolution: inferring complete distribution functions from noisy, heterogeneous and incomplete observations. Annals of Applied Statistics 5, 1657–1677 (2011).
- Larribe F & Fearnhead P Composite likelihood methods in statistical genetics. Statistica Sinica 21, 43–69 (2011).
- Dempster AP, Laird NM & Rubin DB Maximum likelihood from incomplete data via the EM algorithm. Journal of the Royal Statistical Society, Series B 39, 1–38 (1977).
- Varadhan R & Roland C Simple and globally convergent methods for accelerating the convergence of any EM algorithm. Scandinavian Journal of Statistics 35, 335–353 (2008).
- Efron B Microarrays, empirical Bayes and the two-groups model. Statistical Science 23, 1–22 (2008).
Publication types
MeSH terms
Grants and funding
- R01 DA006227/DA/NIDA NIH HHS/United States
- R01 MH101782/MH/NIMH NIH HHS/United States
- R01 MH101810/MH/NIMH NIH HHS/United States
- R01 MH101819/MH/NIMH NIH HHS/United States
- R01 DA033684/DA/NIDA NIH HHS/United States
- R01 MH090936/MH/NIMH NIH HHS/United States
- R01 HG002585/HG/NHGRI NIH HHS/United States
- R01 MH090951/MH/NIMH NIH HHS/United States
- R01 MH101820/MH/NIMH NIH HHS/United States
- R01 MH101822/MH/NIMH NIH HHS/United States
- R01 MH090937/MH/NIMH NIH HHS/United States
- R01 MH101814/MH/NIMH NIH HHS/United States
- R56 HG002585/HG/NHGRI NIH HHS/United States
- T32 HD007009/HD/NICHD NIH HHS/United States
- R01 MH101825/MH/NIMH NIH HHS/United States
- R01 MH090948/MH/NIMH NIH HHS/United States
- R01 MH090941/MH/NIMH NIH HHS/United States
LinkOut - more resources
Full Text Sources


