Adipose Triglyceride Lipase Is a Key Lipase for the Mobilization of Lipid Droplets in Human β-Cells and Critical for the Maintenance of Syntaxin 1a Levels in β-Cells - PubMed (original) (raw)
. 2020 Jun;69(6):1178-1192.
doi: 10.2337/db19-0951. Epub 2020 Apr 20.
Affiliations
- PMID: 32312867
- PMCID: PMC7243295
- DOI: 10.2337/db19-0951
Adipose Triglyceride Lipase Is a Key Lipase for the Mobilization of Lipid Droplets in Human β-Cells and Critical for the Maintenance of Syntaxin 1a Levels in β-Cells
Siming Liu et al. Diabetes. 2020 Jun.
Abstract
Lipid droplets (LDs) are frequently increased when excessive lipid accumulation leads to cellular dysfunction. Distinct from mouse β-cells, LDs are prominent in human β-cells. However, the regulation of LD mobilization (lipolysis) in human β-cells remains unclear. We found that glucose increases lipolysis in nondiabetic human islets but not in islets in patients with type 2 diabetes (T2D), indicating dysregulation of lipolysis in T2D islets. Silencing adipose triglyceride lipase (ATGL) in human pseudoislets with shRNA targeting ATGL (shATGL) increased triglycerides (TGs) and the number and size of LDs, indicating that ATGL is the principal lipase in human β-cells. In shATGL pseudoislets, biphasic glucose-stimulated insulin secretion (GSIS), and insulin secretion to 3-isobutyl-1-methylxanthine and KCl were all reduced without altering oxygen consumption rate compared with scramble control. Like human islets, INS1 cells showed visible LDs, glucose-responsive lipolysis, and impairment of GSIS after ATGL silencing. ATGL-deficient INS1 cells and human pseudoislets showed reduced SNARE protein syntaxin 1a (STX1A), a key SNARE component. Proteasomal degradation of Stx1a was accelerated likely through reduced palmitoylation in ATGL-deficient INS1 cells. Therefore, ATGL is responsible for LD mobilization in human β-cells and supports insulin secretion by stabilizing STX1A. The dysregulated lipolysis may contribute to LD accumulation and β-cell dysfunction in T2D islets.
© 2020 by the American Diabetes Association.
Figures
Figure 1
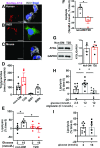
Human islets and INS1 cells, but not mouse islets, showed distinct LD and increased lipolysis in response to glucose. A_–_C: Confocal images of human β-cells (A), INS1 cells (B), and β-cells from Bl6NJ (Bl6N) mouse islets (C) incubated with 0.4 mmol/L OA + 2 μmol/L Bodipy C12 overnight as in
research design and methods
. Human and mouse β-cells were identified by anti-insulin antibody (white) while INS1 cells were instead stained with Bodipy 493 (green). DAPI in blue. Scale bars = 10 μm. D: TG contents of INS1 cells, human islets from donors without diabetes (non-DM), and donors with T2D, and from Bl6N. n = 5 for non-DM, n = 4 for T2D, n = 3 for INS1 cells, and n = 4 for Bl6N. E: Lipolysis measured in human islets from non-DM and T2D. Data represent TG contents per mg protein at time 0 as 100%. n = 4–5 donors. F: Data from E are expressed as the increase in lipolysis in response to glucose for non-DM and T2D. n = 4–5 donors. G: Representative immunoblot comparing ATGL expression in human islets from non-DM and T2D donors. GAPDH served as loading control and densitometry data are expressed as ATGL/GAPDH. n = 4. H: Lipolysis measured as in E in INS1 cells at indicated concentration of glucose in the presence and absence of atglistatin. n = 8. I: Lipolysis measured as in E in Bl6N islets. n = 7. All data are mean ± SEM. *P < 0.05 by Student t test.
Figure 2
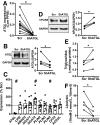
ATGL downregulation in human pseudoislets elevated the levels of PLIN2 without altering genes involved in lipid metabolic and β oxidation. A: Expression of ATGL in human pseudoislets transduced with lenti-shATGL (shATGL) was compared with those treated with lenti-Sh Scramble (scr) by qPCR. n = 11. B: An immunoblot comparing ATGL expression in shATGL and scr human pseudoislets. GAPDH served as the loading control, and densitometry data were expressed as ATGL/GAPDH. n = 4. A and B: Each dot represents a single donor, and data points from the same donor are connected by lines. C: qPCR probed human pseudoislets for expression levels of genes related to lipid metabolism using PPIB as the internal control. Data are expressed as % scr value. Each dot represents the value for the shATGL islets from one donor. n = 6 for LIPE and ABHD5, n = 7 for ACDVL, n = 8 for CPT2, n = 9 for PLIN3 and PLIN5, n = 10 for DGAT1, DGAT2, and PLIN2, and n = 11 donors for ATGL. D: PLIN2 expression compared between shATGL and scr human pseudoislets by immunoblot as in B. n = 4. E: TG contents of shATGL and scr human pseudoislets. n = 4 donors. F: The increase in lipolysis in response to glucose measured in shATGL and scr human pseudoislets. Data are expressed taking TG contents per mg protein at time 0 as 100%. n = 4 donors. D_–_F: Each dot represents a value from a single donor, and data points from the same donor are connected by lines. All data are mean ± SEM. *P < 0.05, #P < 0.05 vs. scr by Student t test.
Figure 3
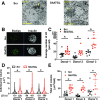
Reduction of ATGL in human pseudoislets increased LD accumulation. A: The representative EM images of scr- and shATGL-treated human pseudoislets. Yellow arrows show clusters of LDs. Scale bars = 5 μm. B: The representative Z-stack images of β-cells from scr- and shATGL-treated human pseudoislets captured by a confocal microscope. Scale bar = 5 μm. C_–_E: The number of LDs per cell (C), the volume distribution of all LDs from all cells within a group (D), and the sum of the volume of all LDs in each cell quantitated from the reconstructed three-dimensional images of β-cells from scr and shATGL pseudoislets (E). n = 3 donors (see
Supplementary Table 1
for donor ID). C and E: The number of cells for donor 1 scr is 11, donor 1 shATGL 11, donor 2 scr 13, donor 2 shATGL 9, donor 3 scr 10, and donor 3 shATGL 10. D: The total number of LD for each group is the number of cells counted × number of LD in each cell and shown as LD (n) below the _x_-axis. Mean ± SEM is shown. *P < 0.05 vs. scr by Student t test.
Figure 4
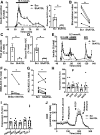
Insulin secretion was impaired in human pseudoislets transduced with shATGL. A: Perifusion profile of GSIS from pseudoislets transduced by lenti-shATGL (shATGL) and those transduced by lenti-shScr (scr) in response to 16.7 mmol/L glucose expressed as % of total insulin. The glucose ramp is indicated in a bar on the top. The line graph was analyzed by two-way ANOVA, P < 0.05. AUC during the glucose ramp is also shown. n = 4 donors. B: SI of GSIS in A. Each dot represents a single donor and data from the same donor are connected by lines. C and D: AUC during the first phase (C) and the second phase (D) of GSIS during glucose ramp in A. E: Representative profile of insulin secretion from scr and shATGL human pseudoislets sequentially perifused with 8.3 mmol/L glucose, 8.3 mmol/L glucose + 0.1 mmol/L IBMX, and 30 mmol/L KCl expressed as % of total insulin. Mean ± SEM of duplicates from a single donor. AUC for IBMX treatment (F) (n = 5) and for KCl treatment (G) (n = 7) during glucose ramp in E. For A_–_D, data represent mean ± SEM. *P < 0.05 vs. scr by Student t test. H and I: qPCR probed human pseudoislets for expression levels of genes related to endocrine cell types (H) and stress markers (I) using PPIB as internal control. Data are expressed as % scr. Each dot represents value for shATGL islets from one donor. Data are mean ± SEM. n = 6 for PDX1, MAFA, HSPA5, and DDIT3; n = 7 for SST, TXNIP, and HIF1a; n = 9 for INS; n = 10 for GCG; and n = 11 donors for CCL2. *P < 0.05. #P < 0.05 vs. scr by Student t test. J: Sequential change in OCR in response to 22.2 mmol/L glucose, oligomycin, FCCP, and rotenone + antimycin are compared between scr and shATGL pseudoislets. Data are corrected for DNA contents and mean ± SEM, n = 4. Data are representative of experiments repeated in three donors.
Figure 5
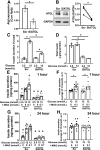
ATGL reduction impaired GSIS in INS1 cells that was not fully restored by addition of 1-palmitoyl-glycerol. A_–_H: ATGL was downregulated in INS1 cells by SiATGL (15 nmol/L each of rn.Ri.Pnpla2.13.2 and rn.Ri.Pnpla2.13.3 combined) using 30 nmol/L of nontargeting RNA (scr) as a control. A: qPCR compared Atgl mRNA expression between scr- and SiATGL-treated INS1 cells. B: Representative immunoblot and densitometry analysis of ATGL/GAPDH. Data from paired samples are connected by lines. n = 3. C: Insulin secretion measured by static incubation at indicated concentration of glucose in SiATGL INS1 cells and the scr control group. D: Total insulin contents corrected for protein. A, C, and D: n = 3, representative of six experiments. A_–_D: *P < 0.05 by Student t test. E_–_H: Insulin secretion as measured by static incubation at indicated concentration of glucose with or without 0.1 mmol/L 1-palmitoyl-glycerol (1-MAG) for 1 h (E and F) or 24 h (G and H) in INS1 cells treated with siATGL and the scr control group. E and G: Data are expressed per protein contents and combine three experiments each performed in triplicates. n = 9. a_P_ < 0.05 vs. scr 12 mmol/L glucose by one-way ANOVA with Dunnett multiple comparisons test. F: Fold increase of insulin secretion in (E, 1 h 1-MAG treatment) and (H) fold increase of insulin secretion in (G, 24 h 1-MAG treatment) taking average insulin secretion at 12 mmol/L glucose as 1. n = 9. F and H: *P < 0.05 for data ± 1-MAG by Student t test. All data represent mean ± SEM.
Figure 6
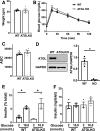
ATGL reduction is not sufficient to impair GSIS in mouse islets. A–C: Body weight (A), tail blood glucose (B), and area under curve (AUC) (C) are compared between 2-month-old male ATGL KO mice and WT littermates. P = 0.22 by two-way ANOVA for B. n = 4 per group. D: Immunoblot compared ATGL and GAPDH expression in islets from β-cell–specific ATGL KO mice and WT littermates. A represenative blot and densitometry data of ATGL/GAPDH. n = 3 for WT and 4 for KO. E and F: GSIS measured by static incbuation corrected for insulin contents (E) and total insulin content (F) in WT and ATGL KO mouse islets. Representative of experiments performed in six mice total for WT and ATGL KO. Each data points represent the average of triplicates from one mouse. n = 3 mice. All data represent mean ± SEM. *P < 0.05 by Student t test.
Figure 7
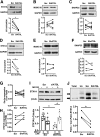
The downregulation of ATGL decreased the levels of Stx1a in INS1 and human islets. A_–_C: Immunoblot probed INS1 cells treated with siATGL (15 nmol/L each of rn.Ri.Pnpla2.13.2 and rn.Ri.Pnpla2.13.3 combined) and 30 nmol/L of scr control for STX1A (A), MUNC18–1 (MUNC18) (B), and SNAP25 (C). Representative blot from four experiments. Densitometry data from the paired samples are connected by lines. D_–_F: Immunoblot probed human pseudoislets treated with shATGL and scr control for STX1A (D), MUNC18 (E), and SNAP25 (F). Representative blot from n = 4 donors. Each dot represents densitometry data from each donor and data from the same donor are connected by lines. Bar graphs indicate mean ± SEM of the densitometry data. G and H: Stx1a mRNA levels compared between INS1 cells treated with siATGL (15 nmol/L each of rn.Ri.Pnpla2.13.2 and rn.Ri.Pnpla2.13.3 combined) and 30 nmol/L of scr control. n = 6 (G) and between control and ATGL silenced human pseudoislets, n = 4 (H). I: Immunoblot of STX1A and β-tubulin (β-tub) in scr and siATGL INS1 cells (15 nmol/L each of rn.Ri.Pnpla2.13.2 and rn.Ri.Pnpla2.13.3 combined) treated with or without 100 μmol/L MG132 for 8 h prior to harvest. Representative blot and densitometry data taking average for scr without MG132 as 1. Mean ± SEM. n = 8 for without MG132, and n = 10 for with MG132. J: APEGS assay of STX1A comparing protein lysate from INS1 cells treated with 15 nmol/L each of rn.Ri.Pnpla2.13.2 and rn.Ri.Pnpla2.13.3 combined (Si) and 30 nmol/L of the scr control group. Protein lysate untreated with hydroxylamine is the negative control (Un). A representative Western blot from three independent experiments and densitometry data are shown. The black arrow shows a nonpalmitoylated band, and the white arrow shows a palmitoylated band. *P < 0.05 by Student t test.
Figure 8
The downregulation of Stx1a decreased GSIS in INS1 cells. A: qPCR compared Stx1a mRNA expression corrected for Ppib in INS1 cells. The scr control group is compared with cells treated with two separate SiStx1a (1,2). B: Immunoblot probed STX1A in INS1 cells treated with two separate SiStx1a and scr control. Representative blot and densitometry data from three experiments each performed in triplicates. C: Insulin secretion measured by static incubation expressed per total insulin content. D: The total insulin content for data in C corrected for protein. Representative data from three experiments each performed in triplicates. All data are mean ± SEM. *P < 0.05 by one-way ANOVA with Dunnett multiple comparisons test.
Similar articles
- Adipose Triglyceride Lipase is a Key Lipase for the Mobilization of Lipid Droplets in Human Beta Cells and Critical for the Maintenance of Syntaxin1a Level in Beta Cells.
Liu S, Promes JA, Harata M, Mishra A, Stephens SB, Taylor EB, Burand AJ Jr, Sivitz WI, Fink BD, Ankrum JA, Imai Y. Liu S, et al. Diabetes. 2020 Mar 31:db190951. doi: 10.2337/db09-0951. Online ahead of print. Diabetes. 2020. PMID: 32234723 - Acute Inhibition of Adipose Triglyceride Lipase by NG497 Dysregulates Insulin and Glucagon Secretion From Human Islets.
Kim LB, Liu S, Richtsmeier S, Górniak M, Vikram A, Imai Y. Kim LB, et al. Endocrinology. 2025 May 19;166(7):bqaf090. doi: 10.1210/endocr/bqaf090. Endocrinology. 2025. PMID: 40354133 Free PMC article. - Adipose triglyceride lipase is implicated in fuel- and non-fuel-stimulated insulin secretion.
Peyot ML, Guay C, Latour MG, Lamontagne J, Lussier R, Pineda M, Ruderman NB, Haemmerle G, Zechner R, Joly É, Madiraju SRM, Poitout V, Prentki M. Peyot ML, et al. J Biol Chem. 2009 Jun 19;284(25):16848-16859. doi: 10.1074/jbc.M109.006650. Epub 2009 Apr 22. J Biol Chem. 2009. PMID: 19389712 Free PMC article. - The role of adipose triglyceride lipase in lipid and glucose homeostasis: lessons from transgenic mice.
Trites MJ, Clugston RD. Trites MJ, et al. Lipids Health Dis. 2019 Nov 22;18(1):204. doi: 10.1186/s12944-019-1151-z. Lipids Health Dis. 2019. PMID: 31757217 Free PMC article. Review. - Lipid Droplets' Role in the Regulation of β-Cell Function and β-Cell Demise in Type 2 Diabetes.
Tong X, Liu S, Stein R, Imai Y. Tong X, et al. Endocrinology. 2022 Mar 1;163(3):bqac007. doi: 10.1210/endocr/bqac007. Endocrinology. 2022. PMID: 35086144 Free PMC article. Review.
Cited by
- Impact of moderate exercise on fatty acid oxidation in pancreatic β-cells and skeletal muscle.
Langlois A, Forterre A, Pinget M, Bouzakri K. Langlois A, et al. J Endocrinol Invest. 2021 Sep;44(9):1815-1825. doi: 10.1007/s40618-021-01551-2. Epub 2021 Apr 12. J Endocrinol Invest. 2021. PMID: 33844166 Free PMC article. Review. - Approaches to Measuring the Activity of Major Lipolytic and Lipogenic Enzymes In Vitro and Ex Vivo.
Wilhelm M, Rossmeislová L, Šiklová M. Wilhelm M, et al. Int J Mol Sci. 2022 Sep 21;23(19):11093. doi: 10.3390/ijms231911093. Int J Mol Sci. 2022. PMID: 36232405 Free PMC article. Review. - Pancreatic Pseudoislets: An Organoid Archetype for Metabolism Research.
Friedlander MSH, Nguyen VM, Kim SK, Bevacqua RJ. Friedlander MSH, et al. Diabetes. 2021 May;70(5):1051-1060. doi: 10.2337/db20-1115. Epub 2021 May 4. Diabetes. 2021. PMID: 33947722 Free PMC article. Review. - Impact of Dysfunctional Adipose Tissue Depots on the Cardiovascular System.
D'Oria R, Genchi VA, Caccioppoli C, Calderoni I, Marrano N, Biondi G, Borrelli A, Di Gioia L, Giorgino F, Laviola L. D'Oria R, et al. Int J Mol Sci. 2022 Nov 18;23(22):14296. doi: 10.3390/ijms232214296. Int J Mol Sci. 2022. PMID: 36430774 Free PMC article. Review. - JunD Regulates Pancreatic β-Cells Function by Altering Lipid Accumulation.
Wang K, Cui Y, Lin P, Yao Z, Sun Y. Wang K, et al. Front Endocrinol (Lausanne). 2021 Jul 16;12:689845. doi: 10.3389/fendo.2021.689845. eCollection 2021. Front Endocrinol (Lausanne). 2021. PMID: 34335468 Free PMC article.
References
Publication types
MeSH terms
Substances
Grants and funding
- R01 DK090490/DK/NIDDK NIH HHS/United States
- R01 DK104998/DK/NIDDK NIH HHS/United States
- T32 NS045549/NS/NINDS NIH HHS/United States
- S10 RR025439/RR/NCRR NIH HHS/United States
- UC4 DK098085/DK/NIDDK NIH HHS/United States
- U24 DK098085/DK/NIDDK NIH HHS/United States
- S10 RR018998/RR/NCRR NIH HHS/United States
LinkOut - more resources
Full Text Sources
Molecular Biology Databases
Research Materials
