Global increase in major tropical cyclone exceedance probability over the past four decades - PubMed (original) (raw)
Global increase in major tropical cyclone exceedance probability over the past four decades
James P Kossin et al. Proc Natl Acad Sci U S A. 2020.
Erratum in
- Correction for Kossin et al., Global increase in major tropical cyclone exceedance probability over the past four decades.
[No authors listed] [No authors listed] Proc Natl Acad Sci U S A. 2020 Nov 24;117(47):29990. doi: 10.1073/pnas.2021573117. Epub 2020 Nov 9. Proc Natl Acad Sci U S A. 2020. PMID: 33168759 Free PMC article. No abstract available.
Abstract
Theoretical understanding of the thermodynamic controls on tropical cyclone (TC) wind intensity, as well as numerical simulations, implies a positive trend in TC intensity in a warming world. The global instrumental record of TC intensity, however, is known to be heterogeneous in both space and time and is generally unsuitable for global trend analysis. To address this, a homogenized data record based on satellite data was previously created for the period 1982-2009. The 28-y homogenized record exhibited increasing global TC intensity trends, but they were not statistically significant at the 95% confidence level. Based on observed trends in the thermodynamic mean state of the tropical environment during this period, however, it was argued that the 28-y period was likely close to, but shorter than, the time required for a statistically significant positive global TC intensity trend to appear. Here the homogenized global TC intensity record is extended to the 39-y period 1979-2017, and statistically significant (at the 95% confidence level) increases are identified. Increases and trends are found in the exceedance probability and proportion of major (Saffir-Simpson categories 3 to 5) TC intensities, which is consistent with expectations based on theoretical understanding and trends identified in numerical simulations in warming scenarios. Major TCs pose, by far, the greatest threat to lives and property. Between the early and latter halves of the time period, the major TC exceedance probability increases by about 8% per decade, with a 95% CI of 2 to 15% per decade.
Keywords: climate; hurricane; intensity; trend; tropical cyclone.
Conflict of interest statement
The authors declare no competing interest.
Figures
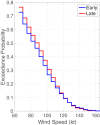
Fig. 1.
Comparison of complementary cumulative distribution functions of the global ADT-HURSAT hurricane intensity estimates between the early and latter halves of the 39-y period 1979–2017.
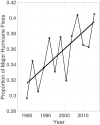
Fig. 2.
Time series of fractional proportion of global major hurricane estimates to all hurricane estimates for the period 1979–2017. Each point, except the earliest, represents the data in a sequence of 3-y periods. The first data point is based on only 2 y (1979 and 1981) to avoid the years with no eastern hemisphere coverage. The linear Theil−Sen trend (black line) is significant at the 98% confidence level (Mann−Kendall P value = 0.02). The proportion increases by 25% in the 39-y period (about 6% per decade).
Fig. 3.
As in Fig. 2, but for individual ocean basins. The red, green, and blue curves shown arbitrarily in the western North Pacific panel are time series of annually averaged indices representing Atlantic, Pacific, and Indian Ocean multidecadal variability, respectively, and represent 11-y centered means that have been normalized and shifted for plotting purposes.
Comment in
- Evidence that hurricanes are getting stronger.
Emanuel K. Emanuel K. Proc Natl Acad Sci U S A. 2020 Jun 16;117(24):13194-13195. doi: 10.1073/pnas.2007742117. Epub 2020 May 29. Proc Natl Acad Sci U S A. 2020. PMID: 32471950 Free PMC article. No abstract available.
Similar articles
- The growing inadequacy of an open-ended Saffir-Simpson hurricane wind scale in a warming world.
Wehner MF, Kossin JP. Wehner MF, et al. Proc Natl Acad Sci U S A. 2024 Feb 13;121(7):e2308901121. doi: 10.1073/pnas.2308901121. Epub 2024 Feb 5. Proc Natl Acad Sci U S A. 2024. PMID: 38315843 Free PMC article. - Enhanced intensity of global tropical cyclones during the mid-Pliocene warm period.
Yan Q, Wei T, Korty RL, Kossin JP, Zhang Z, Wang H. Yan Q, et al. Proc Natl Acad Sci U S A. 2016 Nov 15;113(46):12963-12967. doi: 10.1073/pnas.1608950113. Epub 2016 Oct 31. Proc Natl Acad Sci U S A. 2016. PMID: 27799528 Free PMC article. - The increasing variability of tropical cyclone lifetime maximum intensity.
Song J, Klotzbach PJ, Tang J, Wang Y. Song J, et al. Sci Rep. 2018 Nov 9;8(1):16641. doi: 10.1038/s41598-018-35131-x. Sci Rep. 2018. PMID: 30413761 Free PMC article. - Human influence on tropical cyclone intensity.
Sobel AH, Camargo SJ, Hall TM, Lee CY, Tippett MK, Wing AA. Sobel AH, et al. Science. 2016 Jul 15;353(6296):242-6. doi: 10.1126/science.aaf6574. Science. 2016. PMID: 27418502 Review. - Analyzing the impact of severe tropical cyclone Yasi on public health infrastructure and the management of noncommunicable diseases.
Ryan BJ, Franklin RC, Burkle FM, Watt K, Aitken P, Smith EC, Leggat P. Ryan BJ, et al. Prehosp Disaster Med. 2015 Feb;30(1):28-37. doi: 10.1017/S1049023X1400137X. Epub 2014 Dec 29. Prehosp Disaster Med. 2015. PMID: 25544290 Review.
Cited by
- Geo-spatial based cyclone shelter suitability assessment using analytical hierarchy process (AHP) in the coastal region of Bangladesh.
Hasan I, Faruk MO, Katha ZT, Goni MO, Islam MS, Chakraborty TR, Faysal Sowrav SF, Hossain MS. Hasan I, et al. Heliyon. 2024 Oct 24;10(21):e39831. doi: 10.1016/j.heliyon.2024.e39831. eCollection 2024 Nov 15. Heliyon. 2024. PMID: 39524837 Free PMC article. - Climate Justice Implications of Natech Disasters: Excess Contaminant Releases during Hurricanes on the Texas Gulf Coast.
Berberian AG, Morello-Frosch R, Karasaki S, Cushing LJ. Berberian AG, et al. Environ Sci Technol. 2024 Aug 13;58(32):14180-14192. doi: 10.1021/acs.est.3c10797. Epub 2024 Jul 30. Environ Sci Technol. 2024. PMID: 39078622 Free PMC article. - Rebuilding Caribbean Environmental Health Post-Crisis Programs: A Preliminary Study for Virtual Mentorship.
DeVito R, Landeen E, Dyjack D, Labbo R, Gill G, Gerding J, Kalis MA, Daly S, Lopez R, Somaiya C, Chera S, Vanover C, Fahnestock L, Randhawa M. DeVito R, et al. J Environ Health. 2024 Jan;86(6):8-13. J Environ Health. 2024. PMID: 39040872 Free PMC article. - Hidden delta degradation due to fluvial sediment decline and intensified marine storms.
Zhu Q, Xing F, Wang YP, Syvitski J, Overeem I, Guo J, Li Y, Tang J, Yu Q, Gao J, Gao S. Zhu Q, et al. Sci Adv. 2024 May 3;10(18):eadk1698. doi: 10.1126/sciadv.adk1698. Epub 2024 May 3. Sci Adv. 2024. PMID: 38701206 Free PMC article. - Disappearing cities on US coasts.
Ohenhen LO, Shirzaei M, Ojha C, Sherpa SF, Nicholls RJ. Ohenhen LO, et al. Nature. 2024 Mar;627(8002):108-115. doi: 10.1038/s41586-024-07038-3. Epub 2024 Mar 6. Nature. 2024. PMID: 38448695 Free PMC article.
References
- Emanuel K. A., The dependence of hurricane intensity on climate. Nature 326, 483–485 (1987).
- DeMaria M., The effect of vertical shear on tropical cyclone intensity change. J. Atmos. Sci. 53, 2076–2088 (1996).
- Wang M. L. M., Chan J. C. L., Tropical cyclone intensity in vertical wind shear. J. Atmos. Sci. 61, 1859–1876 (2004).
- Kossin J. P., Hurricane intensification along United States coast suppressed during active hurricane periods. Nature 541, 390–393 (2017). - PubMed
- Sobel A. H., et al. , Human influence on tropical cyclone intensity. Science 353, 242–246 (2016). - PubMed
Publication types
LinkOut - more resources
Full Text Sources
Miscellaneous


