An R package for an integrated evaluation of statistical approaches to cancer incidence projection - PubMed (original) (raw)
An R package for an integrated evaluation of statistical approaches to cancer incidence projection
Maximilian Knoll et al. BMC Med Res Methodol. 2020.
Abstract
Background: Projection of future cancer incidence is an important task in cancer epidemiology. The results are of interest also for biomedical research and public health policy. Age-Period-Cohort (APC) models, usually based on long-term cancer registry data (> 20 yrs), are established for such projections. In many countries (including Germany), however, nationwide long-term data are not yet available. General guidance on statistical approaches for projections using rather short-term data is challenging and software to enable researchers to easily compare approaches is lacking.
Methods: To enable a comparative analysis of the performance of statistical approaches to cancer incidence projection, we developed an R package (incAnalysis), supporting in particular Bayesian models fitted by Integrated Nested Laplace Approximations (INLA). Its use is demonstrated by an extensive empirical evaluation of operating characteristics (bias, coverage and precision) of potentially applicable models differing by complexity. Observed long-term data from three cancer registries (SEER-9, NORDCAN, Saarland) was used for benchmarking.
Results: Overall, coverage was high (mostly > 90%) for Bayesian APC models (BAPC), whereas less complex models showed differences in coverage dependent on projection-period. Intercept-only models yielded values below 20% for coverage. Bias increased and precision decreased for longer projection periods (> 15 years) for all except intercept-only models. Precision was lowest for complex models such as BAPC models, generalized additive models with multivariate smoothers and generalized linear models with age x period interaction effects.
Conclusion: The incAnalysis R package allows a straightforward comparison of cancer incidence rate projection approaches. Further detailed and targeted investigations into model performance in addition to the presented empirical results are recommended to derive guidance on appropriate statistical projection methods in a given setting.
Keywords: Bayesian model; Cancer epidemiology, age-period-cohort model; Cancer incidence projection; INLA.
Conflict of interest statement
CS is now full-time employee of Boehringer Ingelheim Pharma GmbH & Co. KG, Ingelheim, Germany. The company had no role in design, analysis or interpretation of the presented work.
Figures
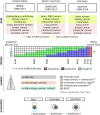
Fig. 1
Overview of the analyzed cancer registry data, study design, model selection and evaluation metrics
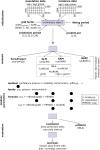
Fig. 2
The R package “incAnalysis”
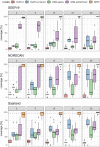
Fig. 3
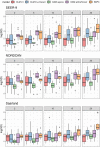
Coverages of future projections after 2, 5, 10, 15 and 20 yrs. based on models with a 15 yr observation period. Dashed line: 95% coverage. Int: intercept only model, lin + interact: linear age, period and interaction effects, age,bs: univariate smoother (B-spline) for age, splineTensor: tensor product smoother (age, period), M-spline basis. GLMs, GAMs: neg-binomial distribution
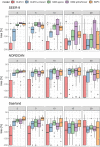
Fig. 4
Bias of future projections after 2, 5, 10, 15 and 20 yrs. based on models with a 15 yr observation period. Negative values indicate overestimation of cancer incidence. Bias values smaller than − 200 were set to − 200. Dashed line: no bias (0%). int: intercept only model, lin + interact: linear age, period and interaction effects, age,bs: univariate smoother (B-spline) for age, splineTensor}: tensor product smoother (age, period), M-spline basis. GLMs, GAMs: neg-binomial distribution
Fig. 5
Precision of future projections after 2, 5, 10, 15 and 20 yrs. based on models with a 15 yr observation period. Transformed averaged posterior standard deviations are shown. Int: intercept only model, lin + interac: linear age, period and interaction effects, age,bs: univariate smoother (B-spline) for age, splineTensor: tensor product smoother (age, period), M-spline basis. GLMs, GAMs: neg-binomial distribution
Similar articles
- Projecting the future burden of cancer: Bayesian age-period-cohort analysis with integrated nested Laplace approximations.
Riebler A, Held L. Riebler A, et al. Biom J. 2017 May;59(3):531-549. doi: 10.1002/bimj.201500263. Epub 2017 Jan 31. Biom J. 2017. PMID: 28139001 - Short-term projection of cancer incidence in Japan using an age-period interaction model with spline smoothing.
Katanoda K, Kamo K, Saika K, Matsuda T, Shibata A, Matsuda A, Nishino Y, Hattori M, Soda M, Ioka A, Sobue T, Nishimoto H. Katanoda K, et al. Jpn J Clin Oncol. 2014 Jan;44(1):36-41. doi: 10.1093/jjco/hyt163. Epub 2013 Nov 11. Jpn J Clin Oncol. 2014. PMID: 24218520 - Projections of the future burden of cancer in Australia using Bayesian age-period-cohort models.
Cameron JK, Baade P. Cameron JK, et al. Cancer Epidemiol. 2021 Jun;72:101935. doi: 10.1016/j.canep.2021.101935. Epub 2021 Apr 7. Cancer Epidemiol. 2021. PMID: 33838461 - Spatial and spatio-temporal models with R-INLA.
Blangiardo M, Cameletti M, Baio G, Rue H. Blangiardo M, et al. Spat Spatiotemporal Epidemiol. 2013 Dec;7:39-55. doi: 10.1016/j.sste.2013.07.003. Spat Spatiotemporal Epidemiol. 2013. PMID: 24377114 Review. - Using mortality to predict incidence for rare and lethal cancers in very small areas.
Etxeberria J, Goicoa T, Ugarte MD. Etxeberria J, et al. Biom J. 2023 Mar;65(3):e2200017. doi: 10.1002/bimj.202200017. Epub 2022 Sep 30. Biom J. 2023. PMID: 36180401 Review.
Cited by
- Global and regional burden of pancreatitis: epidemiological trends, risk factors, and projections to 2050 from the global burden of disease study 2021.
Li T, Qin C, Zhao B, Li Z, Zhao Y, Lin C, Wang W. Li T, et al. BMC Gastroenterol. 2024 Nov 8;24(1):398. doi: 10.1186/s12876-024-03481-8. BMC Gastroenterol. 2024. PMID: 39511469 Free PMC article. - The global, regional, and national patterns of change in the burden of congenital birth defects, 1990-2021: an analysis of the global burden of disease study 2021 and forecast to 2040.
Bai Z, Han J, An J, Wang H, Du X, Yang Z, Mo X. Bai Z, et al. EClinicalMedicine. 2024 Oct 4;77:102873. doi: 10.1016/j.eclinm.2024.102873. eCollection 2024 Nov. EClinicalMedicine. 2024. PMID: 39416384 Free PMC article. - Age, period, and cohort effects of Clonorchis sinensis infection prevalence in the Republic of Korea: Insights and projections.
Jung SM, Kang H, Jung BK, Ju S, Ju JW, Lee MR, Kim JH, Kim SH. Jung SM, et al. PLoS Negl Trop Dis. 2024 Oct 11;18(10):e0012574. doi: 10.1371/journal.pntd.0012574. eCollection 2024 Oct. PLoS Negl Trop Dis. 2024. PMID: 39392863 Free PMC article. - Burden of malignant mesothelioma in China during 1990-2019 and the projections through 2029.
Huang Q, Chen Y, Lian L, Lei Q, Chen J, Wu L, Hemminki K, Ji J, Chen T. Huang Q, et al. J Natl Cancer Cent. 2024 May 11;4(3):214-222. doi: 10.1016/j.jncc.2024.05.003. eCollection 2024 Sep. J Natl Cancer Cent. 2024. PMID: 39281715 Free PMC article.
References
- Brown LD, Cai TT, DasGupta A, Agresti A, Coull BA, Casella G, Corcoran C, Mehta C, Ghosh M, Santner TJ, et al. Interval estimation for a binomial proportion - comment - rejoinder. Stat Sci. 2001;16(2):101–133.
- Siegel RL, Miller KD, Jemal A. Cancer statistics, 2019. CA Cancer J Clin. 2019;69(1):7–34. - PubMed
- Moller B, Fekjaer H, Hakulinen T, Sigvaldason H, Storm HH, Talback M, Haldorsen T. Prediction of cancer incidence in the Nordic countries: empirical comparison of different approaches. Stat Med. 2003;22(17):2751–2766. - PubMed
- Bray F, Moller B. Predicting the future burden of cancer. Nat Rev Cancer. 2006;6(1):63–74. - PubMed
Publication types
MeSH terms
LinkOut - more resources
Full Text Sources
