Recruitment of phosphorylated chromatin assembly factor 1 to chromatin after UV irradiation of human cells - PubMed (original) (raw)
Recruitment of phosphorylated chromatin assembly factor 1 to chromatin after UV irradiation of human cells
E Martini et al. J Cell Biol. 1998.
Abstract
The subcellular distribution and posttranslational modification of human chromatin assembly factor 1 (CAF-1) have been investigated after UV irradiation of HeLa cells. In an asynchronous cell population only a subfraction of the two large CAF-1 subunits, p150 and p60, were found to exist in a chromatin-associated fraction. This fraction is most abundant during S phase in nonirradiated cells and is much reduced in G2 cells. After UV irradiation, the chromatin-associated form of CAF-1 dramatically increased in all cells irrespective of their position in the cell cycle. Such chromatin recruitment resembles that seen for PCNA, a DNA replication and repair factor. The chromatin-associated fraction of p60 was predominantly hypophosphorylated in nonirradiated G2 cells. UV irradiation resulted in the rapid recruitment to chromatin of phosphorylated forms of the p60 subunit. Furthermore, the amount of the p60 and p150 subunits of CAF-1 associated with chromatin was a function of the dose of UV irradiation. Consistent with these in vivo observations, we found that the amount of CAF-1 required to stimulate nucleosome assembly during the repair of UV photoproducts in vitro depended upon both the number of lesions and the phosphorylation state of CAF-1. The recruitment of CAF-1 to chromatin in response to UV irradiation of human cells described here supports a physiological role for CAF-1 in linking chromatin assembly to DNA repair.
Figures
Figure 5
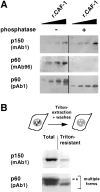
In G2 cells, the phosphorylated form of p60 is underrepresented in the Triton-resistant fraction. (A) Antibody specificity was determined by Western blotting using recombinant CAF-1 protein (rCAF-1) protein from baculovirus-infected insect cells. CAF-1, either treated (+) or not treated (−) with Lambda phosphatase, was loaded in various quantities (10, 20, 40, and 80 ng). The Western blots were probed with monoclonal antibodies against p150 (p150, mAb1) and p60 (p60, mAb96) as well as with a polyclonal antibody against p60 (p60, pAb1). (B) G2 cells were obtained as described in Fig. 4. Proteins from either whole cells (Total) or Triton-extracted cells (Triton-resistant) were analyzed by Western blotting. In each case, a lysate corresponding to 2.5 × 10⁵ cells was loaded. The monoclonal antibody against p150 (p150, mAb1) and the polyclonal antibody against p60 (p60, pAb1) were used to probe the same blot. Multiple forms, multiple forms of the p60 subunit of CAF-1; asterisk, the slowest migration form.
Figure 4
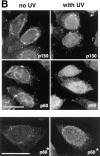
UV irradiation of G2 cells induces a significant increase of the immunofluorescence staining corresponding to the Triton-resistant fraction of p150 and p60 subunits of CAF-1. (A) Cells were synchronized by addition of hydroxyurea (HU). After release, G2 cells (FACScan™ analysis, t =
0, G2) were either immediately UV irradiated at 30 J/m2 (UV pulse) or not irradiated (no UV) and harvested after a 2-h recovery time period. FACScan™ analysis revealed that the majority of UV-irradiated cells were arrested in G2 (t =
2 h, G2 [UV]), whereas a significant proportion of nonirradiated cells were able to reach the G2/M transition (t =
2 h, G2/M). The x and y axis in the FACScans™ are in arbitrary units. (B) A comparison between cells corresponding to the FACScan™ analysis presented in A: t =
0, G2 (left, no UV) and t = 2 h, G2 (UV) (right, with UV). After Triton extraction, cells were fixed and stained with monoclonal antibodies against p150 (p150), monoclonal antibodies against p60 (p60), or a polyclonal antibody against p60 (p60*). Top (p150 and p60) represents data collected using a a standard epifluorescence microscope whereas the bottom panel (p60*) shows a confocal analysis accumulating four optical sections of 1 μm. Bar, 10 μm.
Figure 8
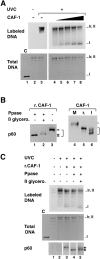
Titration conditions for recombinant CAF-1 to support nucleosome assembly during UV-induced synthesis and competence of various phosphorylated forms in the assay. (A) Plasmid DNA, either treated with UV-C at 500 J/m2 (+) or not treated (−) were incubated in a cytosolic extract in the presence of [α-32P] dCTP. Complementation in the supercoiling assay was achieved with increasing amounts of recombinant CAF-1 (solid triangle), 0 ng (lanes 2, 3, and 4), 5 ng (lane 5), 10 ng (lane 6), 20 ng (lane 7), or 40 ng (lane 8). Deproteinized DNA was purified and analyzed by agarose gel electrophoresis. The incorporation of radiolabel due to the UV-dependent DNA synthesis was visualized by autoradiography (Labeled DNA) and the total population of DNA molecules by ethidium bromide staining of the gel (Total DNA). Plasmids were processed as indicated in Materials and Methods. The positions of the supercoiled (form I), nicked (form Ir), and closed circular (form II) forms of plasmid DNA are indicated. Control supercoiled DNA was run in parallel (lane 1). (B) Recombinant CAF-1 was treated with Lambda phosphatase alone (lane 1), in the presence of β-glycerophosphate (lane 2) or mock treated (lanes 3 and 5), mitotic extract (M) and nuclear interphasic extract (I) were prepared as described (see Materials and Methods). All samples were processed for Western blot analysis and detection with the polyclonal anti–p60 antibody (p60). Bracket, various phosphorylation forms. (C) The three sources of recombinant CAF-1 (r.CAF-1): treated with Lambda phosphatase alone (lane 4), in the presence of β-glycerophosphate (lane 5), or mock treated (lane 3) (shown in B, left) were used in the assay as described above. The amount added per reaction was 10 ng (defined as the critical amount in A). The presence and amount of the phosphorylated p60 subunit of CAF-1 (exogenous and endogenous) at the end of each reaction was assessed by Western blotting using the polyclonal anti-p60 antibody (p60). Asterisk, slowest migrating phosphorylated form of p60.
Figure 1
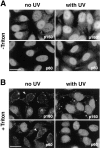
UV irradiation of HeLa cells induces an increase in the immunofluorescence staining and the Triton-resistance of p150 and p60 subunits of CAF-1. Asynchronous HeLa cells irradiated at 30 J/m2 (with UV) were compared with untreated cells (no UV). UV-irradiated cells were allowed to recover in growth medium for 2 h before immunofluorescence analysis. (A) Cells fixed directly with formaldehyde (−Triton) or (B) cells extracted with Triton X-100 (+Triton) before fixation. The p150 and p60 subunits of CAF-1 were visualized using the monoclonal antibodies mAb1 and mAb96. White arrows, cells with a low staining intensity. Bars, 10 μm.
Figure 2
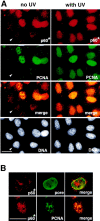
The p60 subunit of CAF-1 and PCNA similarly become Triton-resistant in response to UV irradiation. (A) Asynchronous HeLa cells, either untreated (no UV) or irradiated with UV (with UV), were extracted with Triton X-100 before fixation. The p60 subunit of CAF-1 (p60*) was visualized in red using a polyclonal antibody (pAb1) and PCNA labeled in green in the same cells using monoclonal antibody PC10. DAPI staining in grey (DNA) locates all the nuclei, including those with no signal detected for the immunolabeling (white arrow). The merge of the PCNA and p60 signals in yellow allows identification of positive cells for both markers. (B) A higher magnification control for the integrity of nuclei following the Triton extraction procedure by a double immunostaining using a polyclonal antibody against p60 (p60*, red) and a monoclonal antibody against nucleoporins (pore, green) performed with nonirradiated cells extracted with Triton. A cell displaying a typical weak staining for the p60 marker is presented in the top panel (see also Fig. 1_B_, white arrow). The bottom panel shows at the same magnification a typical cell displaying a positive staining for both p60 (p60*, red) and PCNA (green). Bars, 10 μm.
Figure 3
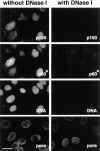
The immunofluorescence staining corresponding to the Triton-resistant fraction of the p150 and p60 subunits disappears following DNase I treatment. Asynchronous cells were extracted with Triton in the absence (without DNase I) or in the presence of 0.1 mg/ml DNase I (with DNase I). After fixation, cells were stained with a monoclonal anti-p150 antibody (p150) and polyclonal anti-p60 antibody (p60*). DAPI staining (DNA) confirmed the disappearance of DNA after DNase I digestion. Monoclonal antinucleoporins antibody (pore) was used to verify the integrity of the nuclear envelope. Bar, 10 μm.
Figure 6
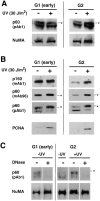
UV irradiation of both G1 and G2 cells promotes the chromatin association of a phosphorylated form of p60. (A) Cells synchronized in early G1 or G2 phase were either immediately harvested (−) or subjected (+) to UV irradiation at 30 J/m2 followed by a 2-h recovery period. Total lysates were processed for Western blotting and detection was achieved using both the polyclonal anti-p60 antibody (p60, pAb1) and monoclonal anti-NuMA antibody (NuMA) as a control for extraction and protein loading. (B) The cells were Triton-extracted and an equivalent of 2.5 × 10⁵ cells for G2 cells or 5 × 10⁵ cells for G1 cells, corresponding to the postmitotic doubling of the cell population were lysed and processed for Western blotting. Detection was achieved with monoclonal anti-p150 (p150, mAb1), monoclonal anti-p60 (p60, mAb96), polyclonal anti-p60 (p60, pAb1) and monoclonal anti-PCNA (PCNA) antibodies. (C) DNase I digestion was performed in parallel with G1 or G2 cells in the absence of UV irradiation (−UV) and with UV-irradiated G2 cells (+UV) at 30 J/m2. The cells were Triton-extracted in the absence (−) or presence (+) of 0.1 mg/ml DNase I. Lysates equivalent to 2.5 × 10⁵ cells were analyzed by Western blotting using both the polyclonal anti-p60 antibody (p60, pAb1) and monoclonal anti-NuMA antibody (NuMA) as a control for extraction and protein loading. Asterisk, slowest migration position of the p60 subunit.
Figure 7
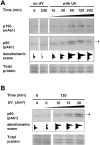
Time course and UV dose response in the Triton-resistant fraction of p150 and p60 in G2 cells. (A) Time course analysis: G2 cells, either UV-irradiated at 30 J/m2 (with UV) or not irradiated (no UV) were harvested after various recovery time periods (min) and extracted with Triton X-100. Lysates (equivalent to 2.5 × 10⁵ cells) were analyzed by Western blotting using both a monoclonal anti-p150 (p150, mAb1) and a polyclonal anti-p60 (p60, pAb1) on the same filter. (B) UV dose response: G2 cells irradiated with increasing doses of UV-C (0, 10, 15, or 30 J/m 2) were harvested after a 2-h recovery period and processed as in A. Asterisk, phosphorylated form of the p60 subunit of CAF-1. Densitometric scans of the p60 signal are presented underneath. Protein recovery (Total protein) and loading for each sample was assessed by ponceau S staining of the filters used to detect p60.
Figure 9
The capacity of CAF-1 to support nucleosome assembly during UV- induced synthesis depends on both the number of lesion/repair sites and the phosphorylation form of CAF-1. (A) Plasmid DNA, either treated with UV-C (150 and 300 J/m2) or not treated (0) were incubated in a cytosolic extract in the presence of [α-32P] dCTP. Complementation in the supercoiling assay was achieved with increasing amounts of recombinant CAF-1, which was either not treated (solid triangle) or treated before its use with Lambda phosphatase (open triangle): 5 ng (lanes 3, 7, 11, and 15), 10 ng (lanes 4, 8, 12, and 16), 20 ng (lanes 5, 9, 13, and 17) or 40 ng (lanes 6, 10, 14, and 18). Deproteinized DNA was purified and analysed by agarose gel electrophoresis. The incorporation of radiolabel due to the UV-induced DNA synthesis was visualized by autoradiography (Labeled DNA) and the total population of DNA molecules by ethidium bromide staining of the gel (Total DNA). Plasmids were processed as indicated in Materials and Methods. The positions of the supercoiled (form I), nicked (form Ir), and closed circular (form II) forms of plasmid DNA are indicated. Control supercoiled DNA (C) was run in parallel. The presence and amount of the phosphorylated p60 subunit of CAF-1 (exogenous and endogenous) at the end of each reaction was assessed by Western blotting using the polyclonal anti-p60 antibody (p60). Asterisk, slowest migrating phosphorylated form of p60. (B) Data from experiments as described above using plasmid DNA treated with UV-C (150, 300, and 500 J/m2) and increasing amounts of recombinant CAF-1 either not treated (___) or treated before its use with Lambda phosphatase (- - -) were quantified using a PhosphorImager and ImageQuant software. The percentage of form I in the labeled plasmid (%) is represented as a function of the amount of CAF-1 provided in various phosphorylation status (ng).
Similar articles
- Nucleosome assembly activity and intracellular localization of human CAF-1 changes during the cell division cycle.
Marheineke K, Krude T. Marheineke K, et al. J Biol Chem. 1998 Jun 12;273(24):15279-86. doi: 10.1074/jbc.273.24.15279. J Biol Chem. 1998. PMID: 9614144 - Chromatin assembly factor-1, a marker of clinical value to distinguish quiescent from proliferating cells.
Polo SE, Theocharis SE, Klijanienko J, Savignoni A, Asselain B, Vielh P, Almouzni G. Polo SE, et al. Cancer Res. 2004 Apr 1;64(7):2371-81. doi: 10.1158/0008-5472.can-03-2893. Cancer Res. 2004. PMID: 15059888 - Essential role of chromatin assembly factor-1-mediated rapid nucleosome assembly for DNA replication and cell division in vertebrate cells.
Takami Y, Ono T, Fukagawa T, Shibahara K, Nakayama T. Takami Y, et al. Mol Biol Cell. 2007 Jan;18(1):129-41. doi: 10.1091/mbc.e06-05-0426. Epub 2006 Oct 25. Mol Biol Cell. 2007. PMID: 17065558 Free PMC article. - The ins and outs of nucleosome assembly.
Mello JA, Almouzni G. Mello JA, et al. Curr Opin Genet Dev. 2001 Apr;11(2):136-41. doi: 10.1016/s0959-437x(00)00170-2. Curr Opin Genet Dev. 2001. PMID: 11250135 Review. - Nucleosome assembly: the CAF and the HAT.
Kaufman PD. Kaufman PD. Curr Opin Cell Biol. 1996 Jun;8(3):369-73. doi: 10.1016/s0955-0674(96)80012-3. Curr Opin Cell Biol. 1996. PMID: 8743889 Review.
Cited by
- Chromatin structure-dependent histone incorporation revealed by a genome-wide deposition assay.
Tachiwana H, Dacher M, Maehara K, Harada A, Seto Y, Katayama R, Ohkawa Y, Kimura H, Kurumizaka H, Saitoh N. Tachiwana H, et al. Elife. 2021 May 10;10:e66290. doi: 10.7554/eLife.66290. Elife. 2021. PMID: 33970102 Free PMC article. - Reduction of nucleosome assembly during new DNA synthesis impairs both major pathways of double-strand break repair.
Lewis LK, Karthikeyan G, Cassiano J, Resnick MA. Lewis LK, et al. Nucleic Acids Res. 2005 Sep 1;33(15):4928-39. doi: 10.1093/nar/gki806. Print 2005. Nucleic Acids Res. 2005. PMID: 16141196 Free PMC article. - Contribution of CAF-I to anaphase-promoting-complex-mediated mitotic chromatin assembly in Saccharomyces cerevisiae.
Harkness TA, Arnason TG, Legrand C, Pisclevich MG, Davies GF, Turner EL. Harkness TA, et al. Eukaryot Cell. 2005 Apr;4(4):673-84. doi: 10.1128/EC.4.4.673-684.2005. Eukaryot Cell. 2005. PMID: 15821127 Free PMC article. - Duplication and maintenance of heterochromatin domains.
Taddei A, Roche D, Sibarita JB, Turner BM, Almouzni G. Taddei A, et al. J Cell Biol. 1999 Dec 13;147(6):1153-66. doi: 10.1083/jcb.147.6.1153. J Cell Biol. 1999. PMID: 10601331 Free PMC article. - Dimerization of the largest subunit of chromatin assembly factor 1: importance in vitro and during Xenopus early development.
Quivy JP, Grandi P, Almouzni G. Quivy JP, et al. EMBO J. 2001 Apr 17;20(8):2015-27. doi: 10.1093/emboj/20.8.2015. EMBO J. 2001. PMID: 11296234 Free PMC article.
References
- Aboussekhra A, Wood RD. Detection of nucleotide excision repair incisions in human fibroblasts by immunostaining for PCNA. Exp Cell Res. 1995;221:326–332. - PubMed
- Aparicio OM, Billington BL, Gottschling DE. Modifiers of position effect are shared between telomeric and silent mating-type loci in S. cerevisiae. . Cell. 1991;66:1279–1287. - PubMed
Publication types
MeSH terms
Substances
LinkOut - more resources
Full Text Sources
Other Literature Sources
Molecular Biology Databases
Miscellaneous
