The R Graph Gallery – Help and inspiration for R charts (original) (raw)
![]()
Welcome to the R graph gallery, a collection of charts made with theR programming language. Hundreds of charts are displayed in several sections, always with their reproducible code available. The gallery makes a focus on the tidyverse and ggplot2. Feel free to suggest a chart orreport a bug: any feedback is highly welcome! Note that if you like this gallery, you'll love mynewsletter!
One short, impactful dataviz tip delivered to your inbox each Saturday.
The Largest Collection of R Chart Examples
The R Graph Gallery boasts themost extensive compilation of R-generated graphs on the web.
Featuring over 400 examples, our collection is meticulously organized into nearly 50 chart types, following thedata-to-viz classification. Each example comes with reproducible code and a detailed explanation of its functionality.
We begin each chart type with a foundational tutorial that outlines its core structure and purpose. Once you've grasped the basics, our step-by-step guides offer insights into elementary customizations. This ensures that your charts not only visualize data effectively but also resonate with your unique requirements.
Distribution

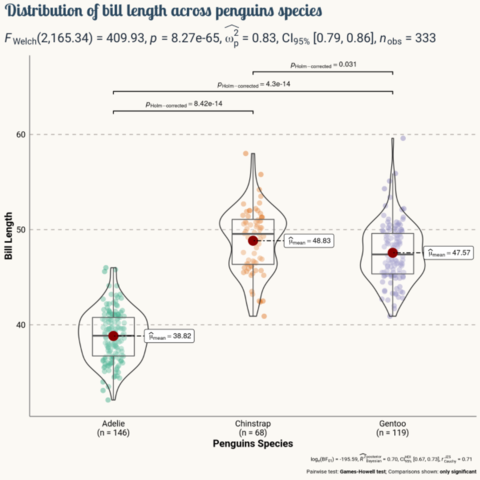
Violin
Density

Histogram

Boxplot

Ridgeline
Beeswarm
Correlation

Scatter

Heatmap

Correlogram

Bubble

Connected scatter

Density 2d
Ranking

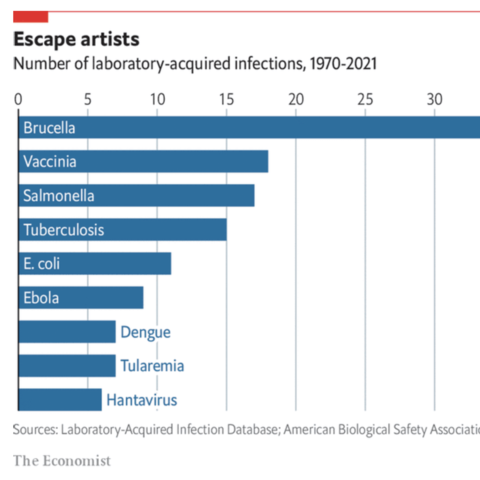
Barplot

Spider / Radar

Wordcloud

Parallel

Lollipop

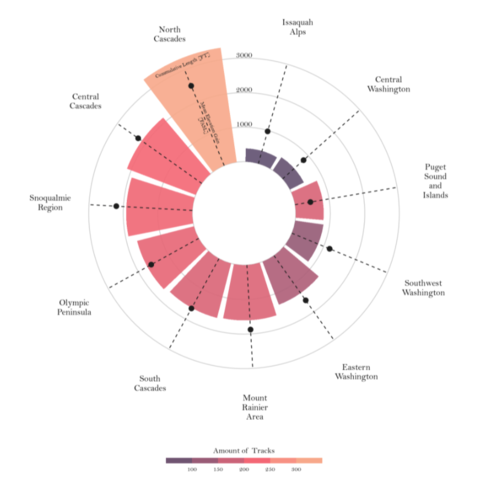
Circular Barplot
Table
Part of a whole

Grouped and Stacked barplot

Treemap

Doughnut

Pie chart

Dendrogram

Circular packing
Waffle
Evolution

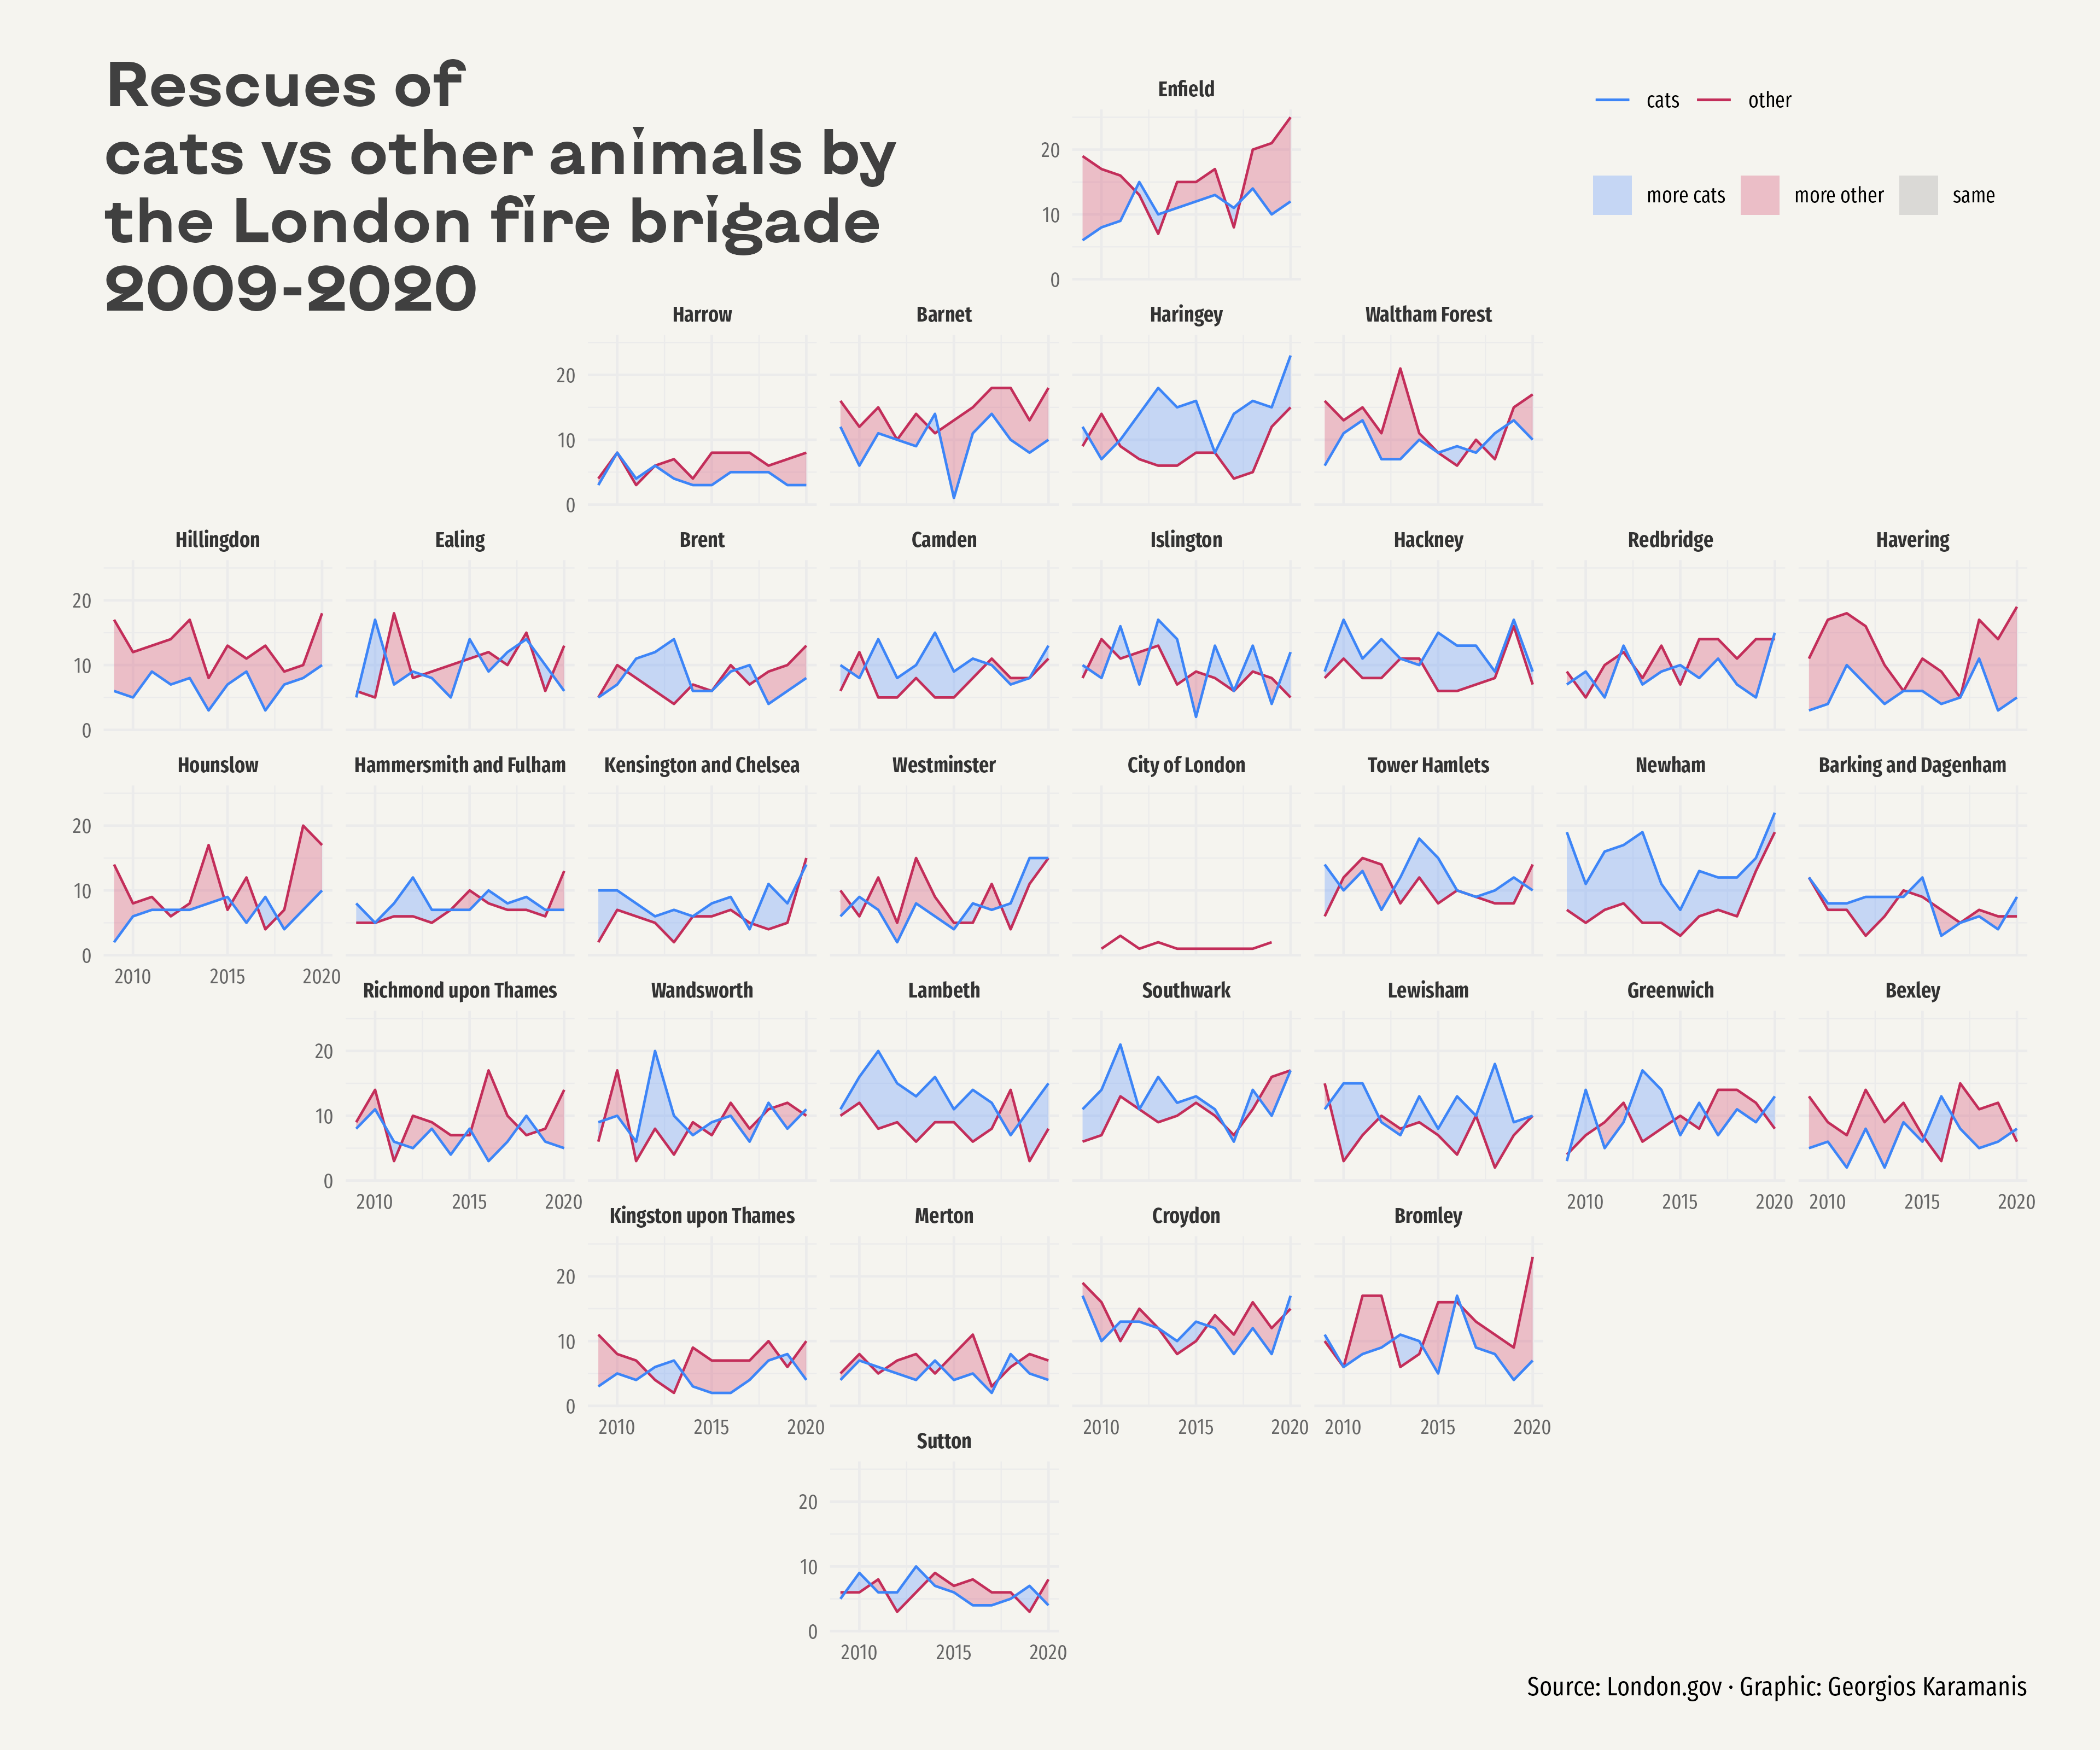
Line plot

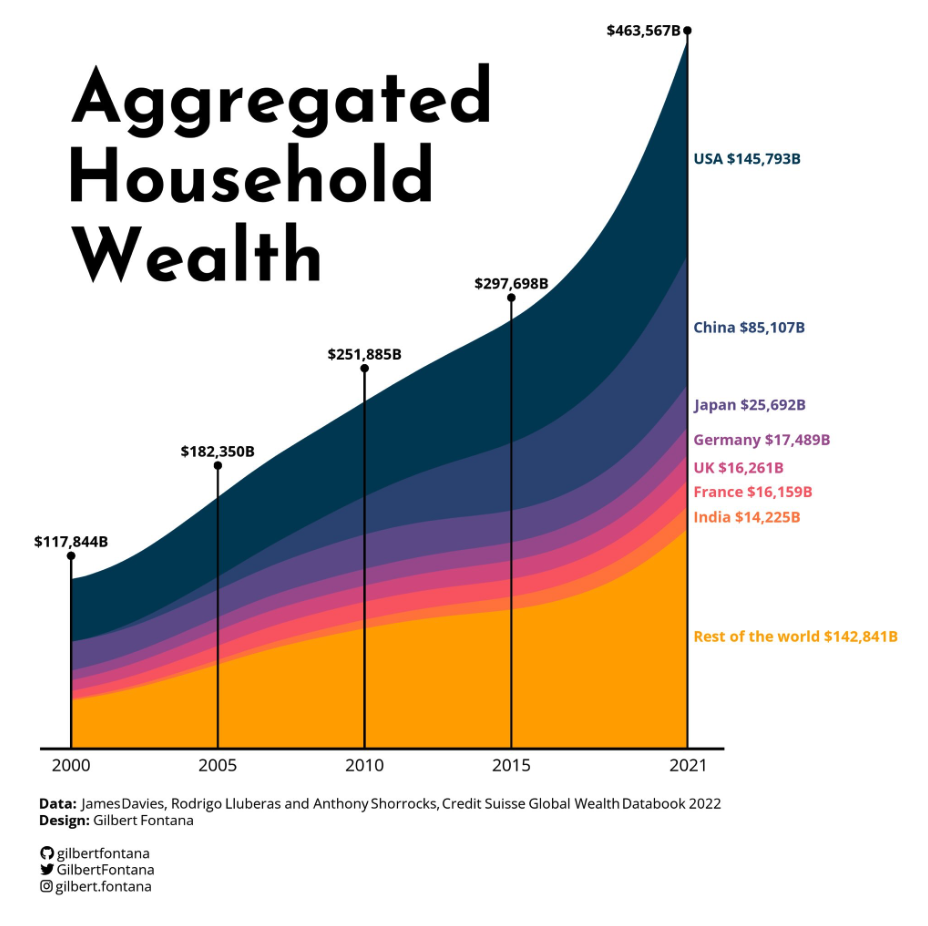
Area

Stacked area

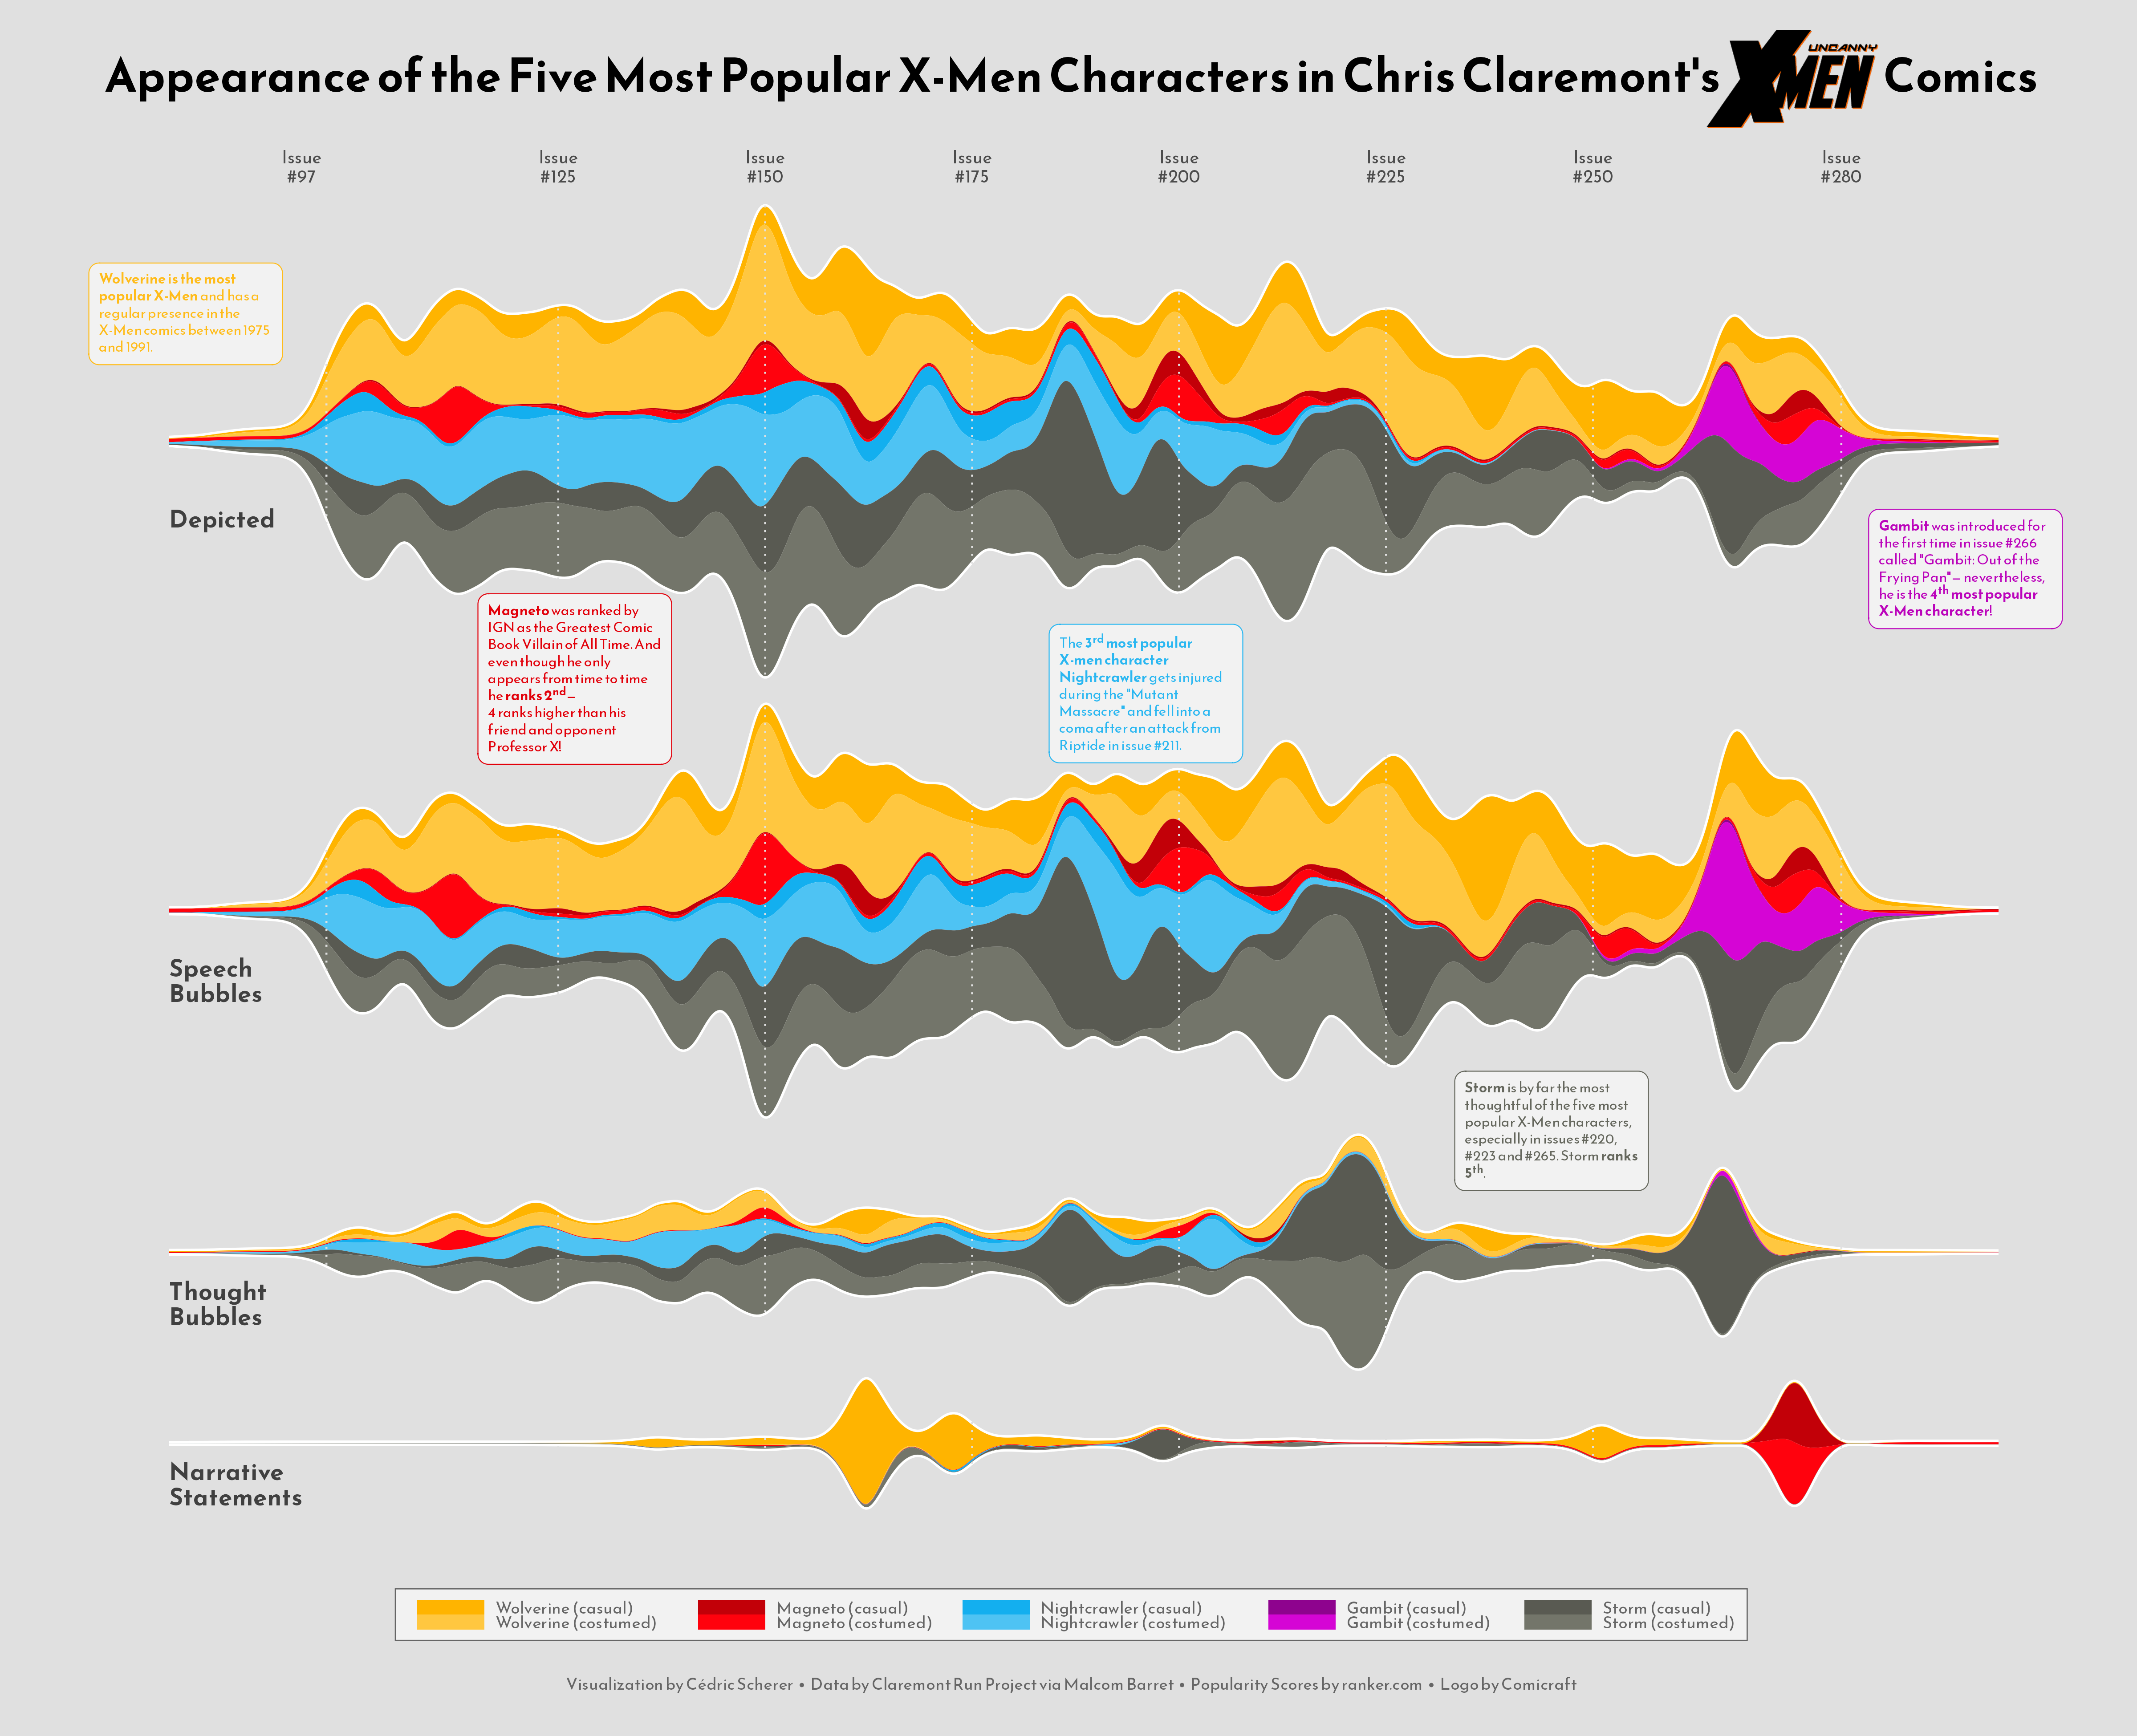
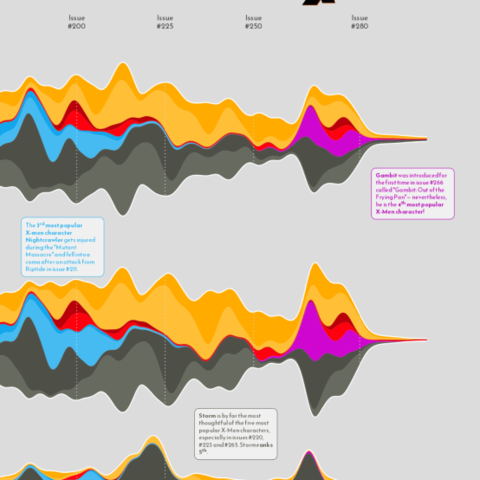
Streamchart

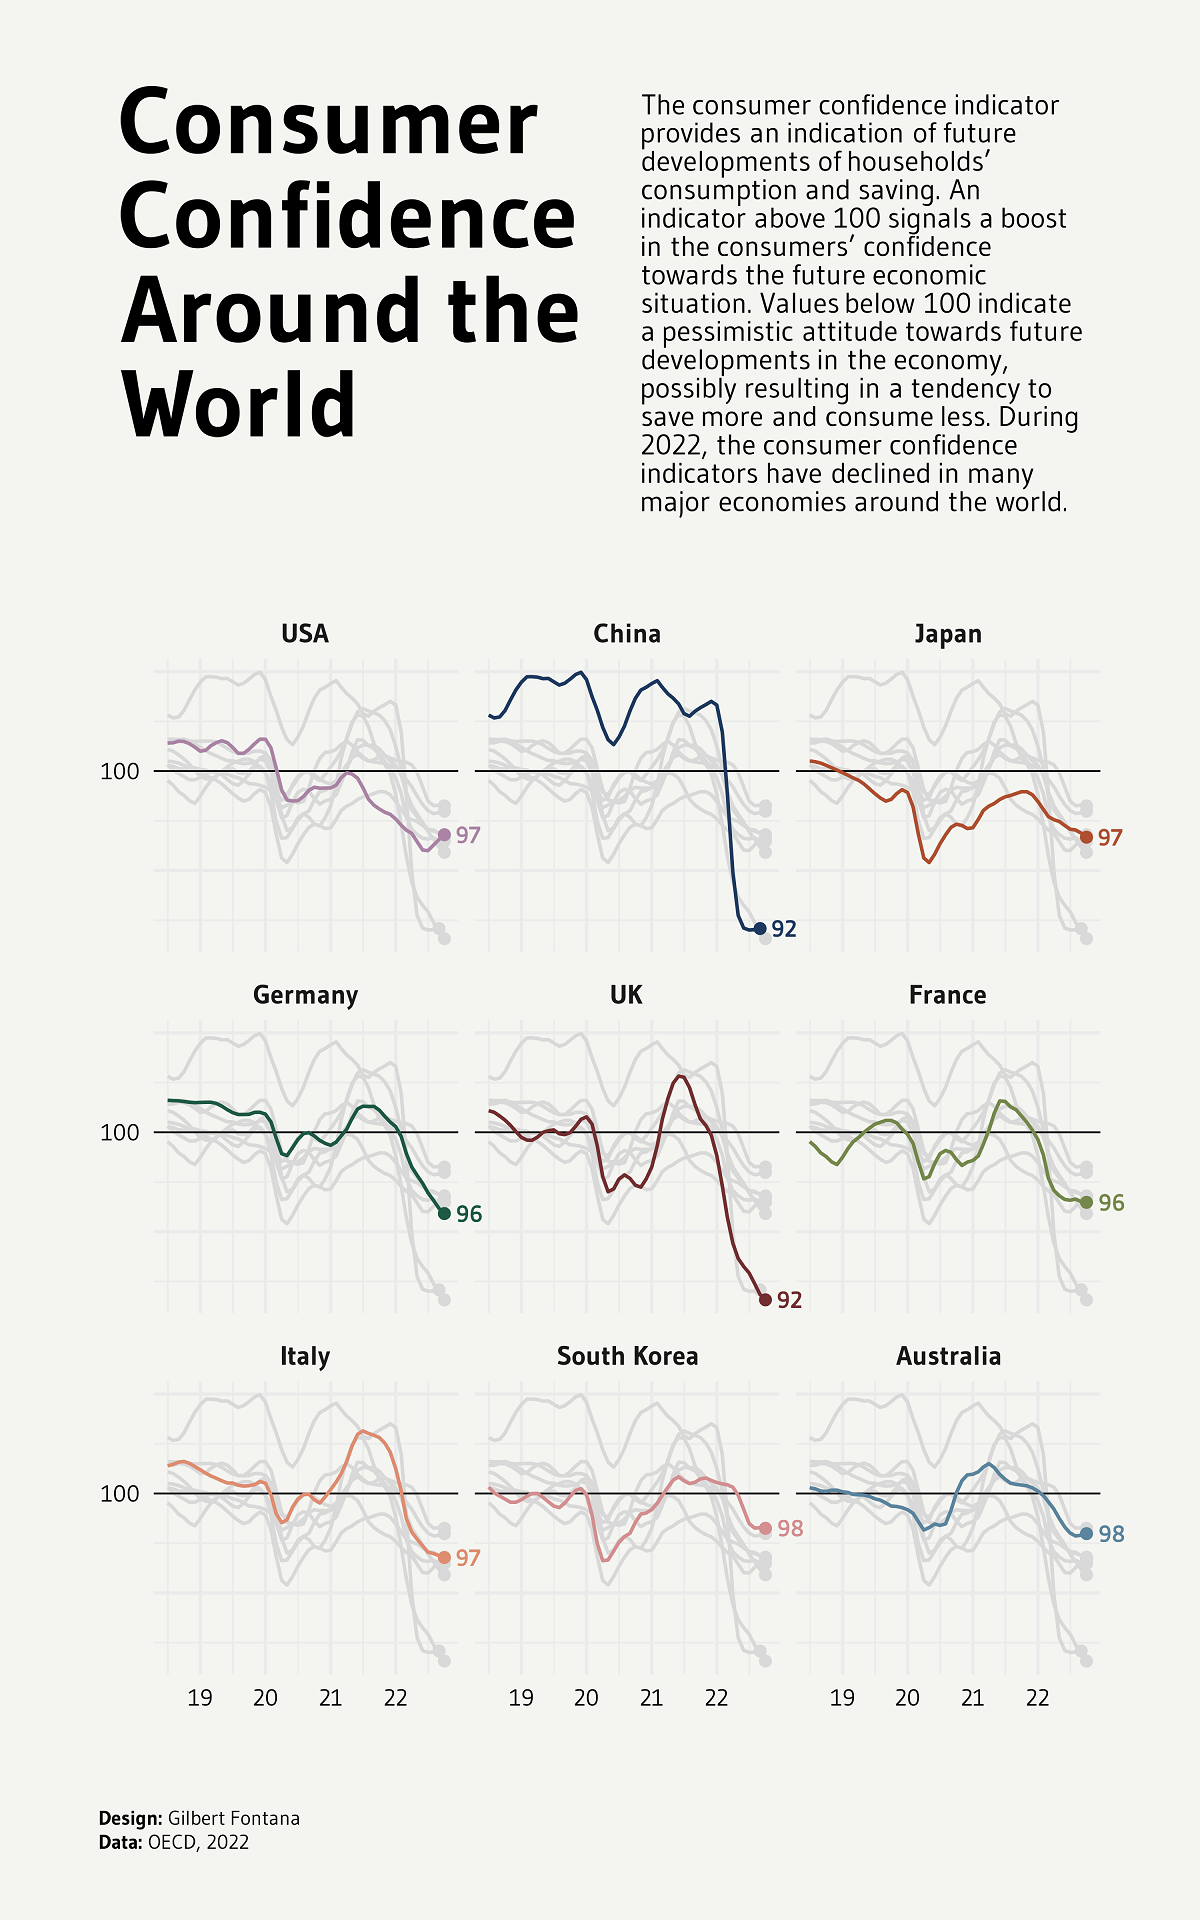
Time Series
Map

Map

Choropleth

Hexbin map
Cartogram

Connection

Bubble map
Flow

Chord diagram

Network

Sankey

Arc diagram
Edge bundling
General knowledge

Cheatsheets

Animation
Interactivity

3D

Caveats

Data art

Colors
Best packages
The Best R Charts
We're on a relentless quest to showcase thefinest graphs created with R.
Our team scours theinternet, follows leading creators onTwitter, and examinesTidy Tuesday submissions. As a result, our R Graph Gallery is a curated collection of the most exceptional R-based visualizations.
Exploring these remarkable data visualization projects will not onlyinspire you but also provide templates andcode snippets that you won't find in beginner-level tutorials.
Dive into this section and elevate your R data visualization skills to new heights. 🔥
What chart type should you use?
Choosing the right chart type for a dataset can be challenging.
The R Graph Gallery is connected toData To Viz, a project that offers a decision tree to help you find the available chart type based on your data format. It then explores the various options to guide you toward the right choice!
