How to Draw a Link Analysis Diagram (original) (raw)

Professional Flowcharting Software
This page tells you how to draw a link analysis diagram using RFFlow. A more thorough understanding of link analysis can be obtained by taking a complete course such as "Analytical Investigative Techniques I" which is offered by the Multijurisdictional Counterdrug Task Force Training (MCTFT) program. MCTFT courses are free and offered in a partnership between the Florida National Guard and St. Petersburg Junior College. For more information seemctft.org.
1. Establish the Data Points
A link analysis diagram shows the relationships between a number of people and organizations in a visual form. The first step is to determine what people and organizations or businesses are involved. The analyst studies intelligence reports and identifies the people, businesses, and organizations pertinent to the investigation. As an example, we will follow a very simplified, imaginary case. All the names and information are fictitious. The following information was found from intelligence reports:
" A1 Junkyard, owned by Bill and Sam, has sold stolen parts to undercover agents. Surveillance has observed Bob bringing in stolen parts to A1 Junkyard. Joe was also in the A1 Junkyard when Bob delivered the stolen parts."
So the data points are: Bill, Sam, A1 Junkyard, Bob and Joe. This simple case has one Business and four people.
2. Run RFMatrix
If you don't have RFFlow yet, you can download the free RFFlow trial version. In RFFlow, click Tools, Auto Charts, and Association Matrix. This will run the RFMatrix program.
3. Enter the Data Points
Type the name "Bob" into the text box at the lower left of the RFMatrix program and click  . Do this for all four names. In a real case, you would be using full names, like "Bob Smith." You can enter either "Bob Smith" or "Smith, Bob." Type the business "A1 Junkyard" into the text box and click
  . A business or organization will be listed using blue text so it easily identified as a business.
4. Put the Names in Alphabetical Order
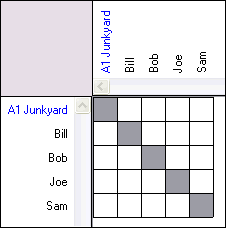
The names will show up in the list at the left in the order they were entered. You can quickly put them in alphabetical order by clicking  . The leftmost character is used when alphabetizing names so the order will be different if you enter the names as "First Last" or "Last, First." Now the center of the RFMatrix screen should look like this:
5. Add the Relationships
There are three association codes:
 known, confirmed association
 suspected association
 key individual
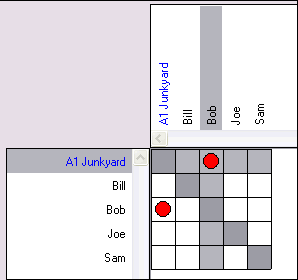
 This represents a strong, certain connection between two persons or a person and an organization. For example, Bob was observed bringing stolen parts to the A1 Junkyard, so there is a known association between Bob and the A1 Junkyard. A confirmed relationship is known to exist and the analyst is prepared to defend this assertion. If there is any doubt, don't mark the relationship as a known association.
To add this to RFMatrix, first click on the word "A1 Junkyard" in the list on the left. Then click on "Bob" in the top list. Go to the intersection of these two selected items and right-click on the intersection point. A menu will appear and click "Bob has a known association with A1 Junkyard." Two  symbols will appear because there are two intersections of A1 Junkyard and Bob in the diagram.
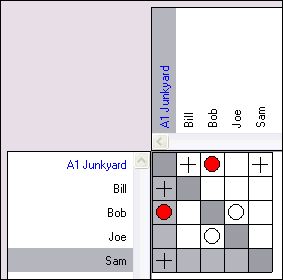
 This symbol shows a weak or uncertain link between people or an organization. A relationship probably exists, but definitive proof is lacking. There is a suspected association. From the intelligence reports, we know that there is a suspected relationship between Joe and Bob. Left-click on "Joe" in the list on the left and left-click on Bob in the top list. Then right-click on the intersection of these two selected items and choose "Joe has a suspected relationship with Bob."
 This symbol shows that a person is a key individual of an organization or business. Bill and Sam are co-owners of A1 Junkyard so they are key individuals. Left-click on Bill in the list on the left of RFMatrix. Left-click on A1 Junkyard in the top list. Then right-click on the intersection of these two selected areas and choose "Bill is a key individual in A1 Junkyard." Next left-click on Sam in the list on the left of RFMatrix. Go to the intersection of Sam and A1 Junkyard and right-click. In the menu that appears choose "Sam is a key individual in A1 Junkyard."
6. Edit the Names
If you typed a name incorrectly, you can right-click on it in the left list and choose Edit Text in the drop-down menu. You can also move a name up or down in the list or delete it in this menu.
7. Save the Matrix
Click File in the main menu of RFMatrix and Save. Select a folder and give the matrix a name. Just type in the name, like "A1 Junkyard Investigation" and don't type the extension. The extension will be added by the program automatically.
8. Print the Matrix
Click File in the main menu of RFMatrix and Print. Select the printer. Click the Preferences button if you want to change the paper orientation. Then click the Print button. The matrix is printed in the traditional fashion with names listed once diagonally. In RFMatrix the list of names is duplicated and placed on the left and the top. This allows for scrolling and makes entering relationships easier on big cases.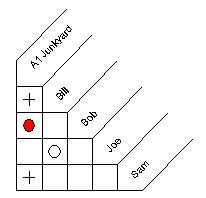
9. Move Data to RFFlow
Run RFFlow, click Tools, Auto Charts, and Link Analysis. In the Link Analysis dialog box, click the round button near: The input data is saved in a .txt file or comma delimited .csv file. Click the Next button.
10. Create a Link Analysis Diagram
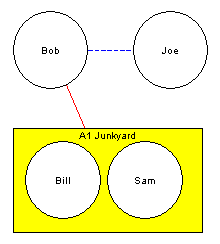
In the Open dialog box, choose the folder to Look in: and click the name of the file you created in step 7. Then click the Open button. The chart will automatically be generated.
11. Edit the Link Analysis Diagram
To move the shapes around, first make sure the  button is pressed down. Then you can drag the names and the lines will stretch. To move the A1 Junkyard box, first draw a selection rectangle around it and then drag it. This will move the box and two circles together. The solid red line shows a confirmed association. The dashed blue line shows a suspected association. You can replace the names with pictures by clicking Insert, Picture from File. Then delete the circle and put the picture in that position. Add text for the name below the picture.
For more information about link analysis, attend the MCTFT course. Go tomctft.org.
RFF Electronics
PO Box 1244  Loveland CO 80539-1244 USA
 Phone 970 663 5767
  www.rff.com
  rff@rff.com
Copyright © 1996-2024 RFF Electronics. All rights reserved.