README (original) (raw)
safetyGraphics: Clinical Trial Monitoring with R
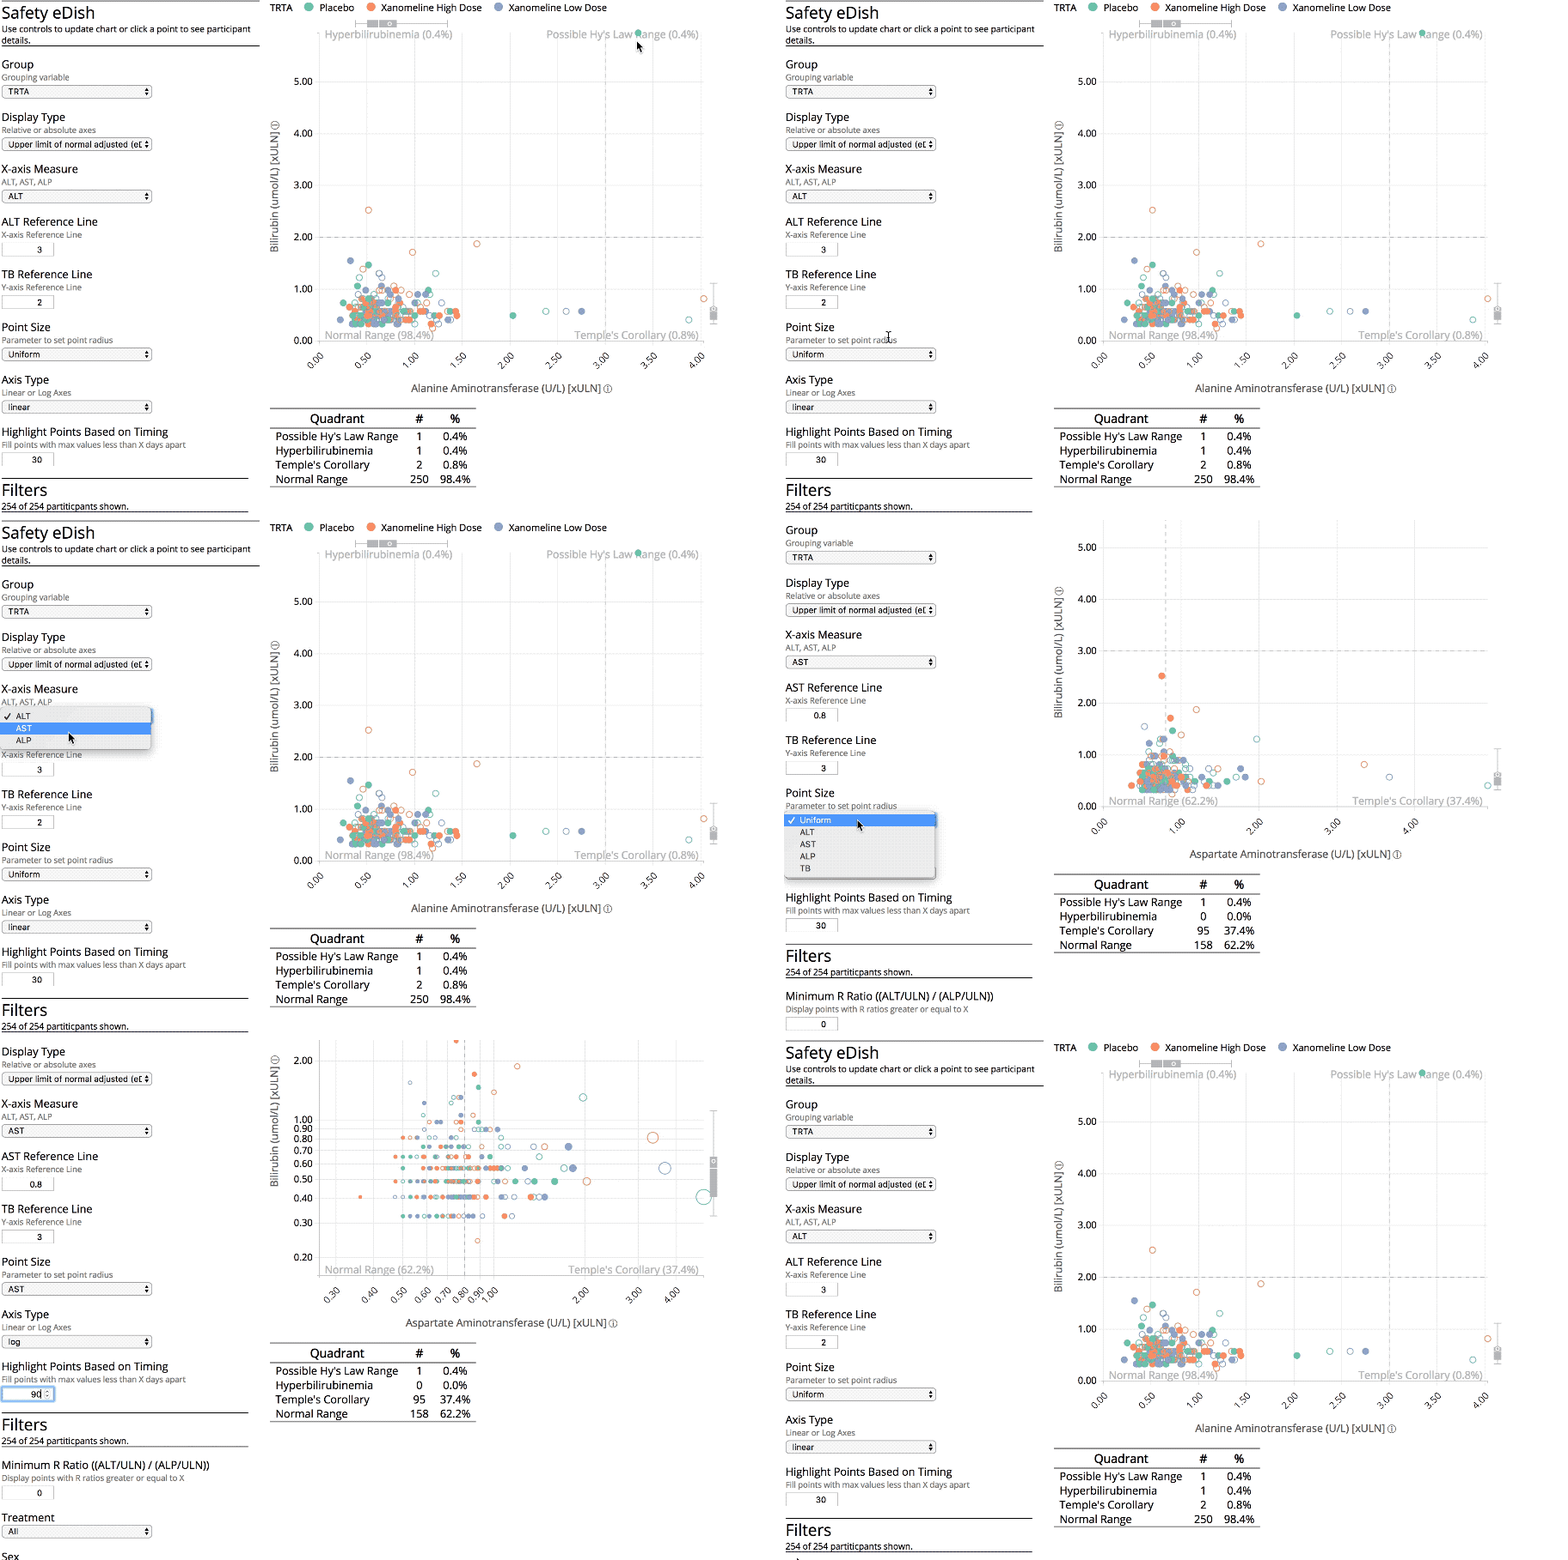
The {safetyGraphics} package provides a framework for evaluating of clinical trial safety in R using a flexible data pipeline. The package includes a shiny application that allows users to explore safety data using a series of interactive graphics, including the hepatic safety explorer shown below. The package has been developed as part of theInteractive Safety Graphics (ISG) workstream of the ASA Biopharm-DIA Safety Working Group.

Using the app
A demo of the app using sample data is available here or can be initialized as follows:
install.packages("safetyGraphics")
library("safetyGraphics")
safetyGraphicsApp() #open the shiny application
The most common workflow is for a user to initialize the app with their data, adjust settings as needed, and view the interactive charts. Finally, the user can share any chart by exporting its source code or by generating a self-contained, fully reproducible report that can be shared with others.
Instructions for loading study data are provided in theintroductory vignette and more complex customizations are provided in thecookbook vignette.
Charts
The app is built to support a wide variety of chart types including static plots (e.g. from{ggplot2}), shiny modules,{htmlwidgets}and even static outputs like RTFs. Several pre-configured charts are included in the companion{safetyCharts}R Package, and are available by default in the app. Other charts can be added using the process descibed inthis vignette.