numpy.random.poisson — NumPy v1.11 Manual (original) (raw)
numpy.random.poisson(lam=1.0, size=None)
Draw samples from a Poisson distribution.
The Poisson distribution is the limit of the binomial distribution for large N.
| Parameters: | lam : float or sequence of float Expectation of interval, should be >= 0. A sequence of expectation intervals must be broadcastable over the requested size. size : int or tuple of ints, optional Output shape. If the given shape is, e.g., (m, n, k), thenm * n * k samples are drawn. Default is None, in which case a single value is returned. |
|---|---|
| Returns: | samples : ndarray or scalar The drawn samples, of shape size, if it was provided. |
Notes
The Poisson distribution
For events with an expected separation  the Poisson distribution
  describes the probability of
 events occurring within the observed interval .
Because the output is limited to the range of the C long type, a ValueError is raised when lam is within 10 sigma of the maximum representable value.
References
| [R255] | Weisstein, Eric W. “Poisson Distribution.” From MathWorld–A Wolfram Web Resource.http://mathworld.wolfram.com/PoissonDistribution.html |
|---|
| [R256] | Wikipedia, “Poisson distribution”,http://en.wikipedia.org/wiki/Poisson_distribution |
|---|
Examples
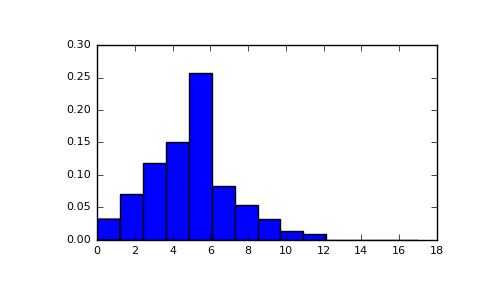
Draw samples from the distribution:
import numpy as np s = np.random.poisson(5, 10000)
Display histogram of the sample:
import matplotlib.pyplot as plt count, bins, ignored = plt.hist(s, 14, normed=True) plt.show()
(Source code, png, pdf)
Draw each 100 values for lambda 100 and 500:
s = np.random.poisson(lam=(100., 500.), size=(100, 2))
()