numpy.random.uniform — NumPy v1.11 Manual (original) (raw)
numpy.random.uniform(low=0.0, high=1.0, size=None)
Draw samples from a uniform distribution.
Samples are uniformly distributed over the half-open interval[low, high) (includes low, but excludes high). In other words, any value within the given interval is equally likely to be drawn by uniform.
| Parameters: | low : float, optional Lower boundary of the output interval. All values generated will be greater than or equal to low. The default value is 0. high : float Upper boundary of the output interval. All values generated will be less than high. The default value is 1.0. size : int or tuple of ints, optional Output shape. If the given shape is, e.g., (m, n, k), thenm * n * k samples are drawn. Default is None, in which case a single value is returned. |
|---|---|
| Returns: | out : ndarray Drawn samples, with shape size. |
See also
Discrete uniform distribution, yielding integers.
Discrete uniform distribution over the closed interval [low, high].
Floats uniformly distributed over [0, 1).
Alias for random_sample.
Convenience function that accepts dimensions as input, e.g., rand(2,2) would generate a 2-by-2 array of floats, uniformly distributed over [0, 1).
Notes
The probability density function of the uniform distribution is

anywhere within the interval [a, b), and zero elsewhere.
Examples
Draw samples from the distribution:
s = np.random.uniform(-1,0,1000)
All values are within the given interval:
np.all(s >= -1) True np.all(s < 0) True
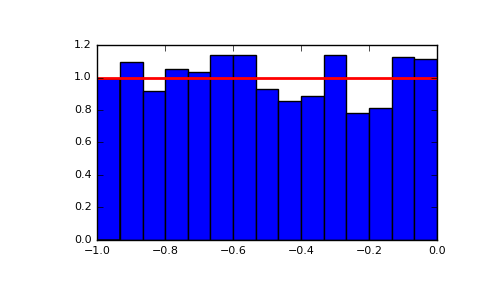
Display the histogram of the samples, along with the probability density function:
import matplotlib.pyplot as plt count, bins, ignored = plt.hist(s, 15, normed=True) plt.plot(bins, np.ones_like(bins), linewidth=2, color='r') plt.show()
(Source code, png, pdf)