locstats - calculate statistics on DWARF debug location — LLVM 21.0.0git documentation (original) (raw)
SYNOPSIS
llvm-locstats [_options_] [_filename_]
DESCRIPTION
llvm-locstats works like a wrapper around llvm-dwarfdump. It parses llvm-dwarfdump statistics regarding debug location by pretty printing it in a more human readable way.
The line 0% shows the number and the percentage of DIEs with no location information, but the line 100% shows the information for DIEs where there is location information in all code section bytes (where the variable or parameter is in the scope). The line [50%,60%) shows the number and the percentage of DIEs where the location information is between 50 and 60 percentage of its scope covered.
OPTIONS
--only-variables
calculate the location statistics only for local variables
--only-formal-parameters
calculate the location statistics only for formal parameters
--ignore-debug-entry-values
ignore the location statistics on locations containing the debug entry values DWARF operation
--draw-plot
make histogram of location buckets generated (requires matplotlib)
--compare
compare the debug location coverage on two files provided, and draw a plot showing the difference (requires matplotlib)
EXIT STATUS
llvm-locstats returns 0 if the input file were parsed successfully. Otherwise, it returns 1.
EXAMPLE 1
Pretty print the location coverage on the standard output.
llvm-locstats a.out
================================================= Debug Location Statistics
cov% samples percentage(~) 0% 1 16%
(0%,10%) 0 0%
[10%,20%) 0 0%
[20%,30%) 0 0%
[30%,40%) 0 0%
[40%,50%) 0 0%
[50%,60%) 1 16%
[60%,70%) 0 0%
[70%,80%) 0 0%
[80%,90%) 1 16%
[90%,100%) 0 0%
100% 3 50%================================================= -the number of debug variables processed: 6 -PC ranges covered: 81%
-total availability: 83%
EXAMPLE 2
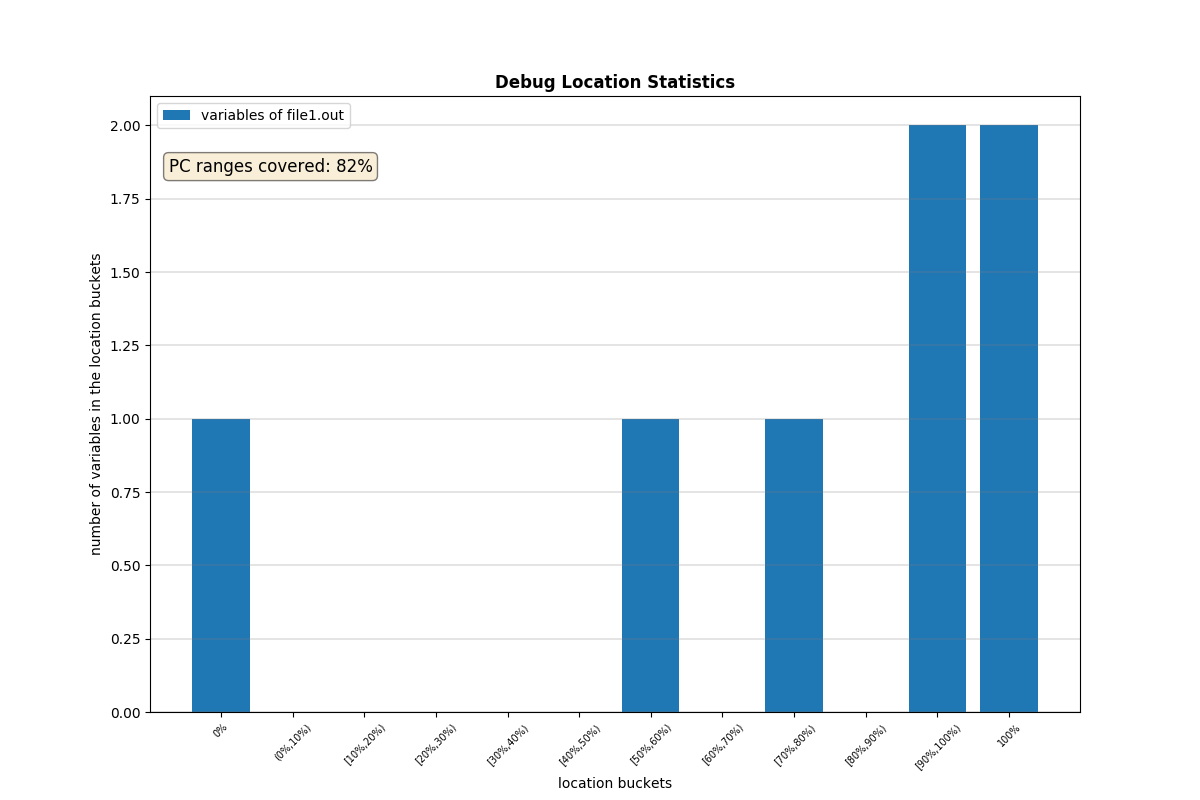
Generate a plot as an image file.
llvm-locstats --draw-plot file1.out
EXAMPLE 3
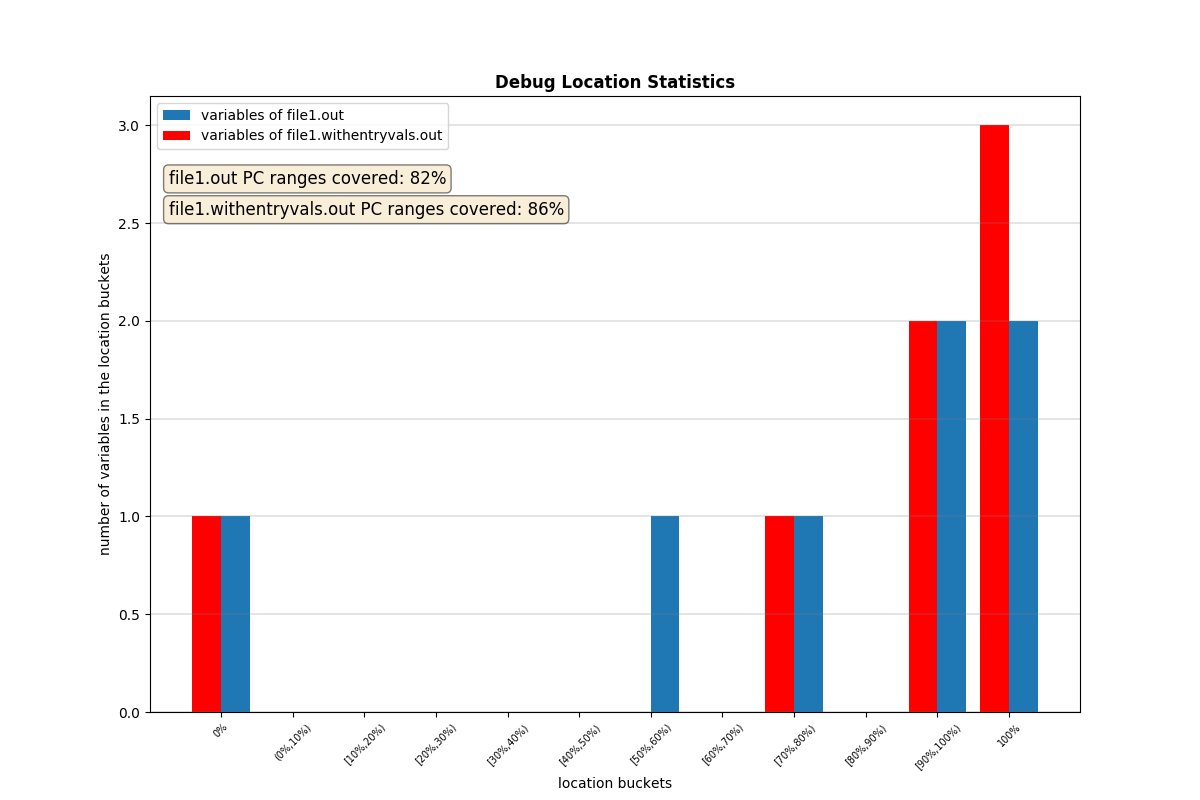
Generate a plot as an image file showing the difference in the debug location coverage.
llvm-locstats --compare file1.out file1.withentryvals.out