CIHR in Numbers - CIHR (original) (raw)
The Canadian Institutes of Health Research (CIHR) is the largest funder of health research in Canada, supporting over 15,000 world-class researchers from all pillars of health research and from all regions of Canada.
The following graphs provide a breakdown of CIHR's investments. For this year and henceforth, the information presented does not include data that precedes CIHR's formation in the 2000-2001 fiscal year.
2023-2024
Figure 1: CIHR Fiscal Year Investments by Primary Theme since 2000-01 (in millions of dollars)

- Due to rounding, figures may not reconcile with other published information
- Excludes operating expenditures and partner contributions
- Primary theme designation is determined by the grantee at the time of application
Figure 1 long description
| Primary theme | 2000-01 | 2001-02 | 2002-03 | 2003-04 | 2004-05 | 2005-06 | 2006-07 | 2007-08 | 2008-09 | 2009-10 | 2010-11 | 2011-12 | 2012-13 | 2013-14 | 2014-15 | 2015-16 | 2016-17 | 2017-18 | 2018-19 | 2019-20 | 2020-21 | 2021-22 | 2022-23 | 2023-24 |
|---|---|---|---|---|---|---|---|---|---|---|---|---|---|---|---|---|---|---|---|---|---|---|---|---|
| Biomedical | 160∣160 | 160∣250 | 312∣312 | 312∣354 | 381∣381 | 381∣419 | 439∣439 | 439∣444 | 474∣474 | 474∣463 | 475∣475 | 475∣458 | 455∣455 | 455∣454 | 471∣471 | 471∣459 | 478∣478 | 478∣472 | 500∣500 | 500∣510 | 643∣643 | 643∣559 | 522∣522 | 522∣530 |
| Clinical | 27∣27 | 27∣47 | 64∣64 | 64∣69 | 77∣77 | 77∣82 | 85∣85 | 85∣101 | 110∣110 | 110∣126 | 129∣129 | 129∣130 | 129∣129 | 129∣130 | 134∣134 | 134∣132 | 134∣134 | 134∣140 | 153∣153 | 153∣164 | 247∣247 | 247∣209 | 238∣238 | 238∣226 |
| Health systems/services | 5∣5 | 5∣16 | 25∣25 | 25∣32 | 36∣36 | 36∣36 | 34∣34 | 34∣42 | 48∣48 | 48∣56 | 58∣58 | 58∣57 | 64∣64 | 64∣61 | 67∣67 | 67∣73 | 82∣82 | 82∣81 | 86∣86 | 86∣94 | 120∣120 | 120∣148 | 147∣147 | 147∣148 |
| Social/Cultural/Environmental/Population Health | 9∣9 | 9∣25 | 38∣38 | 38∣48 | 57∣57 | 57∣60 | 69∣69 | 69∣84 | 85∣85 | 85∣91 | 91∣91 | 91∣91 | 92∣92 | 92∣90 | 90∣90 | 90∣82 | 83∣83 | 83∣91 | 92∣92 | 92∣108 | 160∣160 | 160∣155 | 128∣128 | 128∣126 |
| Not applicable/Specified | 168∣168 | 168∣157 | 148∣148 | 148∣144 | 155∣155 | 155∣161 | 172∣172 | 172∣255 | 199∣199 | 199∣195 | 213∣213 | 213∣215 | 201∣201 | 201∣210 | 197∣197 | 197∣227 | 248∣248 | 248∣252 | 258∣258 | 258∣259 | 269∣269 | 269∣244 | 223∣223 | 223∣228 |
| Total | $370 | $495 | $587 | $647 | $705 | $758 | $800 | $927 | $917 | $929 | $967 | $951 | $941 | $944 | $960 | $973 | $1,024 | $1,035 | $1,088 | $1,135 | $1,440 | $1,315 | $1,258 | $1,258 |
Figure 2: CIHR Investments by Primary Theme 2023-24 (in millions of dollars)

- Due to rounding, figures may not reconcile with other published information
- Excludes operating expenditures and partner contributions
- Primary theme designation is determined by the grantee at the time of application
Figure 2 long description
| Primary Theme | 2023-24 | Percentage Breakdown |
|---|---|---|
| Biomedical | $530 | 42% |
| Clinical | $226 | 18% |
| Health systems/services | $148 | 12% |
| Social/Cultural/Environmental/Population Health | $126 | 10% |
| Not applicable/Specified | $228 | 18% |
| Total | $1,258 | 100% |
Figure 3: CIHR Fiscal Year Investments by Funding Type since 2000-01 (in millions of dollars)

- Due to rounding, figures may not reconcile with other published information
- Excludes operating expenditures and partner contributions
Figure 3 long description
| Funding type | 2000-01 | 2001-02 | 2002-03 | 2003-04 | 2004-05 | 2005-06 | 2006-07 | 2007-08 | 2008-09 | 2009-10 | 2010-11 | 2011-12 | 2012-13 | 2013-14 | 2014-15 | 2015-16 | 2016-17 | 2017-18 | 2018-19 | 2019-20 | 2020-21 | 2021-22 | 2022-23 | 2023-24 |
|---|---|---|---|---|---|---|---|---|---|---|---|---|---|---|---|---|---|---|---|---|---|---|---|---|
| Investigator Initiated | 256∣256 | 256∣334 | 384∣384 | 384∣410 | 447∣447 | 447∣481 | 506∣506 | 506∣545 | 531∣531 | 531∣525 | 551∣551 | 551∣556 | 565∣565 | 565∣570 | 619∣619 | 619∣632 | 662∣662 | 662∣682 | 737∣737 | 737∣771 | 851∣851 | 851∣839 | 810∣810 | 810∣826 |
| Research in Priority Areas | 59∣59 | 59∣97 | 138∣138 | 138∣174 | 194∣194 | 194∣215 | 232∣232 | 232∣321 | 326∣326 | 326∣331 | 316∣316 | 316∣311 | 301∣301 | 301∣302 | 269∣269 | 269∣276 | 300∣300 | 300∣294 | 294∣294 | 294∣304 | 523∣523 | 523∣417 | 382∣382 | 382∣362 |
| Training and Career Support | 55∣55 | 55∣64 | 66∣66 | 66∣63 | 64∣64 | 64∣63 | 61∣61 | 61∣60 | 60∣60 | 60∣73 | 99∣99 | 99∣83 | 75∣75 | 75∣72 | 72∣72 | 72∣64 | 62∣62 | 62∣59 | 57∣57 | 57∣60 | 65∣65 | 65∣59 | 66∣66 | 66∣71 |
| Total | $370 | $495 | $587 | $647 | $705 | $758 | $800 | $927 | $917 | $929 | $967 | $951 | $941 | $944 | $960 | $973 | $1,024 | $1,035 | $1,088 | $1,135 | $1,440 | $1,315 | $1,258 | $1,258 |
Figure 4: CIHR Investments by Region in 2023-24 (in millions of dollars)

- Due to rounding, figures may not reconcile with other published information
- Excludes operating expenditures, partner contributions and direct payments
Figure 4 long description
| Region | CIHR Expenditures 2023-24 | Number of new and ongoing funded applications 2023-24 |
|---|---|---|
| Alberta | $126 | 898 |
| British Columbia | $163 | 1,108 |
| Manitoba | $30 | 223 |
| New Brunswick | $1.9 | 20 |
| Newfoundland & Labrador | $4.9 | 45 |
| North West Territories | $2.1 | 5 |
| Nova Scotia | $27 | 194 |
| Nunavut | $1.5 | 4 |
| Ontario | $573 | 3,607 |
| Prince Edward Island | $0.1 | 3 |
| Quebec | $296 | 2,112 |
| Saskatchewan | $19 | 119 |
| Yukon | $1.3 | 3 |
Figure 5a: Number of New and Ongoing Projects

- Due to rounding as well as changes in methodology, figures may not reconcile with other published information.
- Excludes operating expenditures and partner contributions.
- As of March 2021, an updated method is used to determine international collaborators based on affiliations at the time of grant submission.
Figure 5a long description
| Continent | 2000-01 | 2001-02 | 2002-03 | 2003-04 | 2004-05 | 2005-06 | 2006-07 | 2007-08 | 2008-09 | 2009-10 | 2010-11 | 2011-12 | 2012-13 | 2013-14 | 2014-15 | 2015-16 | 2016-17 | 2017-18 | 2018-19 | 2019-20 | 2020-21 | 2021-22 | 2022-23 | 2023-24 |
|---|---|---|---|---|---|---|---|---|---|---|---|---|---|---|---|---|---|---|---|---|---|---|---|---|
| Africa | 1 | 1 | 5 | 9 | 6 | 8 | 11 | 10 | 13 | 17 | 37 | 47 | 44 | 48 | 44 | 44 | 33 | 29 | 31 | 42 | 46 | 38 | 46 | 40 |
| Europe | 23 | 37 | 45 | 49 | 67 | 87 | 88 | 77 | 112 | 126 | 131 | 179 | 177 | 215 | 228 | 227 | 257 | 257 | 285 | 321 | 356 | 334 | 321 | 321 |
| North America | 80 | 99 | 116 | 129 | 151 | 166 | 180 | 162 | 213 | 196 | 211 | 235 | 243 | 279 | 302 | 298 | 316 | 285 | 289 | 348 | 390 | 354 | 366 | 370 |
| Oceania | 6 | 7 | 14 | 17 | 22 | 29 | 30 | 29 | 38 | 50 | 39 | 56 | 58 | 61 | 68 | 68 | 69 | 78 | 87 | 115 | 122 | 125 | 134 | 114 |
| Asia | 0 | 0 | 5 | 16 | 11 | 5 | 25 | 49 | 82 | 113 | 118 | 124 | 121 | 109 | 96 | 75 | 59 | 46 | 44 | 58 | 64 | 68 | 78 | 66 |
| South America | 0 | 0 | 3 | 9 | 3 | 7 | 6 | 6 | 11 | 8 | 13 | 18 | 18 | 19 | 24 | 21 | 18 | 12 | 12 | 12 | 23 | 18 | 21 | 26 |
Figure 5b: Proportion of CIHR Grants with International linkages since 2000-01

- Due to rounding as well as changes in methodology, figures may not reconcile with other published information.
- Excludes operating expenditures and partner contributions.
- As of March 2021, an updated method is used to determine international collaborators based on affiliations at the time of grant submission.
Figure 5b long description
| Proportion | 2000-01 | 2001-02 | 2002-03 | 2003-04 | 2004-05 | 2005-06 | 2006-07 | 2007-08 | 2008-09 | 2009-10 | 2010-11 | 2011-12 | 2012-13 | 2013-14 | 2014-15 | 2015-16 | 2016-17 | 2017-18 | 2018-19 | 2019-20 | 2020-21 | 2021-22 | 2022-23 | 2023-24 |
|---|---|---|---|---|---|---|---|---|---|---|---|---|---|---|---|---|---|---|---|---|---|---|---|---|
| Percentage of total CIHR investments | 4.2% | 5.4% | 6% | 6.7% | 6.4% | 6.5% | 6.9% | 6.8% | 8.3% | 10.7% | 10.3% | 11.7% | 12.6% | 13.6% | 14% | 14.3% | 15.3% | 15.2% | 14.9% | 15.2% | 17.3% | 15.9% | 17.6% | 16.2% |
| Percentage of total # of CIHR grants | 2.9% | 3% | 3.6% | 3.8% | 4.4% | 4.7% | 5.3% | 5.1% | 6.3% | 6.9% | 7.4% | 8.9% | 9.2% | 11.1% | 11.6% | 12% | 12.8% | 12.5% | 12.6% | 13.6% | 14.1% | 13.4% | 14.5% | 14.2% |
Figure 6: Countries with an International Linkage to a CIHR grants since 2000-01

- Due to changes in methodology, figures may not reconcile with other published information
Figure 6 long description
| Countries |
|---|
| Afghanistan Argentina Australia Austria Bangladesh Barbados Belgium Benin Brazil Burkina Faso Cambodia Cameroon Central African Republic Chile China Colombia Costa Rica Côte d'Ivoire Croatia Cuba Cyprus Czech Republic Democratic Republic of the Congo Denmark Ecuador Egypt Ethiopia Finland France Gabon Germany Ghana Greece Guatemala Guinea Haiti Hong Kong Hungary Iceland India Indonesia Iran Ireland Israel Italy Jamaica Japan Kenya Kuwait Lao People's Democratic Republic Latvia Lebanon Lithuania Luxembourg Madagascar Malawi Malaysia Mali Mauritius Mexico Mongolia Nepal Netherlands New Zealand Niger Nigeria Norway Pakistan Peru Philippines Poland Portugal Puerto Rico Romania Russia Rwanda Saudi Arabia Senegal Singapore Slovakia South Africa South Korea Spain Sri Lanka Sudan Sweden Switzerland Taiwan Tanzania Thailand Turkey Uganda Ukraine United Arab Emirates United Kingdom United States of America Uruguay Vietnam Yugoslavia Zambia Zimbabwe |
Figure 7: Leveraged Partner Funding by Sector (in millions of dollars) – Cumulative totals from 2000-01 to 2023-24

- Due to rounding, figures may not reconcile with other published information
- Includes partner contributions administered by CIHR, in kind and direct contributions from partner directly to the researcher
- Includes both competition and applicant partner contributions where there may or may not be a formal agreement with CIHR
Figure 7 long description
| Sector | Total | Percentage |
|---|---|---|
| Academia | $156 | 4.7% |
| Federal partners | $1,570 | 46.2% |
| International | $405 | 11.9% |
| Municipal/Provincial funder | $233 | 6.9% |
| Not-for-profit | $495 | 14.6% |
| Profit | $231 | 6.8% |
| Unspecified | $305 | 9.0% |
| Total | $3,397 | 100% |
Figure 8: Leveraged Partner Funding by Sector (in millions of dollars) – 2023-24

- Due to rounding, figures may not reconcile with other published information
- Includes partner contributions administered by CIHR, in kind and direct contributions from partner directly to the researcher
- Includes both competition and applicant partner contributions where there may or may not be a formal agreement with CIHR
Figure 8 long description
| Sector | Total | Percentage |
|---|---|---|
| Academia | $2.5 | 3.7% |
| Federal partner | $24 | 35.5% |
| International | $17 | 25.1% |
| Municipal/Provincial funder | $1.6 | 2.3% |
| Not-for-profit | $16.3 | 24.1% |
| Profit | $0.2 | 0.4% |
| Unspecified | $6.1 | 9.0% |
| Total | $67.7 | 100% |
2022-2023
Figure 1: CIHR Fiscal Year Investments by Primary Theme since 1999-00 (in millions of dollars)
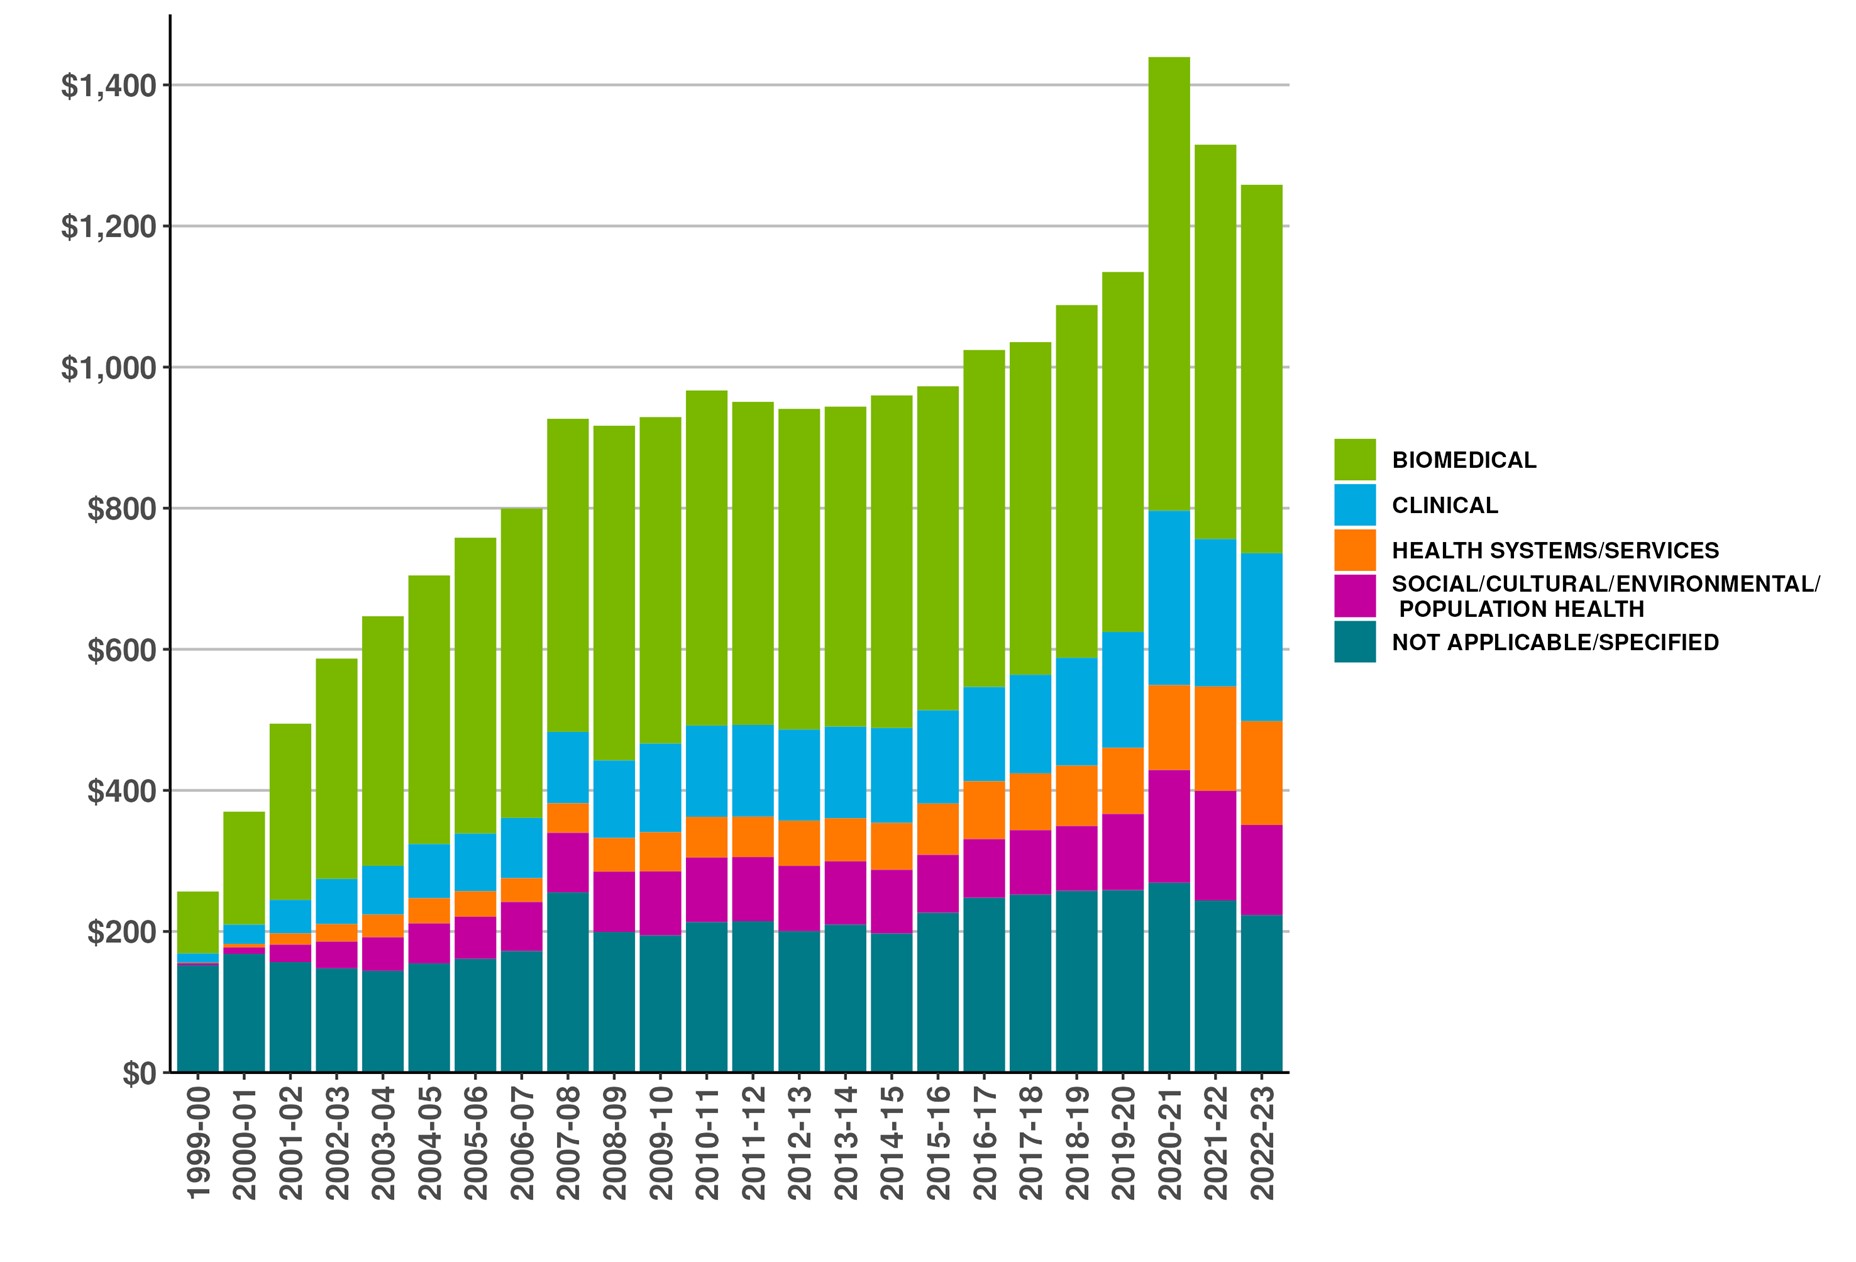
- Due to rounding, figures may not reconcile with other published information
- Excludes operating expenditures and partner contributions
- Primary theme designation is determined by the grantee at the time of application
Figure 1 long description
| Primary theme | 1999-00 | 2000-01 | 2001-02 | 2002-03 | 2003-04 | 2004-05 | 2005-06 | 2006-07 | 2007-08 | 2008-09 | 2009-10 | 2010-11 | 2011-12 | 2012-13 | 2013-14 | 2014-15 | 2015-16 | 2016-17 | 2017-18 | 2018-19 | 2019-20 | 2020-21 | 2021-22 | 2022-23 |
|---|---|---|---|---|---|---|---|---|---|---|---|---|---|---|---|---|---|---|---|---|---|---|---|---|
| Biomedical | 88∣88 | 88∣160 | 250∣250 | 250∣312 | 354∣354 | 354∣381 | 419∣419 | 419∣439 | 444∣444 | 444∣474 | 463∣463 | 463∣475 | 458∣458 | 458∣455 | 454∣454 | 454∣471 | 459∣459 | 459∣478 | 472∣472 | 472∣500 | 510∣510 | 510∣643 | 559∣559 | 559∣522 |
| Clinical | 13∣13 | 13∣27 | 47∣47 | 47∣64 | 69∣69 | 69∣77 | 82∣82 | 82∣85 | 101∣101 | 101∣110 | 126∣126 | 126∣129 | 130∣130 | 130∣129 | 130∣130 | 130∣134 | 132∣132 | 132∣133 | 140∣140 | 140∣153 | 164∣164 | 164∣247 | 209∣209 | 209∣238 |
| Health systems/services | 0.7∣0.7 | 0.7∣5 | 16∣16 | 16∣25 | 32∣32 | 32∣36 | 36∣36 | 36∣34 | 42∣42 | 42∣48 | 55∣55 | 55∣58 | 57∣57 | 57∣64 | 61∣61 | 61∣66 | 73∣73 | 73∣82 | 80∣80 | 80∣86 | 94∣94 | 94∣120 | 148∣148 | 148∣147 |
| Social/Cultural/Environmental/Population Health | 3∣3 | 3∣9 | 25∣25 | 25∣38 | 47∣47 | 47∣56 | 60∣60 | 60∣69 | 84∣84 | 84∣85 | 90∣90 | 90∣91 | 91∣91 | 91∣92 | 90∣90 | 90∣90 | 82∣82 | 82∣83 | 91∣91 | 91∣92 | 108∣108 | 108∣160 | 155∣155 | 155∣128 |
| Not applicable/Specified | 152∣152 | 152∣168 | 157∣157 | 157∣148 | 144∣144 | 144∣155 | 161∣161 | 161∣172 | 255∣255 | 255∣199 | 195∣195 | 195∣213 | 215∣215 | 215∣201 | 210∣210 | 210∣197 | 227∣227 | 227∣248 | 252∣252 | 252∣258 | 259∣259 | 259∣269 | 244∣244 | 244∣223 |
| Total | $257 | $370 | $494 | $587 | $647 | $705 | $758 | $800 | $927 | $917 | $929 | $967 | $951 | $941 | $944 | $960 | $973 | $1,024 | $1,035 | $1,088 | $1,135 | $1,439 | $1,315 | $1,258 |
Figure 2: CIHR Investments by Primary Theme 2022-23 (in millions of dollars)
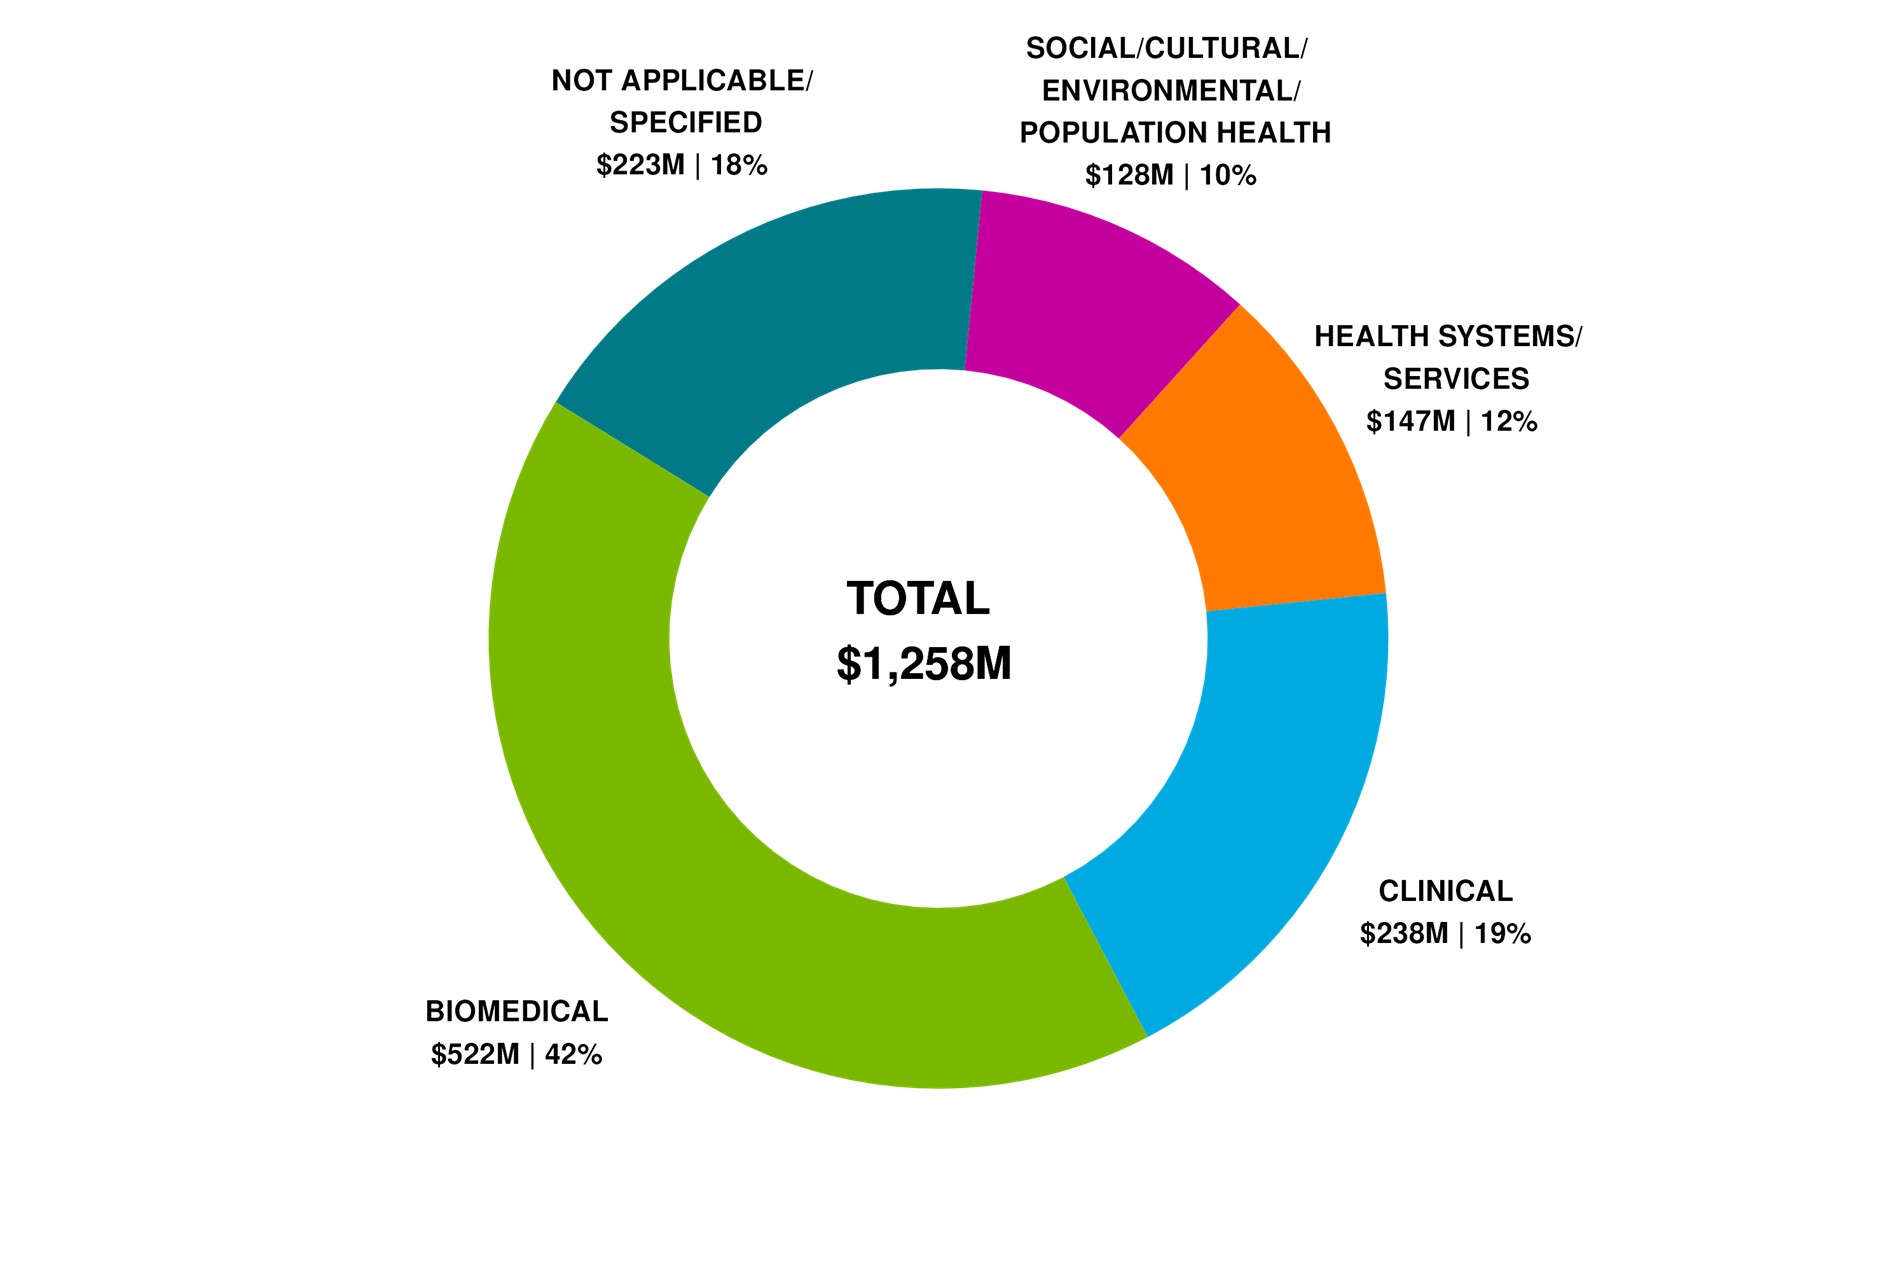
- Due to rounding, figures may not reconcile with other published information
- Excludes operating expenditures and partner contributions
- Primary theme designation is determined by the grantee at the time of application
Figure 2 long description
| Primary Theme | 2022-23 | Percentage Breakdown |
|---|---|---|
| Biomedical | $522 | 42% |
| Clinical | $238 | 19% |
| Health systems/services | $147 | 12% |
| Social/Cultural/Environmental/Population Health | $128 | 10% |
| Not applicable/Specified | $223 | 18% |
| Total | $1,258 | 100% |
Figure 2: CIHR Investments by Primary Theme and COVID-19 funding 2022-23 (in millions of dollars)
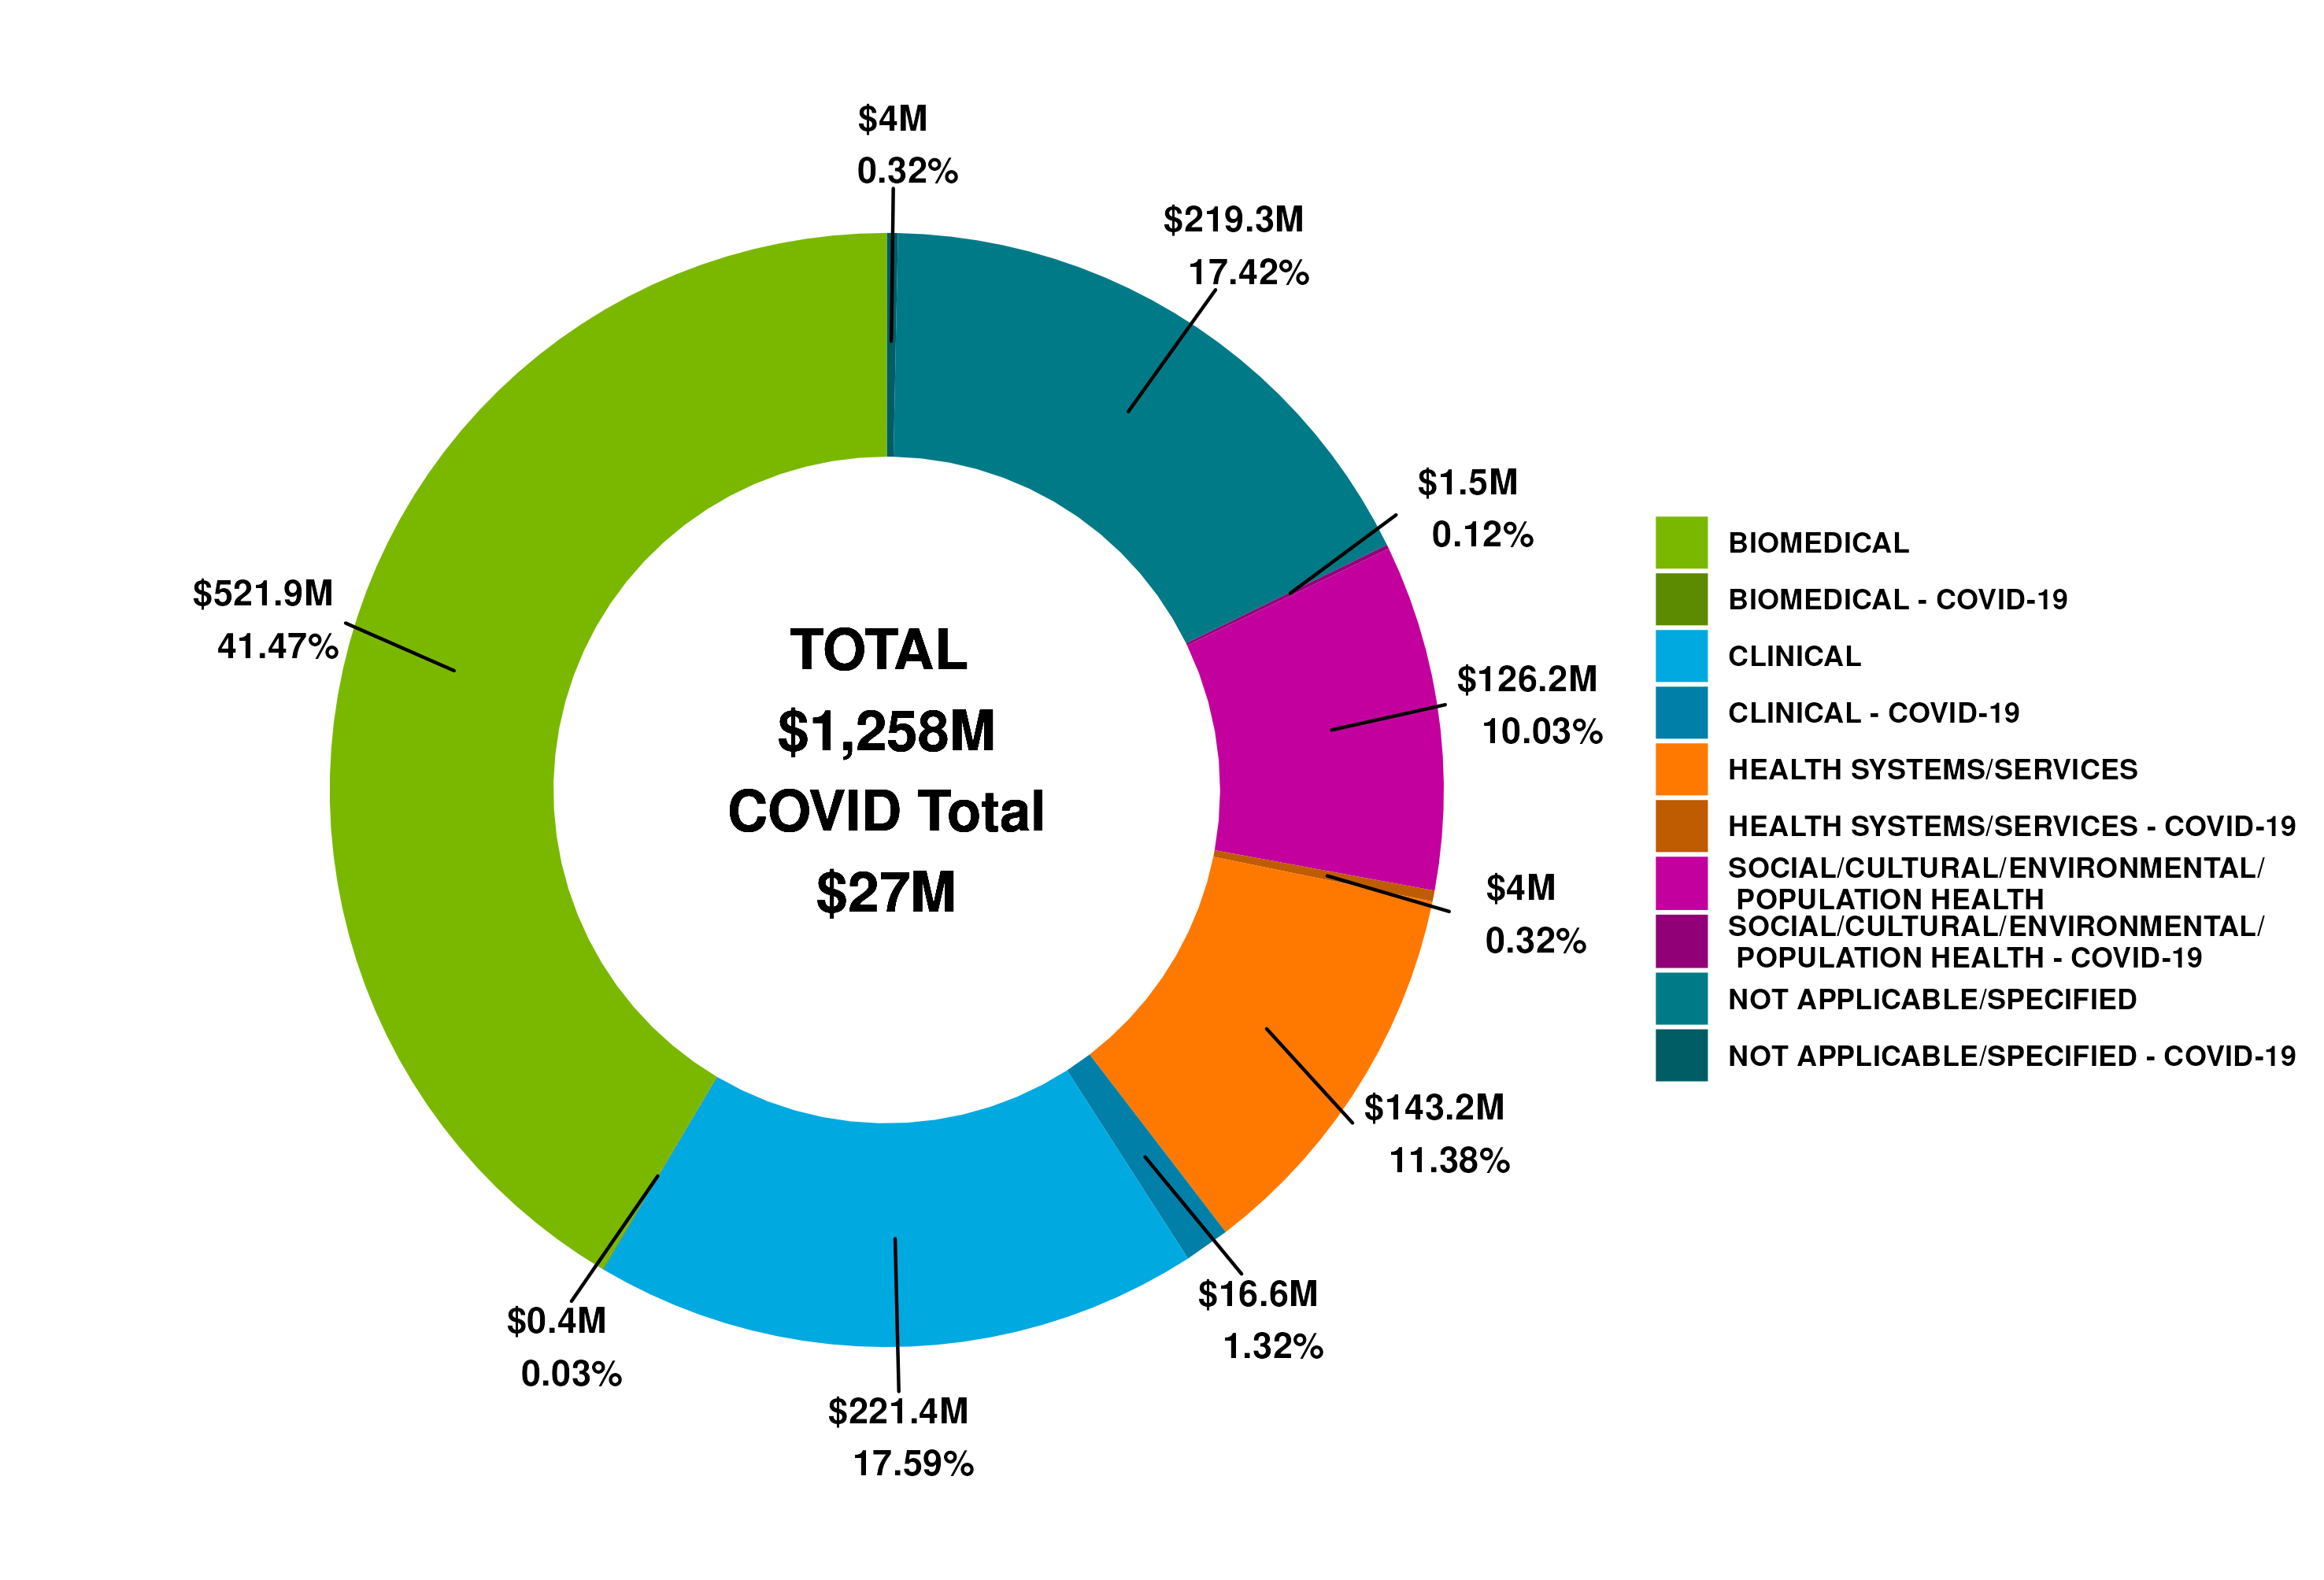
- Due to rounding, figures may not reconcile with other published information
- Excludes operating expenditures and partner contributions
- Primary theme designation is determined by the grantee at the time of application
- COVID-19 funding is determined by granting to a COVID-19-specific funding competition
Figure 2 long description
| Primary Theme | 2022-23 | Percentage Breakdown | |
|---|---|---|---|
| Biomedical | non COVID-19 | $521.9 | 41.47% |
| COVID-19 | $0.4 | 0.03% | |
| Clinical | non COVID-19 | $221.4 | 17.59% |
| COVID-19 | $16.6 | 1.32% | |
| Health systems/services | non COVID-19 | $143.2 | 11.38% |
| COVID-19 | $4.0 | 0.32% | |
| Social/Cultural/Environmental/Population Health | non COVID-19 | $219.3 | 17.42% |
| COVID-19 | $4.0 | 0.32% | |
| Not applicable/Specified | non COVID-19 | $126.2 | 10.03% |
| COVID-19 | $1.5 | 0.12% | |
| Total | $1,258 | 100% |
Figure 3: CIHR Fiscal Year Investments by Funding Type since 1999-00 (in millions of dollars)
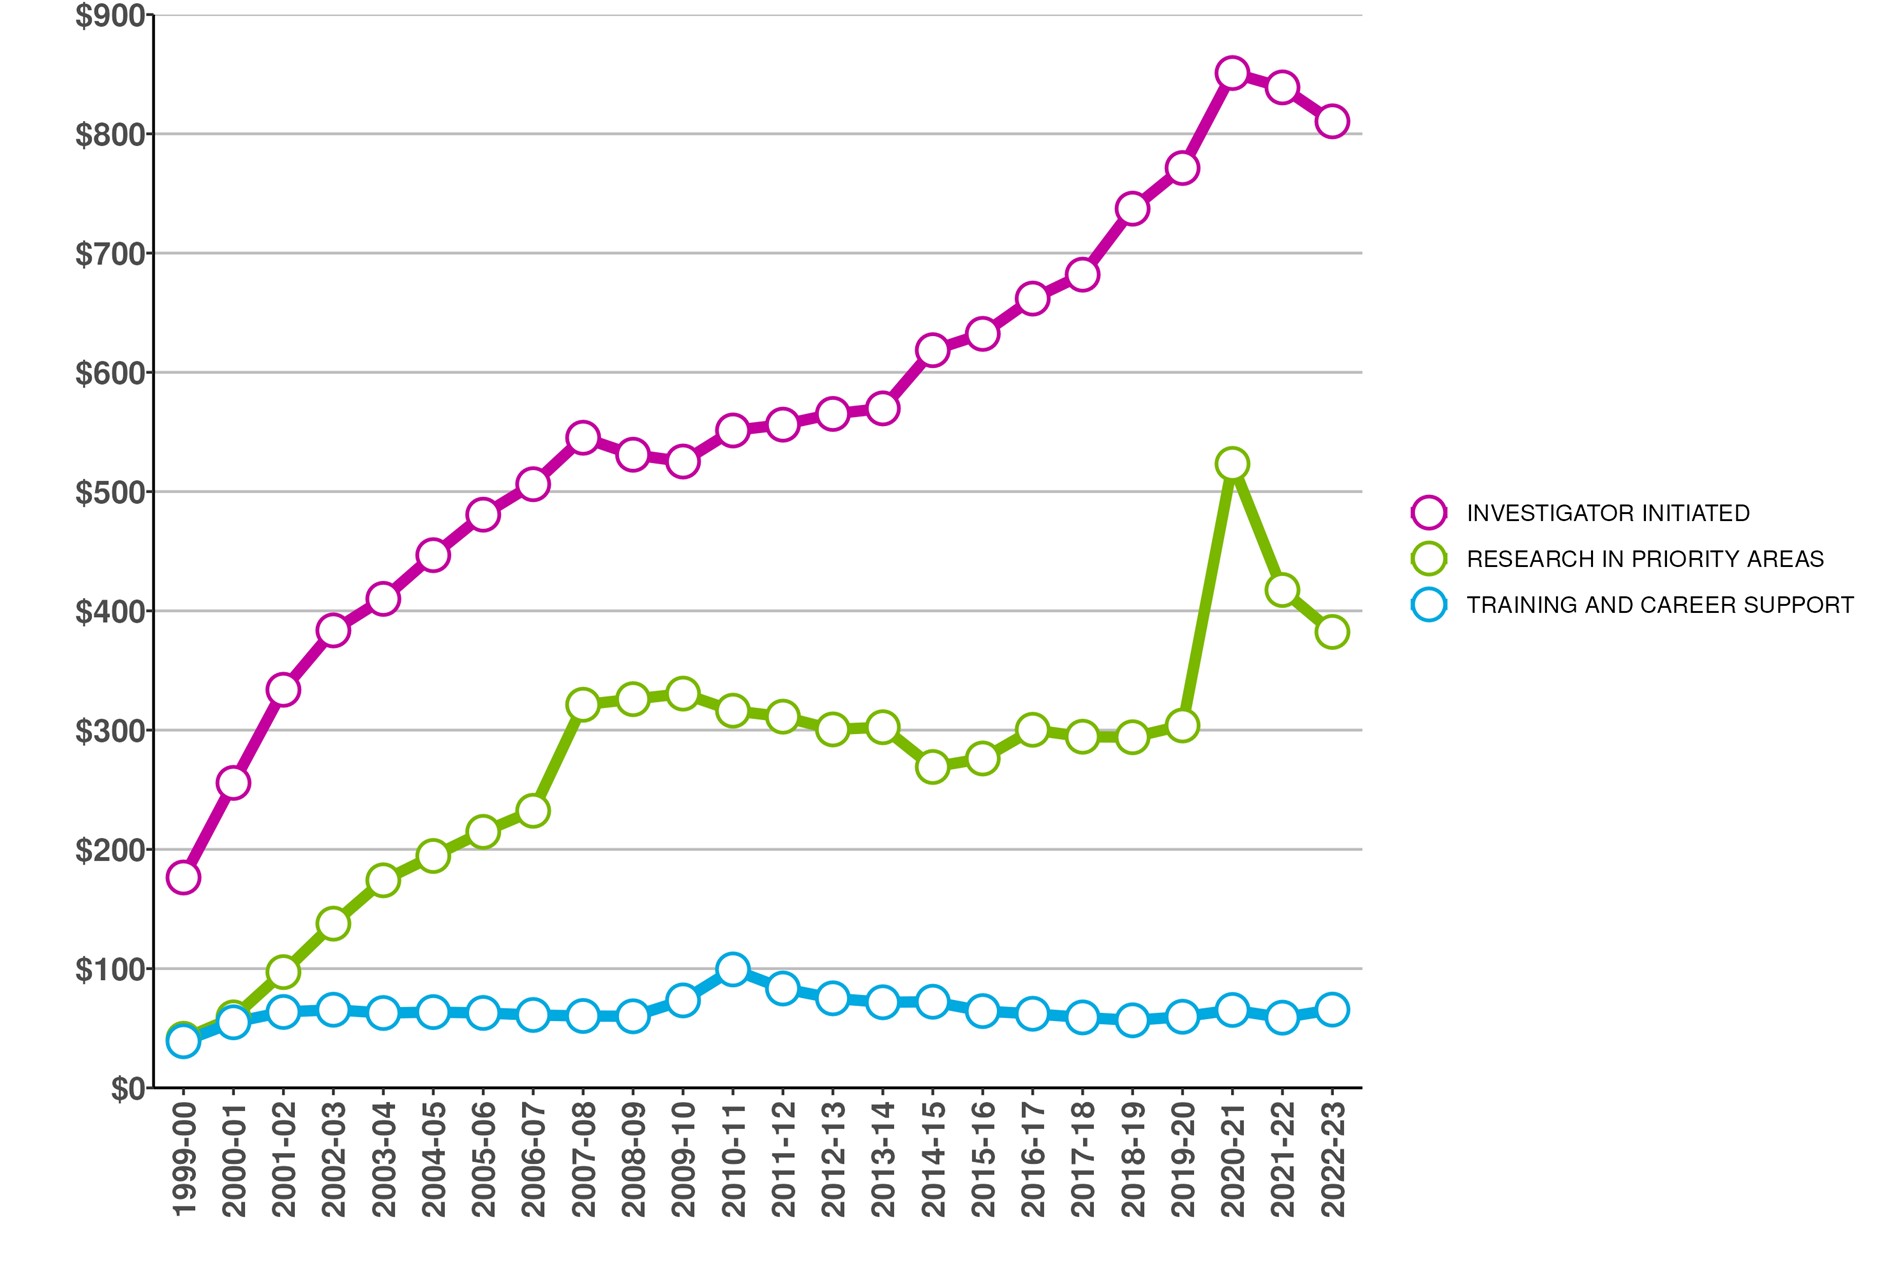
- Due to rounding, figures may not reconcile with other published information
- Excludes operating expenditures and partner contributions
Figure 3 long description
| Funding type | 1999-00 | 2000-01 | 2001-02 | 2002-03 | 2003-04 | 2004-05 | 2005-06 | 2006-07 | 2007-08 | 2008-09 | 2009-10 | 2010-11 | 2011-12 | 2012-13 | 2013-14 | 2014-15 | 2015-16 | 2016-17 | 2017-18 | 2018-19 | 2019-20 | 2020-21 | 2021-22 | 2022-23 |
|---|---|---|---|---|---|---|---|---|---|---|---|---|---|---|---|---|---|---|---|---|---|---|---|---|
| Investigator Initiated | 176∣176 | 176∣256 | 334∣334 | 334∣384 | 410∣410 | 410∣447 | 481∣481 | 481∣506 | 545∣545 | 545∣531 | 525∣525 | 525∣551 | 556∣556 | 556∣565 | 570∣570 | 570∣619 | 632∣632 | 632∣662 | 682∣682 | 682∣737 | 771∣771 | 771∣851 | 839∣839 | 839∣810 |
| Research in Priority Areas | 41∣41 | 41∣59 | 97∣97 | 97∣138 | 174∣174 | 174∣194 | 215∣215 | 215∣232 | 321∣321 | 321∣326 | 331∣331 | 331∣316 | 311∣311 | 311∣301 | 302∣302 | 302∣269 | 276∣276 | 276∣300 | 294∣294 | 294∣294 | 304∣304 | 304∣523 | 417∣417 | 417∣382 |
| Training and Career Support | 39∣39 | 39∣55 | 64∣64 | 64∣65 | 63∣63 | 63∣63 | 63∣63 | 63∣61 | 60∣60 | 60∣60 | 73∣73 | 73∣99 | 83∣83 | 83∣75 | 72∣72 | 72∣72 | 64∣64 | 64∣62 | 59∣59 | 59∣57 | 60∣60 | 60∣65 | 59∣59 | 59∣66 |
| Total | $257 | $370 | $494 | $587 | $647 | $705 | $758 | $800 | $927 | $917 | $929 | $967 | $951 | $941 | $944 | $960 | $973 | $1,024 | $1,035 | $1,088 | $1,135 | $1,439 | $1,315 | $1,258 |
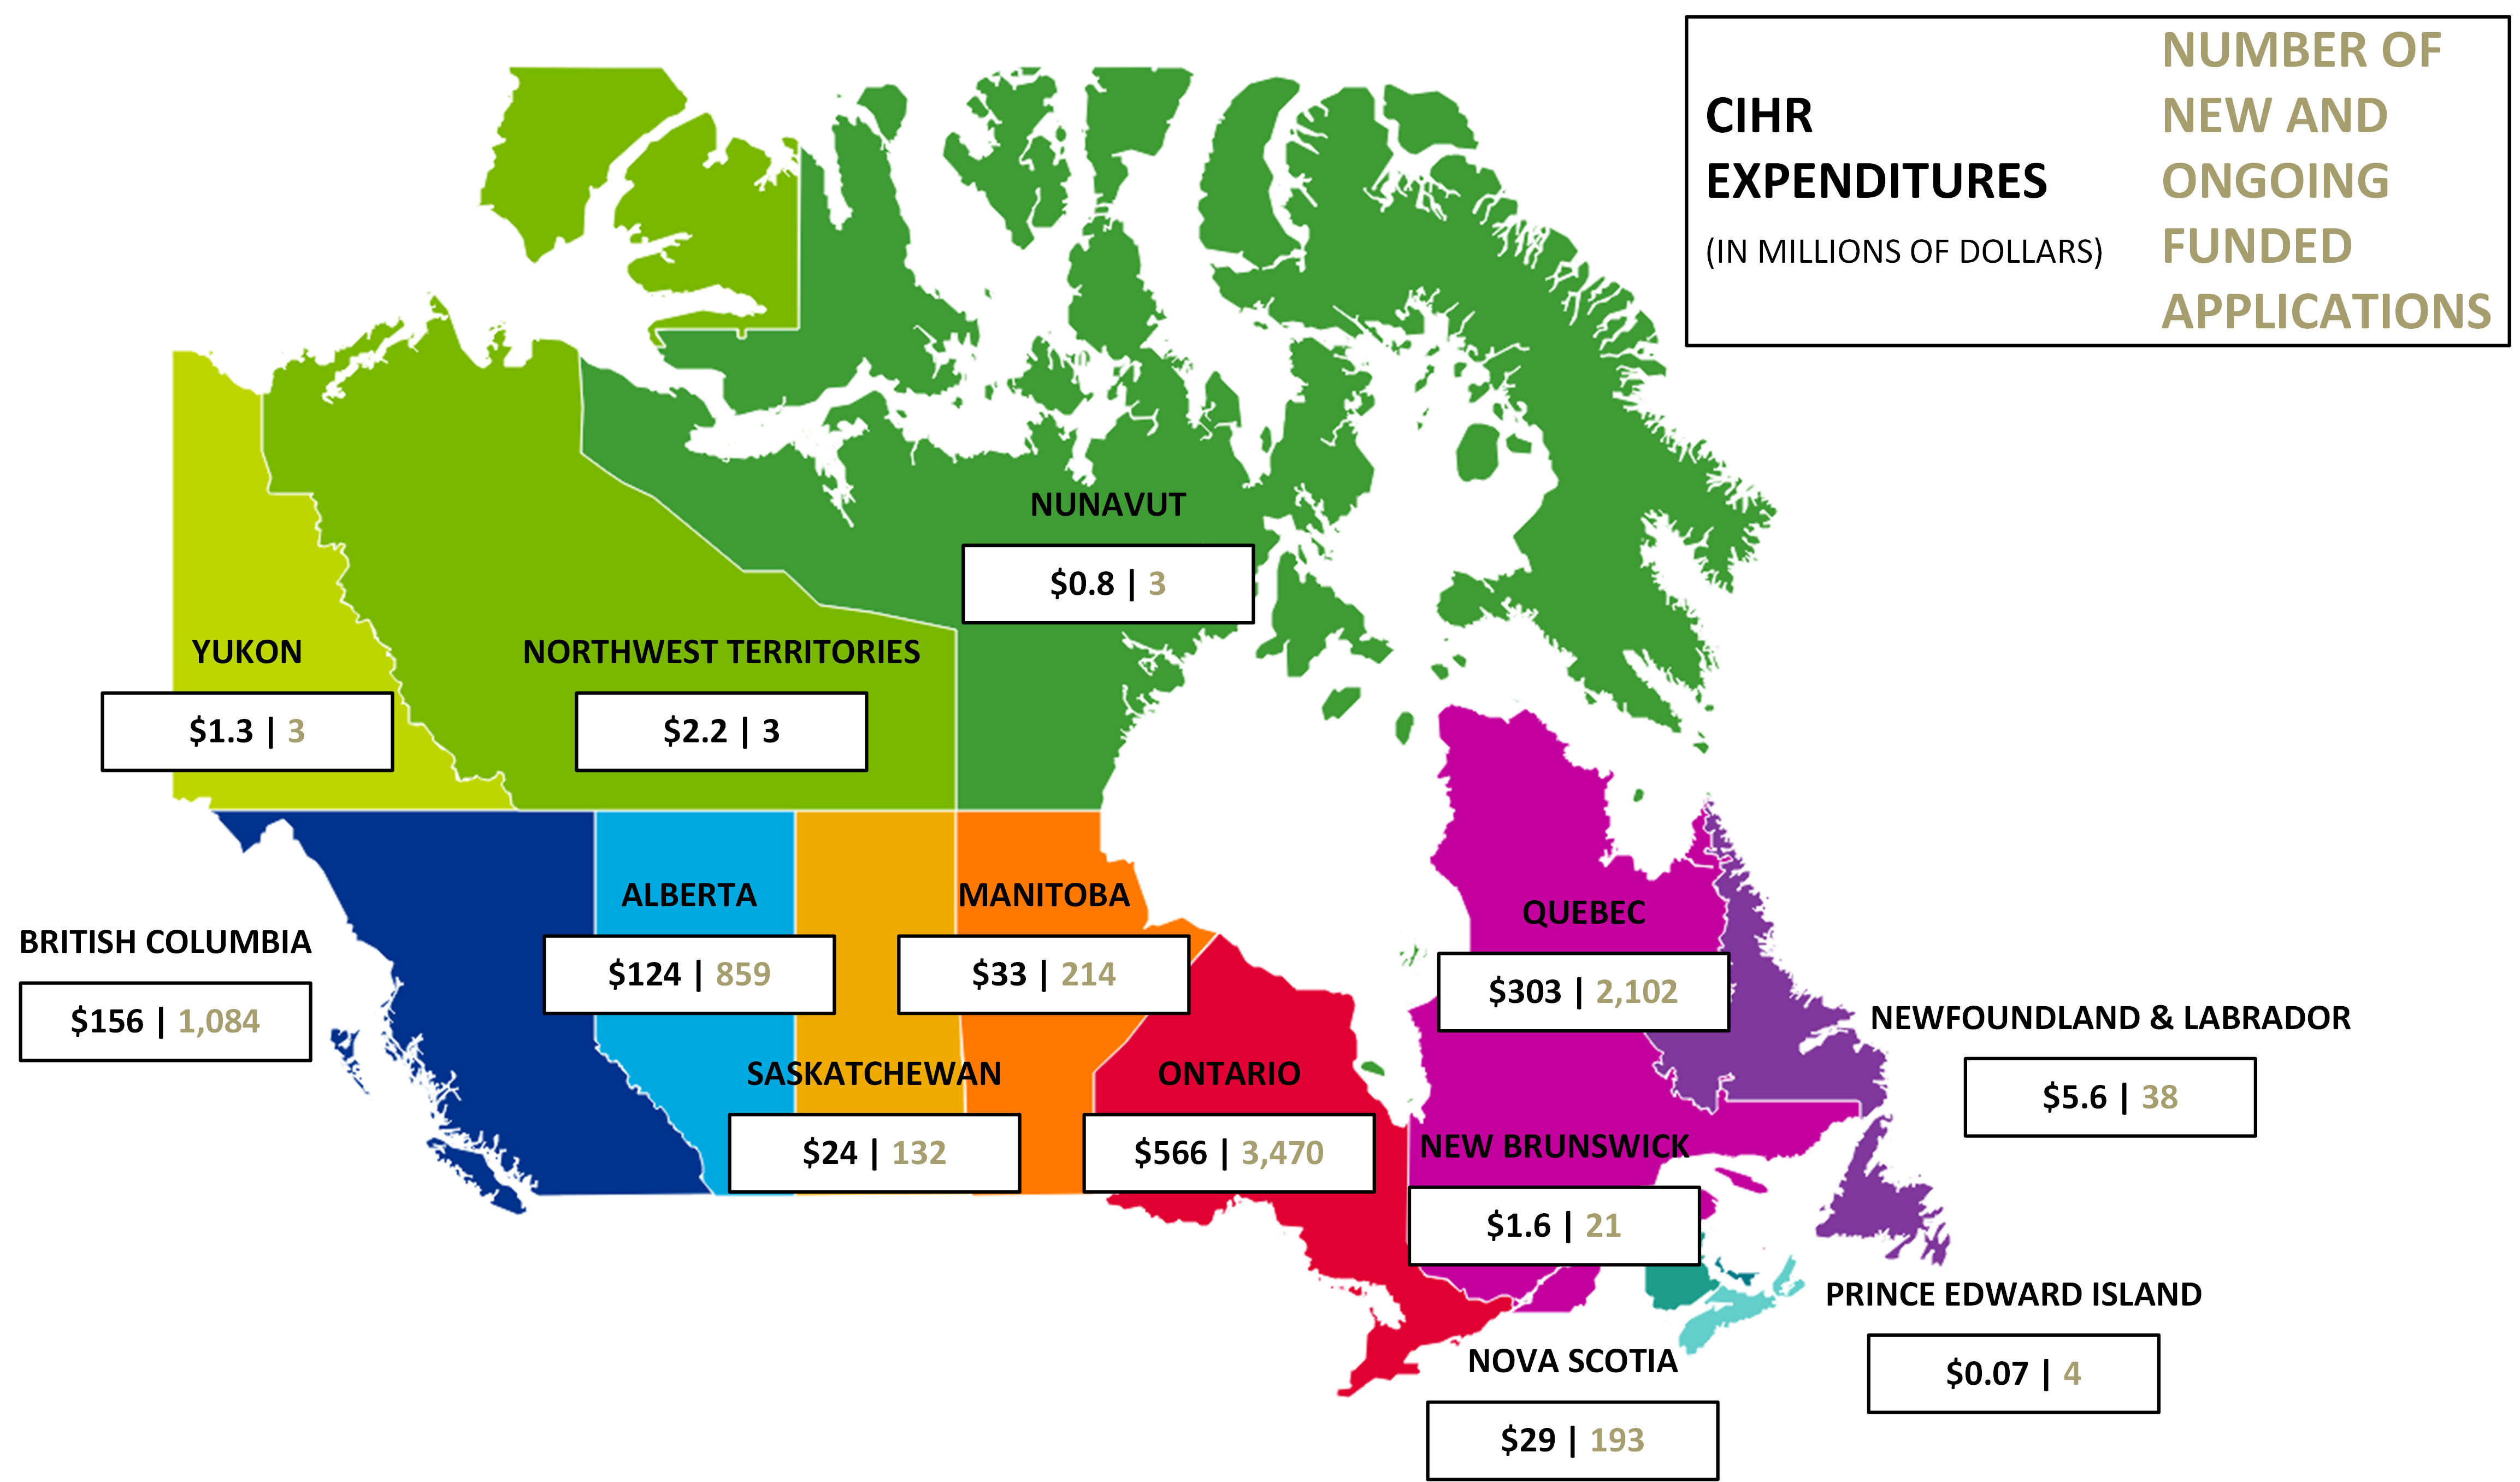
Figure 4: CIHR Investments by Region in 2022-23 (in millions of dollars)
- Due to rounding, figures may not reconcile with other published information
- Excludes operating expenditures, partner contributions and direct payments
Figure 4 long description
| Region | CIHR Expenditures 2022-23 | Number of new and ongoing funded applications 2022-23 |
|---|---|---|
| Alberta | $124 | 859 |
| British Columbia | $156 | 1,084 |
| Manitoba | $33 | 214 |
| New Brunswick | $1.6 | 21 |
| Newfoundland & Labrador | $5.6 | 38 |
| North West Territories | $2.2 | 3 |
| Nova Scotia | $29 | 193 |
| Nunavut | $0.8 | 3 |
| Ontario | $566 | 3,470 |
| Prince Edward Island | $0.07 | 4 |
| Quebec | $303 | 2,102 |
| Saskatchewan | $24 | 132 |
| Yukon | $1.3 | 3 |
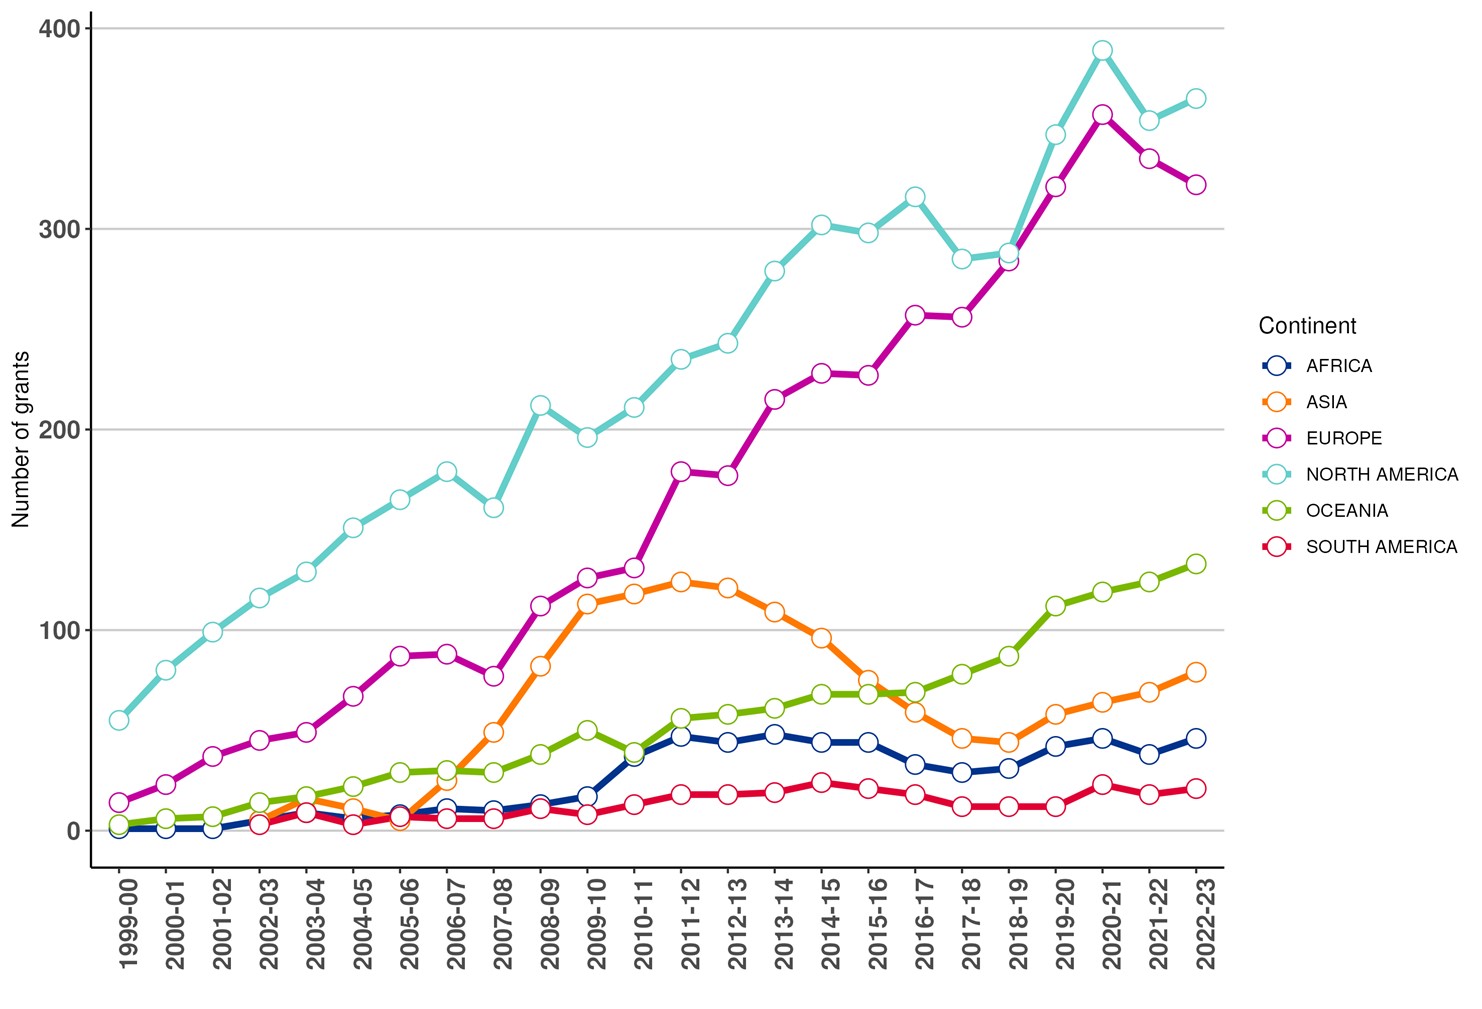
Figure 5a: Number of New and Ongoing Projects
- Due to rounding as well as changes in methodology, figures may not reconcile with other published information.
- Excludes operating expenditures and partner contributions.
- As of March 2021, an updated method is used to determine international collaborators based on affiliations at the time of grant submission.
Figure 5a long description
| Continent | 1999-00 | 2000-01 | 2001-02 | 2002-03 | 2003-04 | 2004-05 | 2005-06 | 2006-07 | 2007-08 | 2008-09 | 2009-10 | 2010-11 | 2011-12 | 2012-13 | 2013-14 | 2014-15 | 2015-16 | 2016-17 | 2017-18 | 2018-19 | 2019-20 | 2020-21 | 2021-22 | 2022-23 |
|---|---|---|---|---|---|---|---|---|---|---|---|---|---|---|---|---|---|---|---|---|---|---|---|---|
| Africa | 1 | 1 | 1 | 5 | 9 | 6 | 8 | 11 | 10 | 13 | 17 | 37 | 47 | 44 | 48 | 44 | 44 | 33 | 29 | 31 | 42 | 46 | 38 | 46 |
| Europe | 14 | 23 | 37 | 45 | 49 | 67 | 87 | 88 | 77 | 112 | 126 | 131 | 179 | 177 | 215 | 228 | 227 | 257 | 256 | 284 | 321 | 357 | 334 | 322 |
| North America | 55 | 80 | 99 | 116 | 129 | 151 | 165 | 179 | 161 | 212 | 196 | 211 | 235 | 243 | 279 | 302 | 298 | 316 | 284 | 287 | 344 | 387 | 350 | 365 |
| Oceania | 3 | 6 | 7 | 14 | 17 | 22 | 29 | 30 | 29 | 38 | 50 | 39 | 56 | 58 | 61 | 68 | 68 | 69 | 78 | 87 | 112 | 119 | 124 | 133 |
| Asia | 0 | 0 | 0 | 5 | 16 | 11 | 5 | 25 | 49 | 82 | 113 | 118 | 124 | 121 | 109 | 96 | 75 | 59 | 46 | 44 | 58 | 64 | 69 | 79 |
| South America | 0 | 0 | 0 | 3 | 9 | 3 | 7 | 6 | 6 | 11 | 8 | 13 | 18 | 18 | 19 | 24 | 21 | 18 | 12 | 12 | 12 | 23 | 16 | 21 |
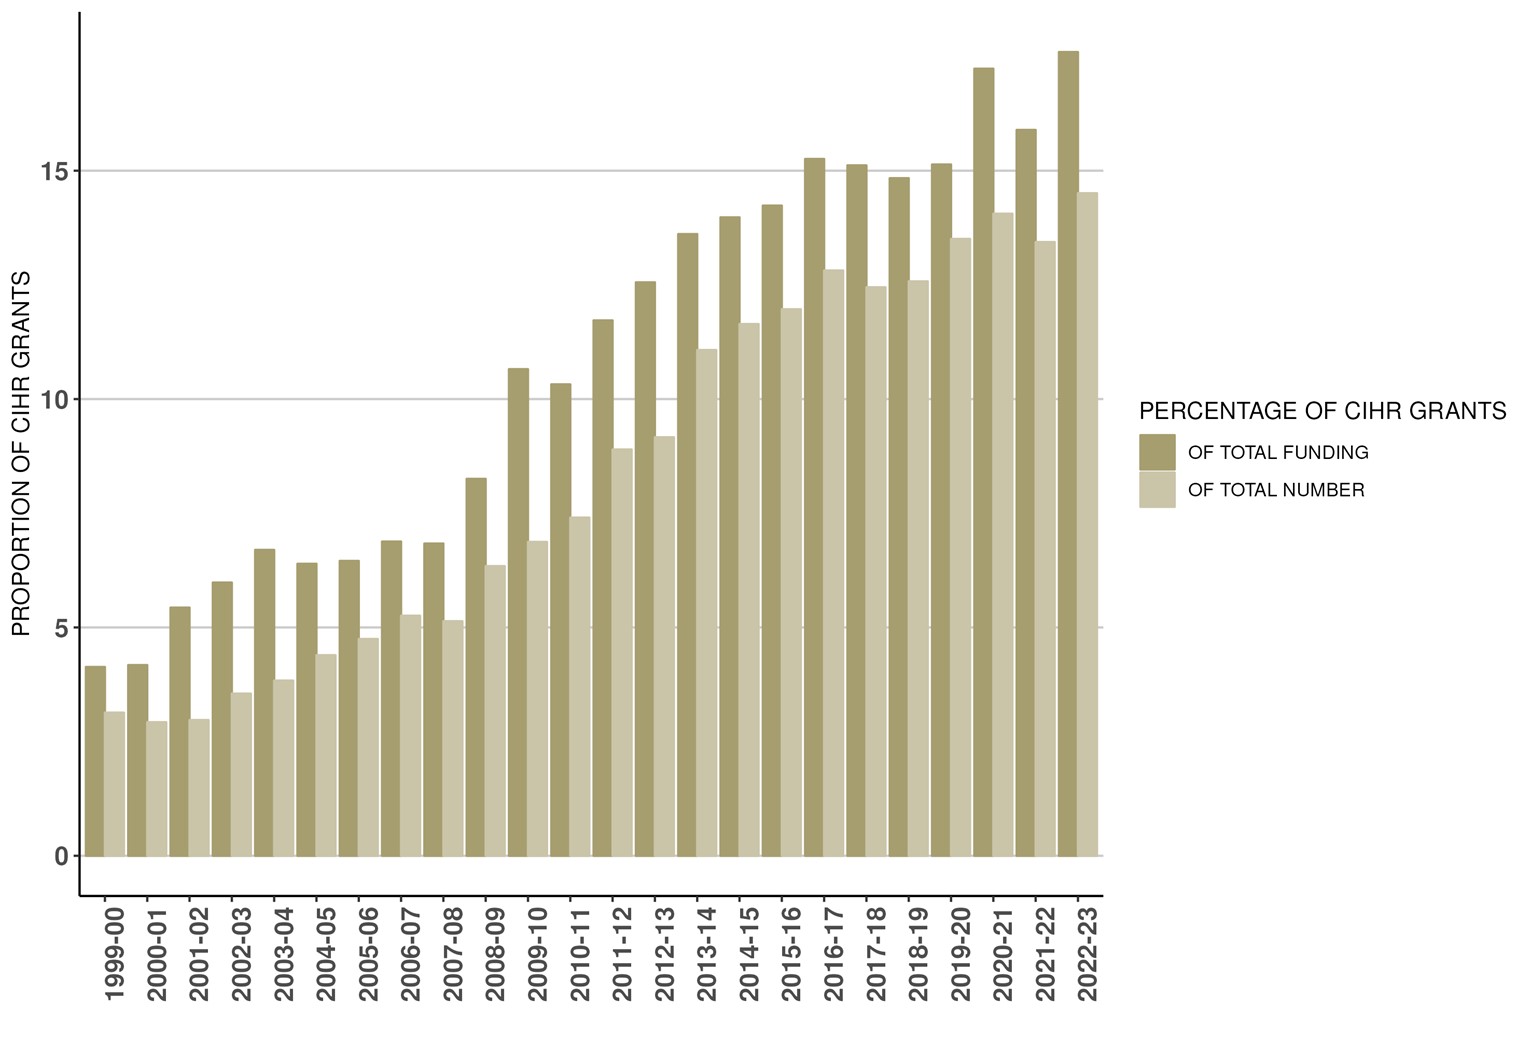
Figure 5b: Proportion of CIHR Grants with International linkages since 1999-00
- Due to rounding as well as changes in methodology, figures may not reconcile with other published information.
- Excludes operating expenditures and partner contributions.
- As of March 2021, an updated method is used to determine international collaborators based on affiliations at the time of grant submission.
Figure 5b long description
| Proportion | 1999-00 | 2000-01 | 2001-02 | 2002-03 | 2003-04 | 2004-05 | 2005-06 | 2006-07 | 2007-08 | 2008-09 | 2009-10 | 2010-11 | 2011-12 | 2012-13 | 2013-14 | 2014-15 | 2015-16 | 2016-17 | 2017-18 | 2018-19 | 2019-20 | 2020-21 | 2021-22 | 2022-23 |
|---|---|---|---|---|---|---|---|---|---|---|---|---|---|---|---|---|---|---|---|---|---|---|---|---|
| Percentage of total CIHR investments | 4.1% | 4.2% | 5.4% | 6% | 6.7% | 6.4% | 6.5% | 6.9% | 6.8% | 8.3% | 10.7% | 10.3% | 11.7% | 12.6% | 13.6% | 14% | 14.2% | 15.2% | 15.1% | 14.7% | 15% | 17.1% | 15.7% | 17.6% |
| Percentage of total # of CIHR grants | 3.1% | 2.9% | 3% | 3.6% | 3.8% | 4.4% | 4.7% | 5.3% | 5.1% | 6.3% | 6.9% | 7.4% | 8.9% | 9.2% | 11.1% | 11.6% | 12% | 12.8% | 12.4% | 12.6% | 13.5% | 14% | 13.4% | 14.5% |
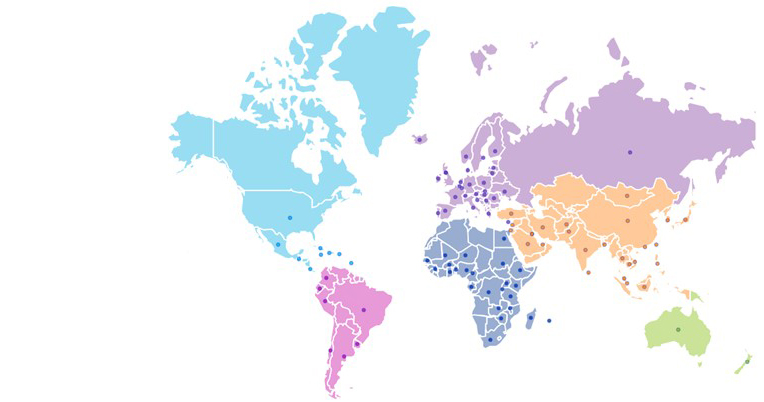
Figure 6: Countries with an International Linkage to a CIHR grants since 1999-00
- Due to changes in methodology, figures may not reconcile with other published information
Figure 6 long description
| Countries |
|---|
| Afghanistan Argentina Australia Austria Bangladesh Barbados Belgium Benin Brazil Burkina Faso Cambodia Cameroon Central African Republic Chile China Colombia Costa Rica Côte d'Ivoire Croatia Cuba Cyprus Czech Republic Democratic Republic of the Congo Denmark Ecuador Egypt England Ethiopia Finland France Gabon Germany Ghana Greece Guatemala Guinea Haiti Hong Kong Hungary Iceland India Indonesia Iran Ireland Israel Italy Jamaica Japan Kenya Kuwait Lao People's Democratic Republic Latvia Lebanon Lithuania Luxembourg Madagascar Malaysia Mali Mauritius Mexico Mongolia Nepal Netherlands New Zealand Niger Nigeria Norway Pakistan Peru Philippines Poland Portugal Puerto Rico Romania Russia Rwanda Saudi Arabia Scotland Senegal Singapore Slovakia South Africa South Korea Spain Sri Lanka Sudan Sweden Switzerland Taiwan Tanzania Thailand Turkey Uganda Ukraine United Arab Emirates United Kingdom United States Uruguay Vietnam Yugoslavia Zambia Zimbabwe |
Figure 7: Leveraged Partner Funding by Sector (in millions of dollars) – Cumulative totals from 1999-00 to 2022-23
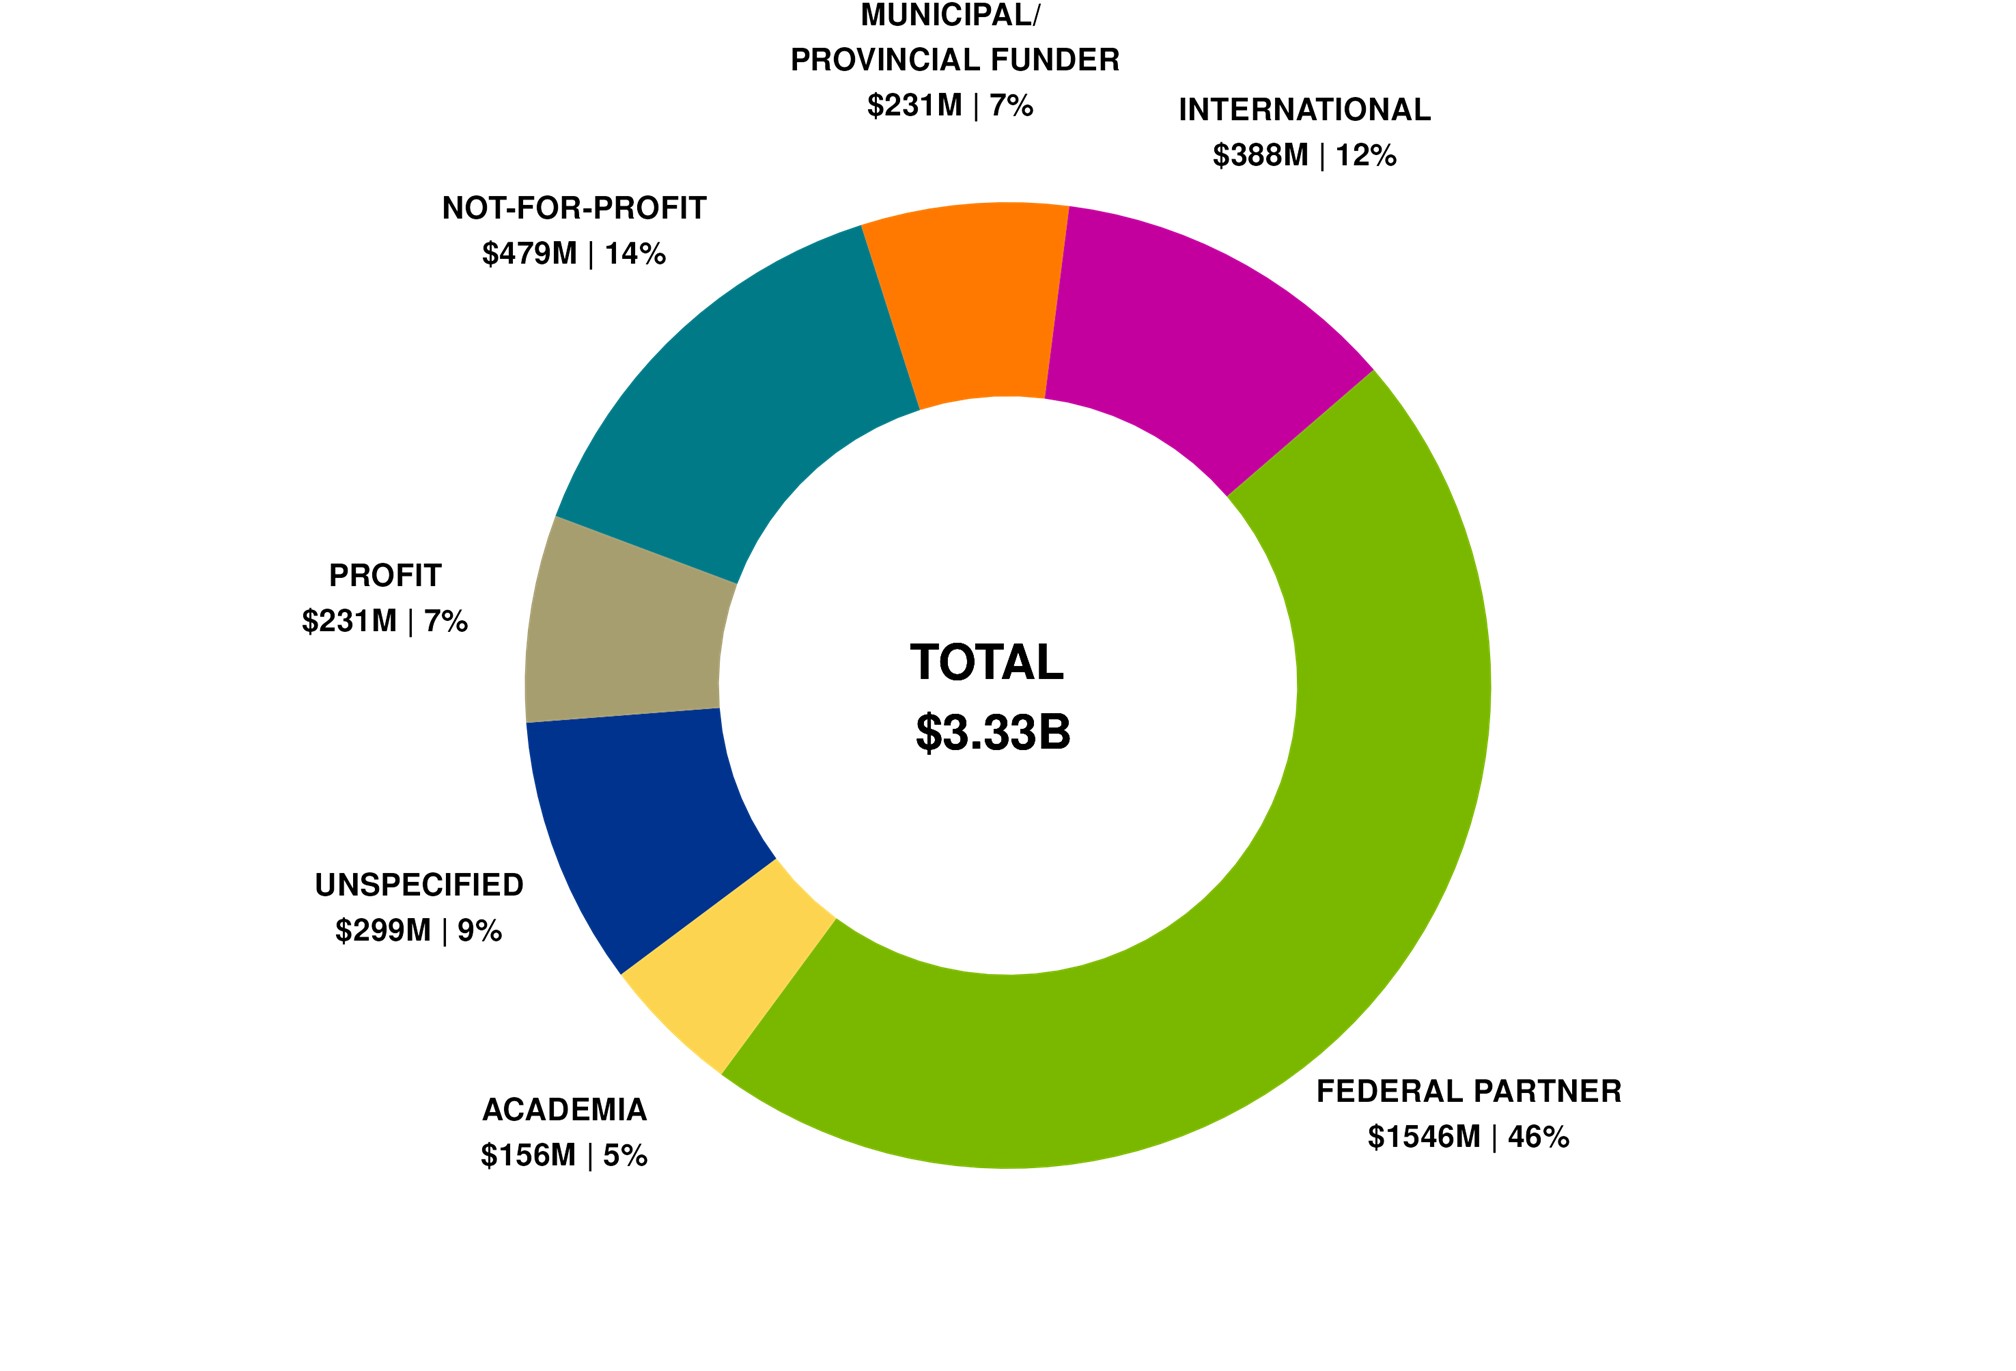
- Due to rounding, figures may not reconcile with other published information
- Includes partner contributions administered by CIHR, in kind and direct contributions from partner directly to the researcher
- Includes both competition and applicant partner contributions where there may or may not be a formal agreement with CIHR
Figure 7 long description
| Sector | Total | Percentage |
|---|---|---|
| Academia | $156 | 4.7% |
| Federal partners | $1,546 | 46.4% |
| International | $388 | 11.6% |
| Municipal/Provincial funder | $231 | 6.9% |
| Not-for-profit | $479 | 14.4% |
| Profit | $231 | 6.9% |
| Unspecified | $299 | 9.0% |
| Total | $3,329 | 100% |
Figure 8: Leveraged Partner Funding by Sector (in millions of dollars) – 2022-23
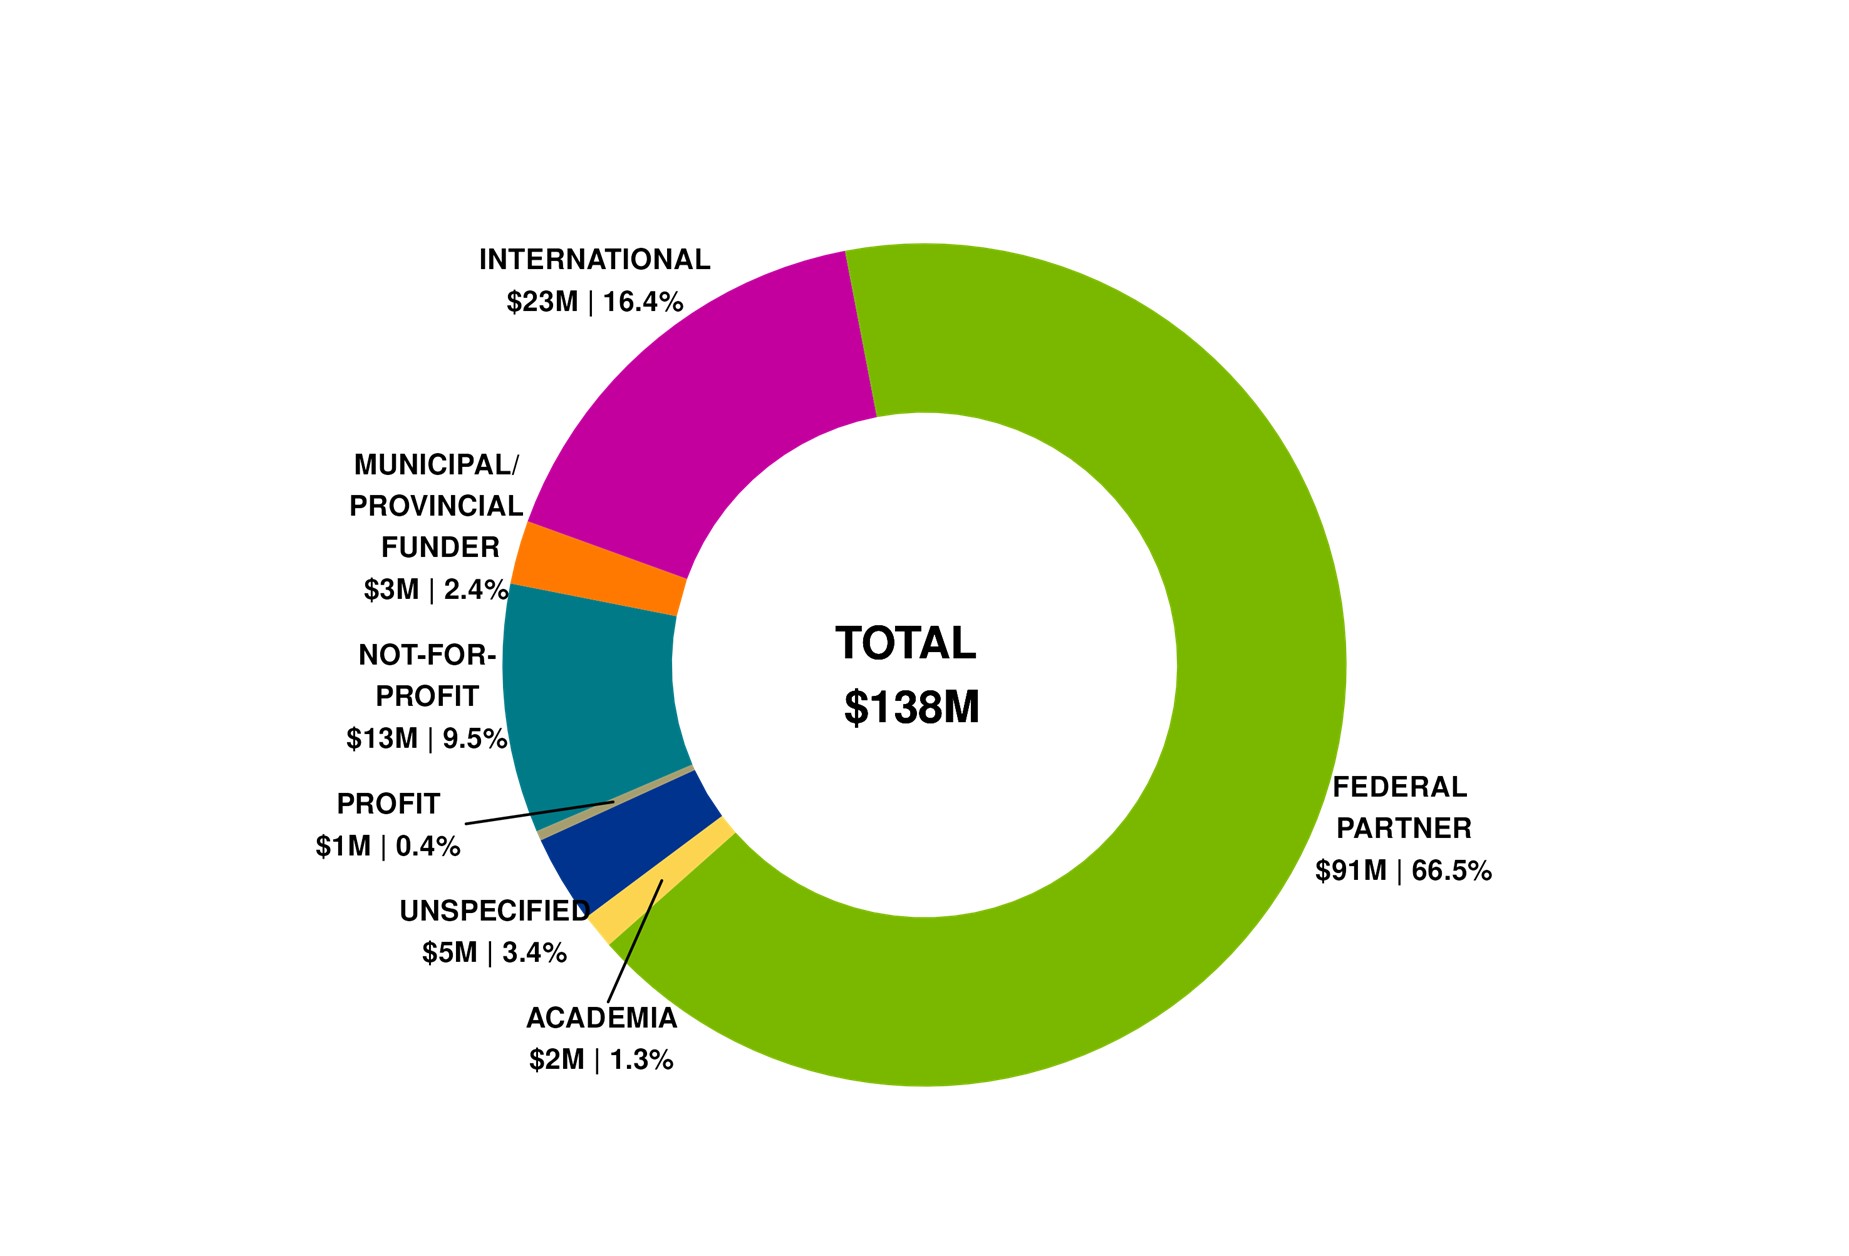
- Due to rounding, figures may not reconcile with other published information
- Includes partner contributions administered by CIHR, in kind and direct contributions from partner directly to the researcher
- Includes both competition and applicant partner contributions where there may or may not be a formal agreement with CIHR
Figure 8 long description
| Sector | Total | Percentage |
|---|---|---|
| Academia | $2 | 1.3% |
| Federal partner | $91 | 66.5% |
| International | $23 | 16.4% |
| Municipal/Provincial funder | $3 | 2.4% |
| Not-for-profit | $13 | 9.5% |
| Profit | $1 | 0.4% |
| Unspecified | $5 | 3.4% |
| Total | $138 | 100% |
2021-2022
Figure 1: CIHR Fiscal Year Investments by Primary Theme since 1999-00 (in millions of dollars)
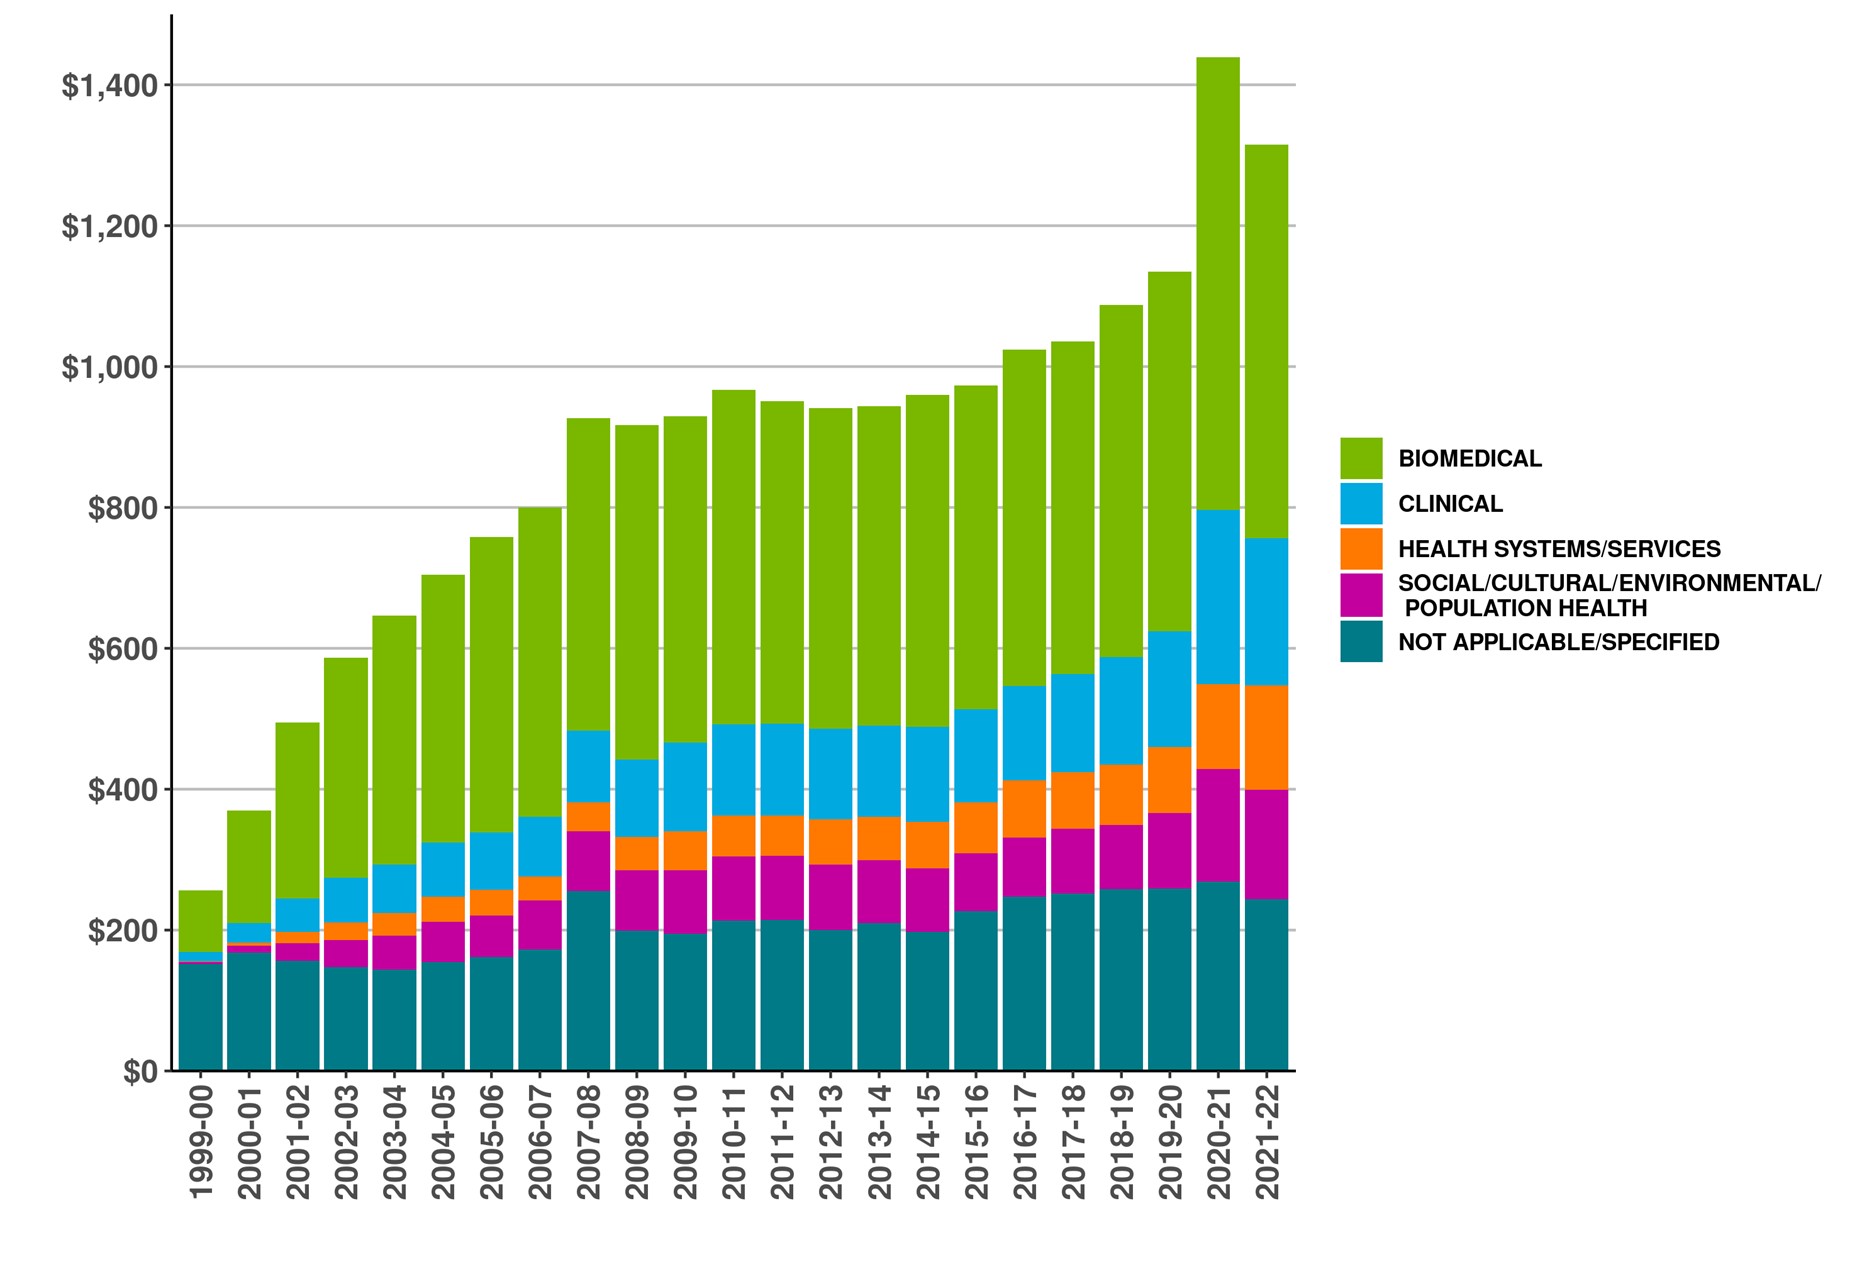
- Due to rounding, figures may not reconcile with other published information
- Excludes operating expenditures and partner contributions
- Primary theme designation is determined by the grantee at the time of application
Figure 1 long description
| Primary theme | 1999-00 | 2000-01 | 2001-02 | 2002-03 | 2003-04 | 2004-05 | 2005-06 | 2006-07 | 2007-08 | 2008-09 | 2009-10 | 2010-11 | 2011-12 | 2012-13 | 2013-14 | 2014-15 | 2015-16 | 2016-17 | 2017-18 | 2018-19 | 2019-20 | 2020-21 | 2021-22 |
|---|---|---|---|---|---|---|---|---|---|---|---|---|---|---|---|---|---|---|---|---|---|---|---|
| Biomedical | 88∣88 | 88∣160 | 250∣250 | 250∣312 | 354∣354 | 354∣381 | 419∣419 | 419∣439 | 444∣444 | 444∣474 | 463∣463 | 463∣475 | 458∣458 | 458∣455 | 454∣454 | 454∣471 | 459∣459 | 459∣478 | 472∣472 | 472∣500 | 510∣510 | 510∣643 | $559 |
| Clinical | 13∣13 | 13∣27 | 47∣47 | 47∣64 | 69∣69 | 69∣77 | 82∣82 | 82∣85 | 101∣101 | 101∣110 | 126∣126 | 126∣129 | 130∣130 | 130∣129 | 130∣130 | 130∣134 | 132∣132 | 132∣133 | 140∣140 | 140∣153 | 164∣164 | 164∣247 | $209 |
| Health systems/services | 0.7∣0.7 | 0.7∣5 | 16∣16 | 16∣25 | 32∣32 | 32∣36 | 36∣36 | 36∣34 | 42∣42 | 42∣48 | 55∣55 | 55∣58 | 57∣57 | 57∣64 | 61∣61 | 61∣66 | 73∣73 | 73∣82 | 80∣80 | 80∣86 | 94∣94 | 94∣120 | $148 |
| Social/Cultural/Environmental/Population Health | 3∣3 | 3∣9 | 25∣25 | 25∣38 | 47∣47 | 47∣56 | 60∣60 | 60∣69 | 84∣84 | 84∣85 | 90∣90 | 90∣91 | 91∣91 | 91∣92 | 90∣90 | 90∣90 | 82∣82 | 82∣83 | 91∣91 | 91∣92 | 108∣108 | 108∣160 | $155 |
| Not applicable/Specified | 152∣152 | 152∣168 | 157∣157 | 157∣148 | 144∣144 | 144∣155 | 161∣161 | 161∣172 | 255∣255 | 255∣199 | 195∣195 | 195∣213 | 215∣215 | 215∣201 | 210∣210 | 210∣197 | 227∣227 | 227∣248 | 252∣252 | 252∣258 | 259∣259 | 259∣269 | $244 |
| Total | $257 | $370 | $494 | $587 | $647 | $705 | $758 | $800 | $927 | $917 | $929 | $967 | $951 | $941 | $944 | $960 | $973 | $1,024 | $1,035 | $1,088 | $1,135 | $1,439 | $1,315 |
Figure 2: CIHR Investments by Primary Theme 2021-22 (in millions of dollars)
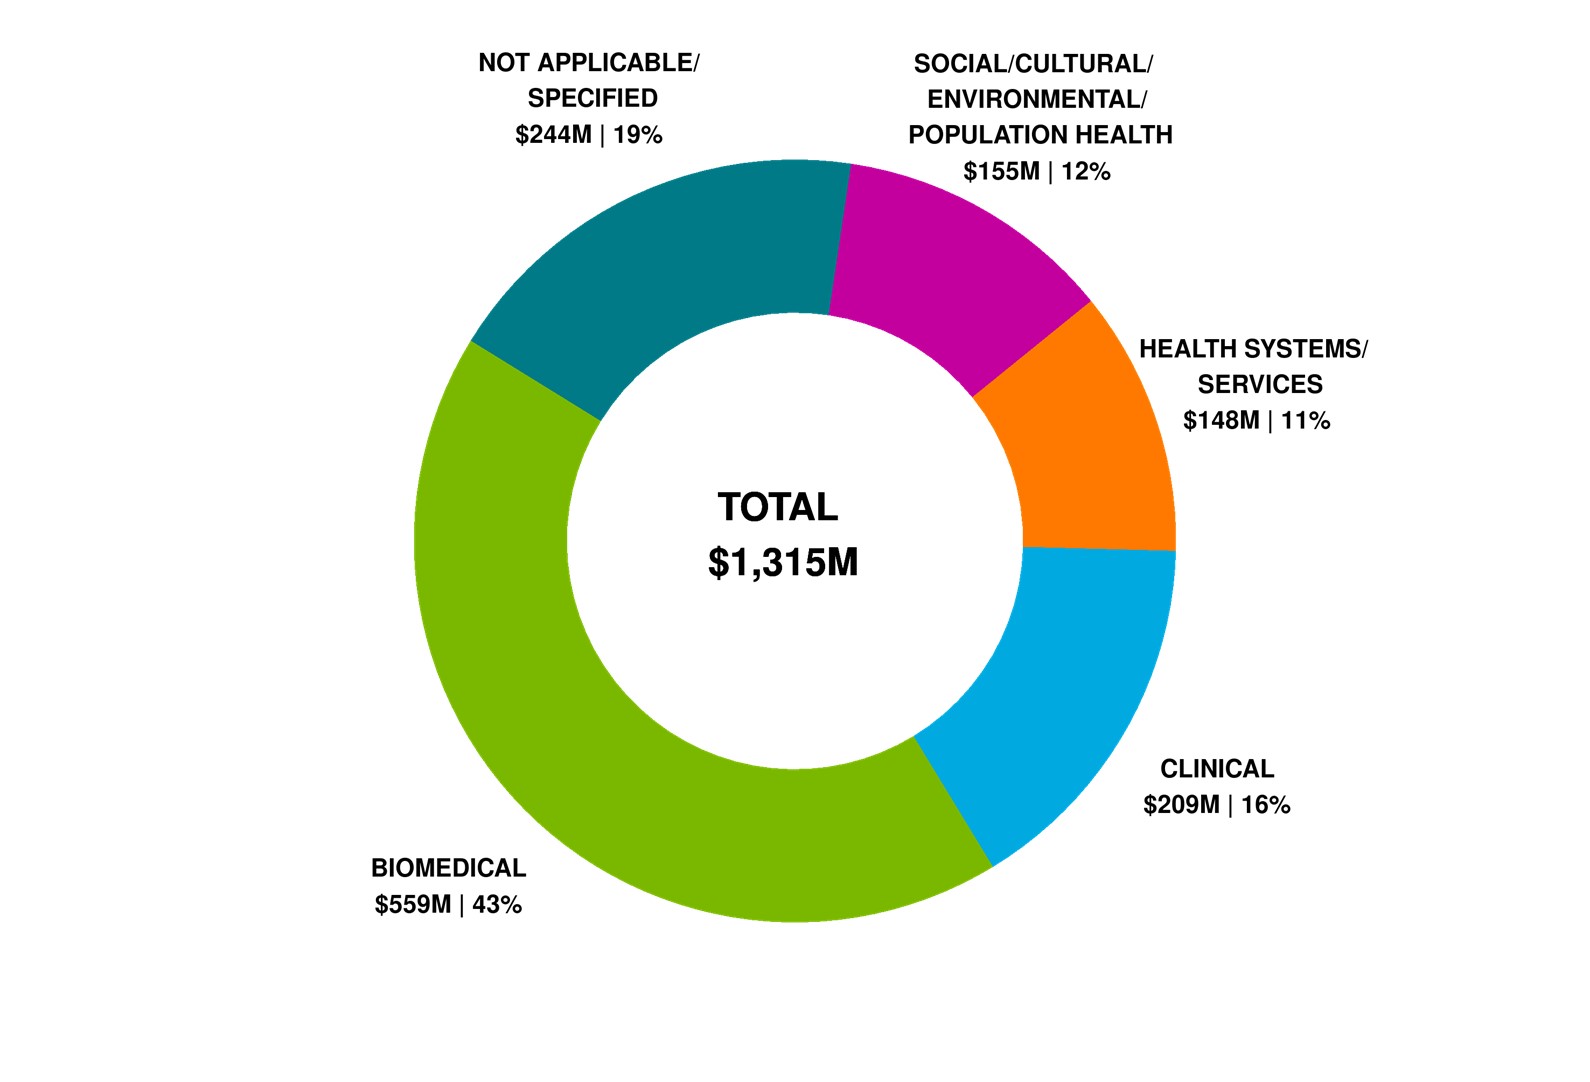
- Due to rounding, figures may not reconcile with other published information
- Excludes operating expenditures and partner contributions
- Primary theme designation is determined by the grantee at the time of application
Figure 2 long description
| Primary Theme | 2021-22 | Percentage Breakdown |
|---|---|---|
| Biomedical | $559 | 43% |
| Clinical | $209 | 16% |
| Health systems/services | $148 | 11% |
| Social/Cultural/Environmental/Population Health | $155 | 12% |
| Not applicable/Specified | $244 | 19% |
| Total | $1,315 | 100% |
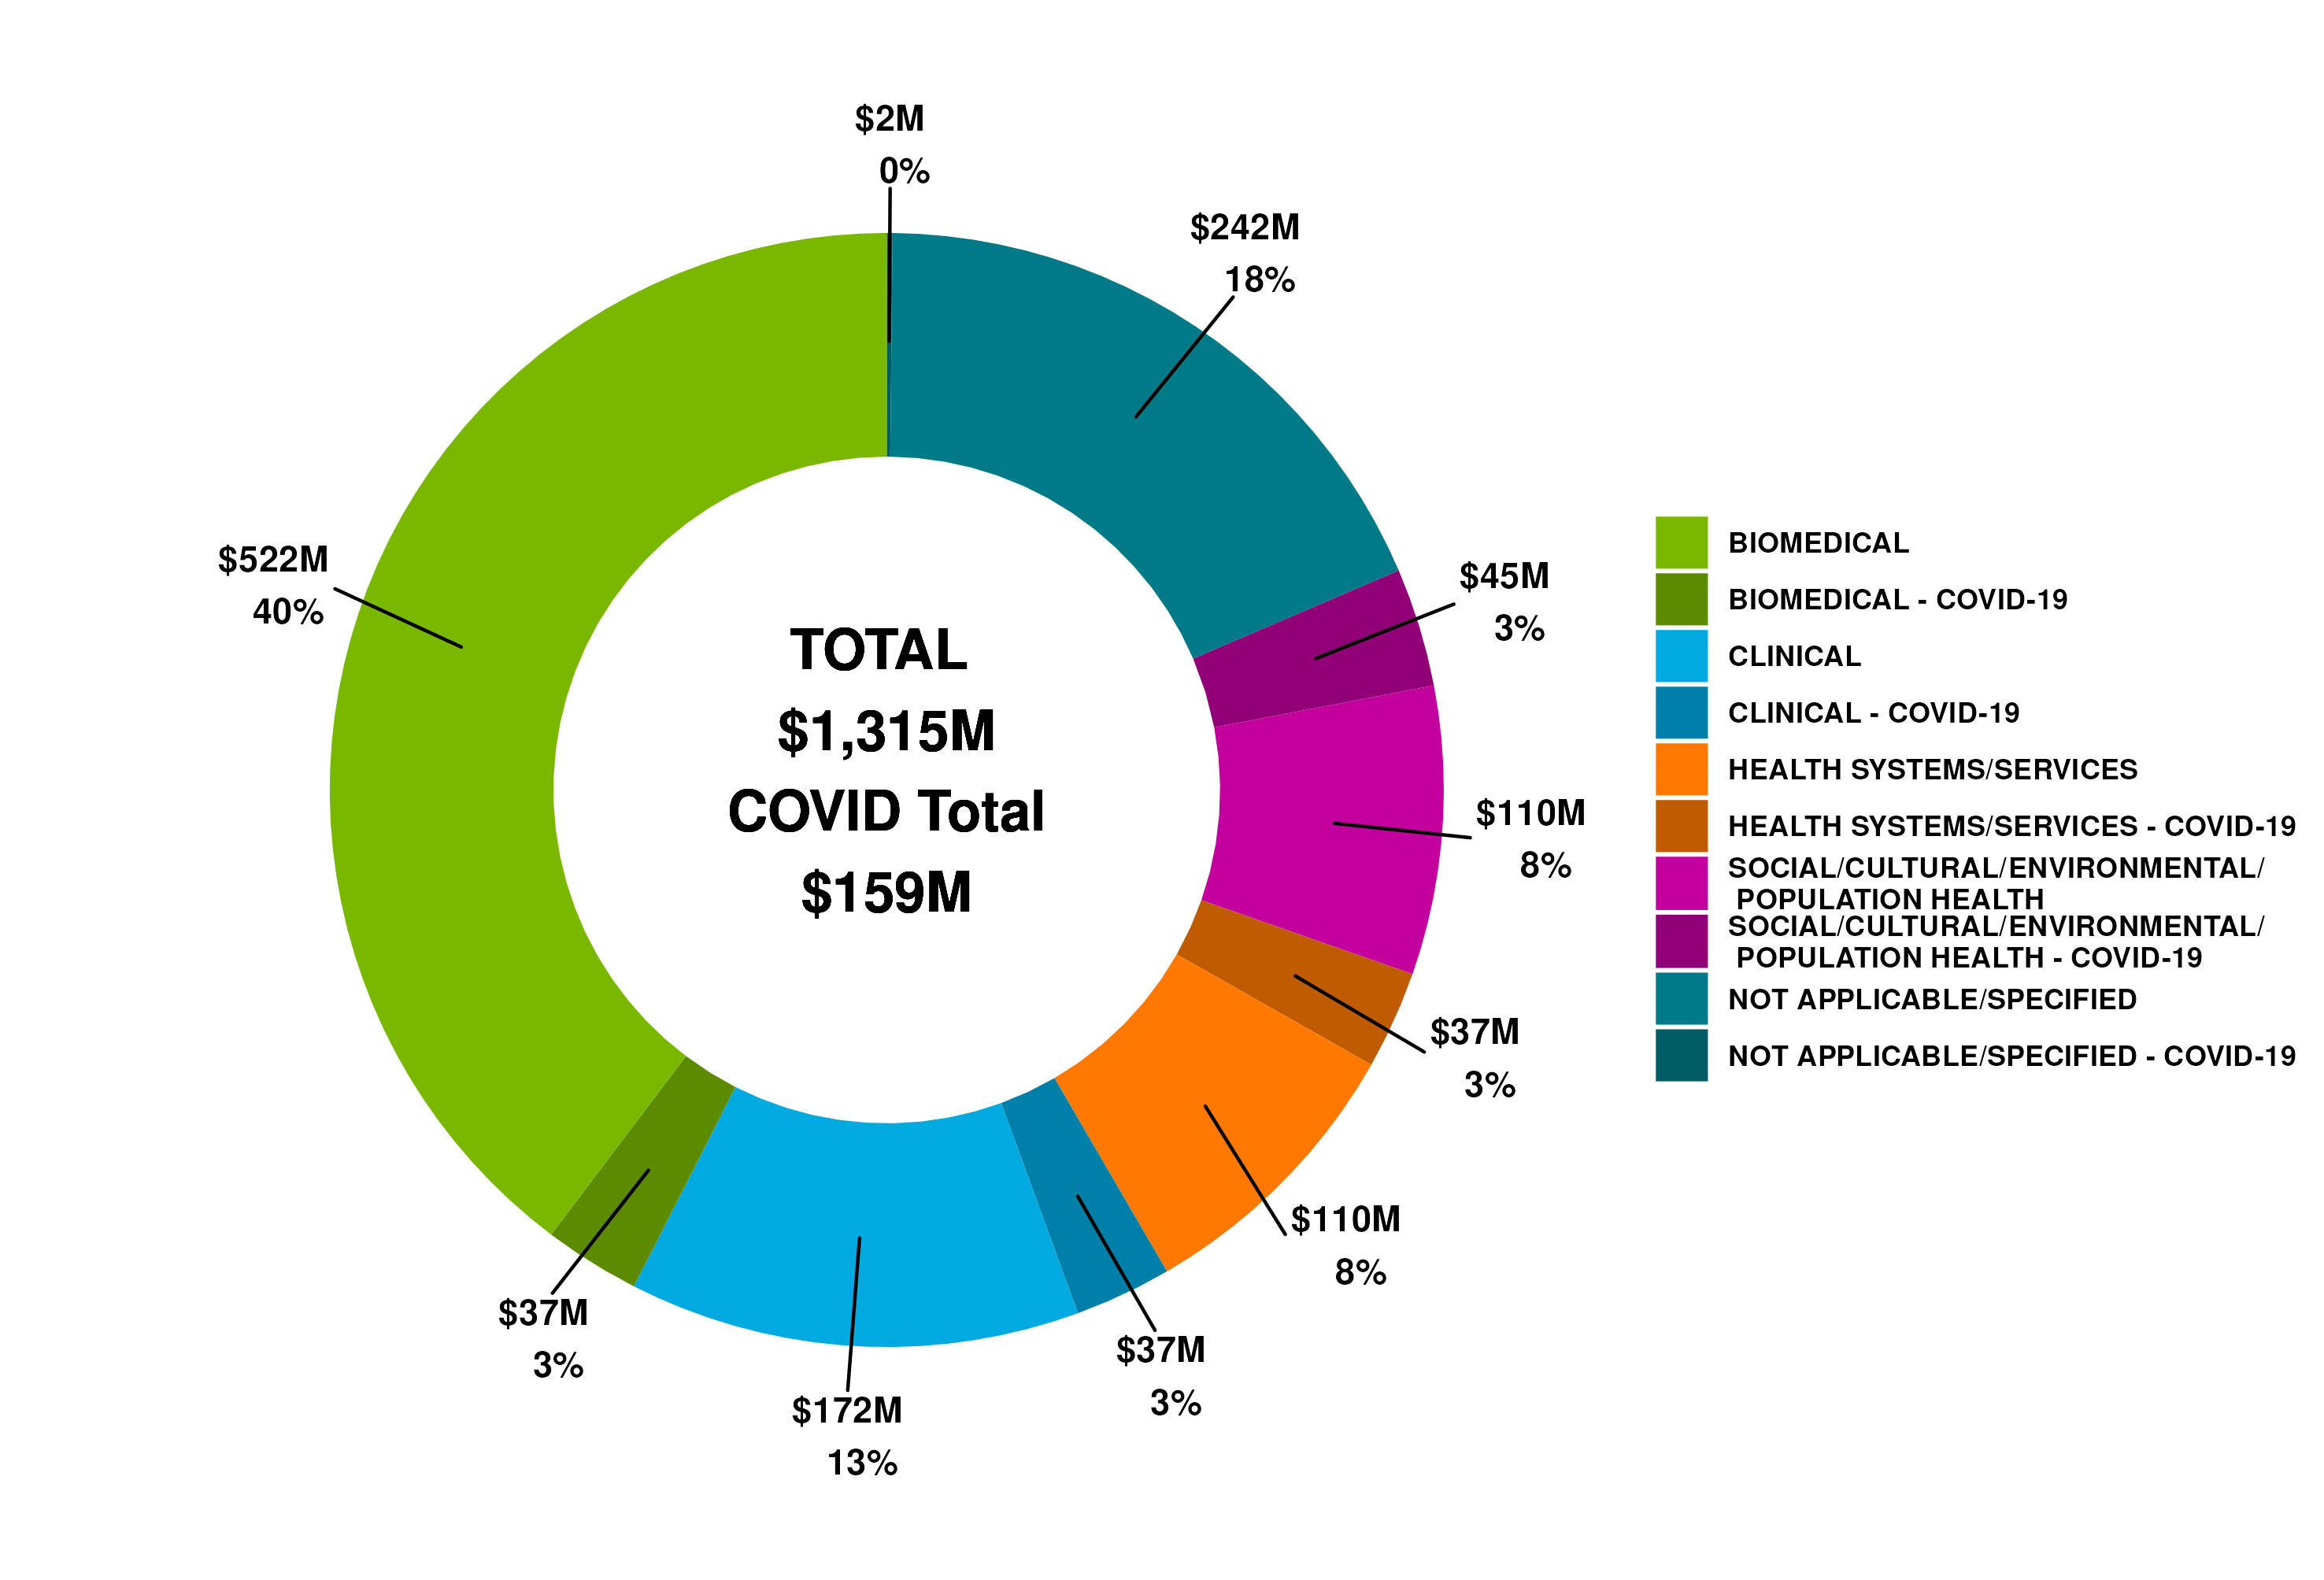
Figure 2: CIHR Investments by Primary Theme and COVID-19 funding 2021-22 (in millions of dollars)
- Due to rounding, figures may not reconcile with other published information
- Excludes operating expenditures and partner contributions
- Primary theme designation is determined by the grantee at the time of application
- COVID-19 funding is determined by granting to a COVID-19-specific funding competition
Figure 2 long description
| Primary Theme | 2021-22 | Percentage Breakdown | |
|---|---|---|---|
| Biomedical | non COVID-19 | $522 | 40% |
| COVID-19 | $37 | 3% | |
| Clinical | non COVID-19 | $172 | 13% |
| COVID-19 | $37 | 3% | |
| Health systems/services | non COVID-19 | $110 | 8% |
| COVID-19 | $37 | 3% | |
| Social/Cultural/Environmental/Population Health | non COVID-19 | $242 | 18% |
| COVID-19 | $2 | 0.2% | |
| Not applicable/Specified | non COVID-19 | $110 | 8% |
| COVID-19 | $45 | 3% | |
| Total | $1,315 | 100% |
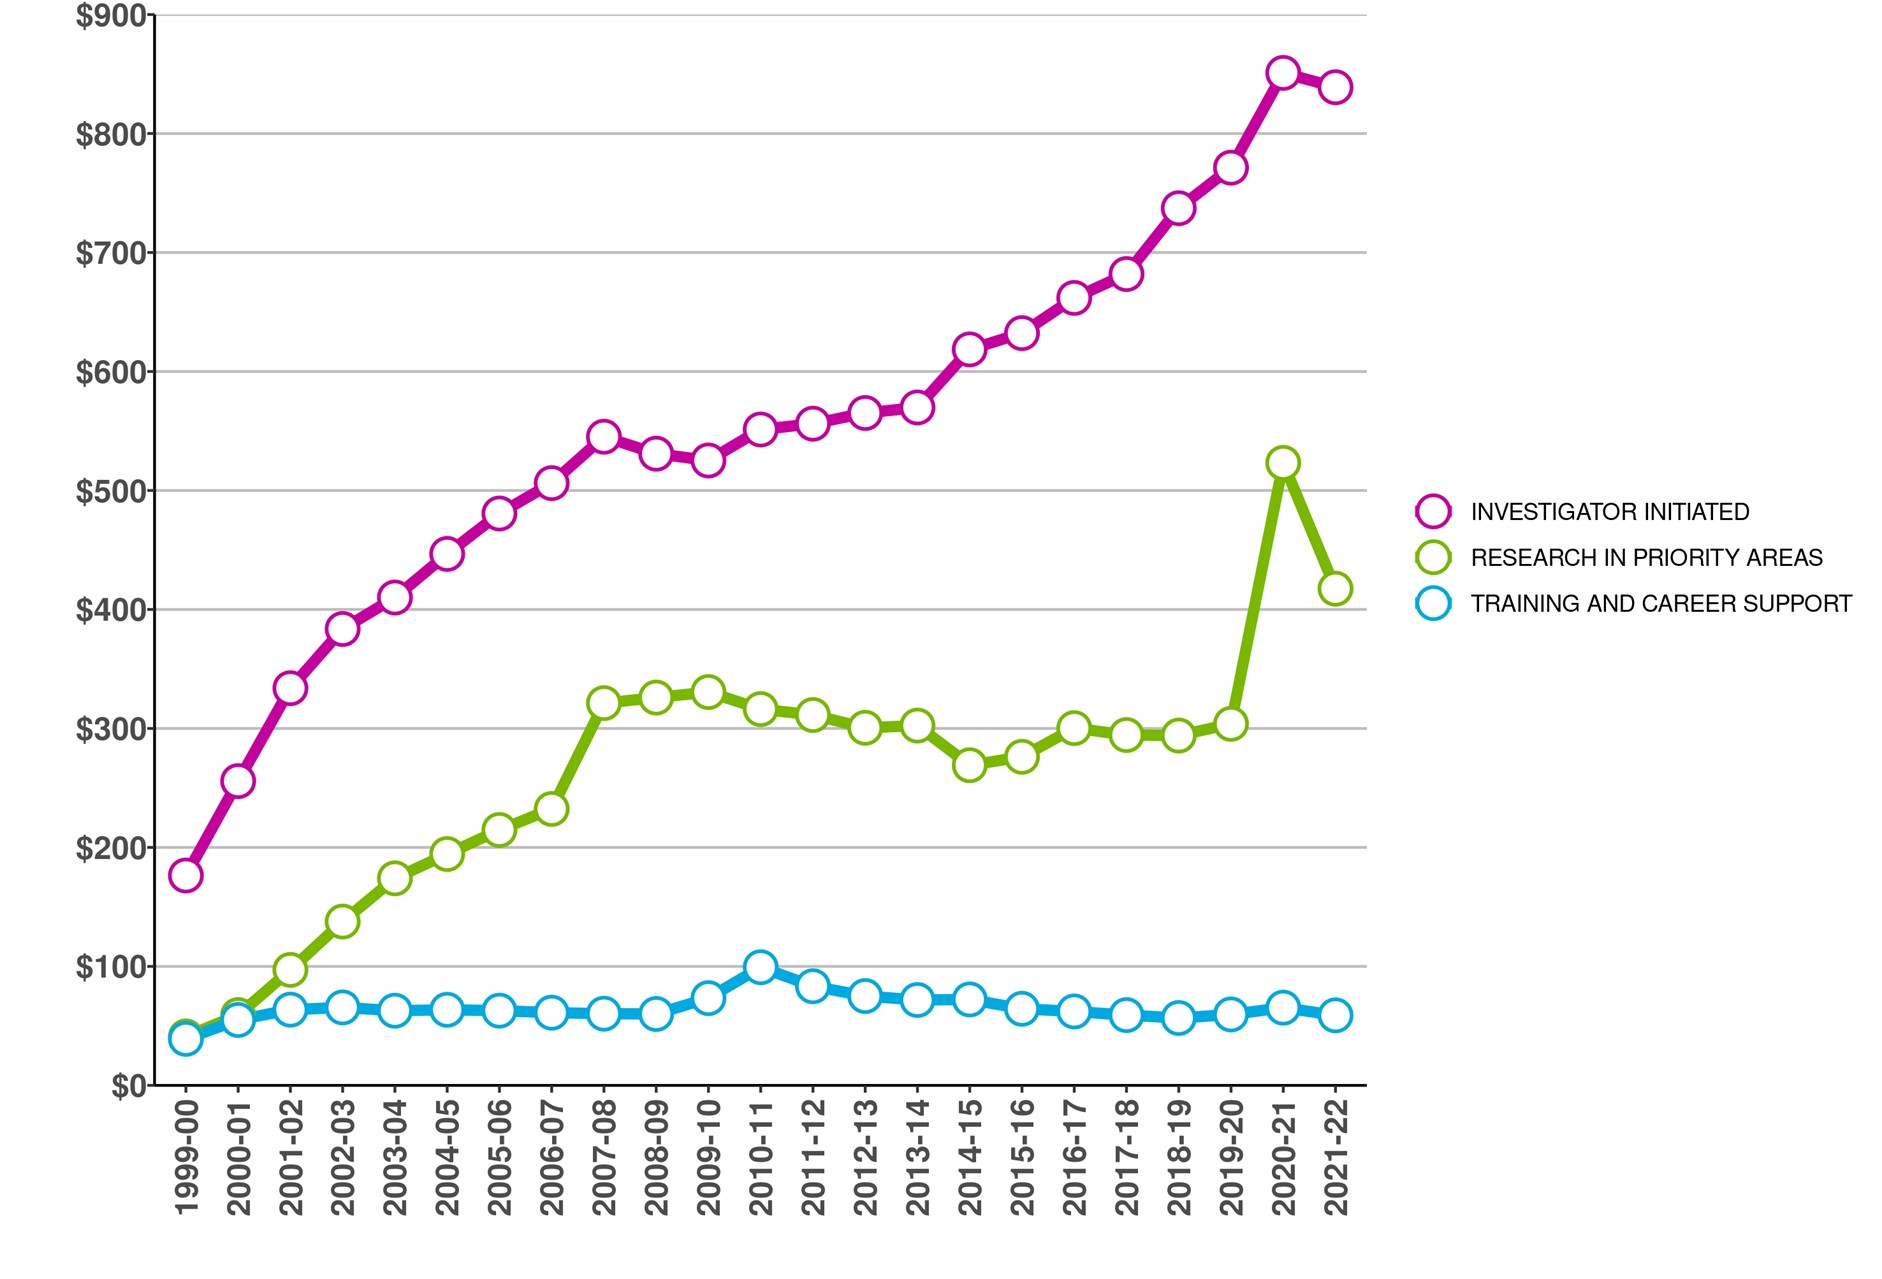
Figure 3: CIHR Fiscal Year Investments by Funding Type since 1999-00 (in millions of dollars)
- Due to rounding, figures may not reconcile with other published information
- Excludes operating expenditures and partner contributions
Figure 3 long description
| Funding type | 1999-00 | 2000-01 | 2001-02 | 2002-03 | 2003-04 | 2004-05 | 2005-06 | 2006-07 | 2007-08 | 2008-09 | 2009-10 | 2010-11 | 2011-12 | 2012-13 | 2013-14 | 2014-15 | 2015-16 | 2016-17 | 2017-18 | 2018-19 | 2019-20 | 2020-21 | 2021-22 |
|---|---|---|---|---|---|---|---|---|---|---|---|---|---|---|---|---|---|---|---|---|---|---|---|
| Investigator Initiated | 176∣176 | 176∣256 | 334∣334 | 334∣384 | 410∣410 | 410∣447 | 481∣481 | 481∣506 | 545∣545 | 545∣531 | 525∣525 | 525∣551 | 556∣556 | 556∣565 | 570∣570 | 570∣619 | 632∣632 | 632∣662 | 682∣682 | 682∣737 | 771∣771 | 771∣851 | $839 |
| Research in Priority Areas | 41∣41 | 41∣59 | 97∣97 | 97∣138 | 174∣174 | 174∣194 | 215∣215 | 215∣232 | 321∣321 | 321∣326 | 331∣331 | 331∣316 | 311∣311 | 311∣301 | 302∣302 | 302∣269 | 276∣276 | 276∣300 | 294∣294 | 294∣294 | 304∣304 | 304∣523 | $417 |
| Training and Career Support | 39∣39 | 39∣55 | 64∣64 | 64∣65 | 63∣63 | 63∣63 | 63∣63 | 63∣61 | 60∣60 | 60∣60 | 73∣73 | 73∣99 | 83∣83 | 83∣75 | 72∣72 | 72∣72 | 64∣64 | 64∣62 | 59∣59 | 59∣57 | 60∣60 | 60∣65 | $59 |
| Total | $257 | $370 | $494 | $587 | $647 | $705 | $758 | $800 | $927 | $917 | $929 | $967 | $951 | $941 | $944 | $960 | $973 | $1,024 | $1,035 | $1,088 | $1,135 | $1,439 | $1,315 |
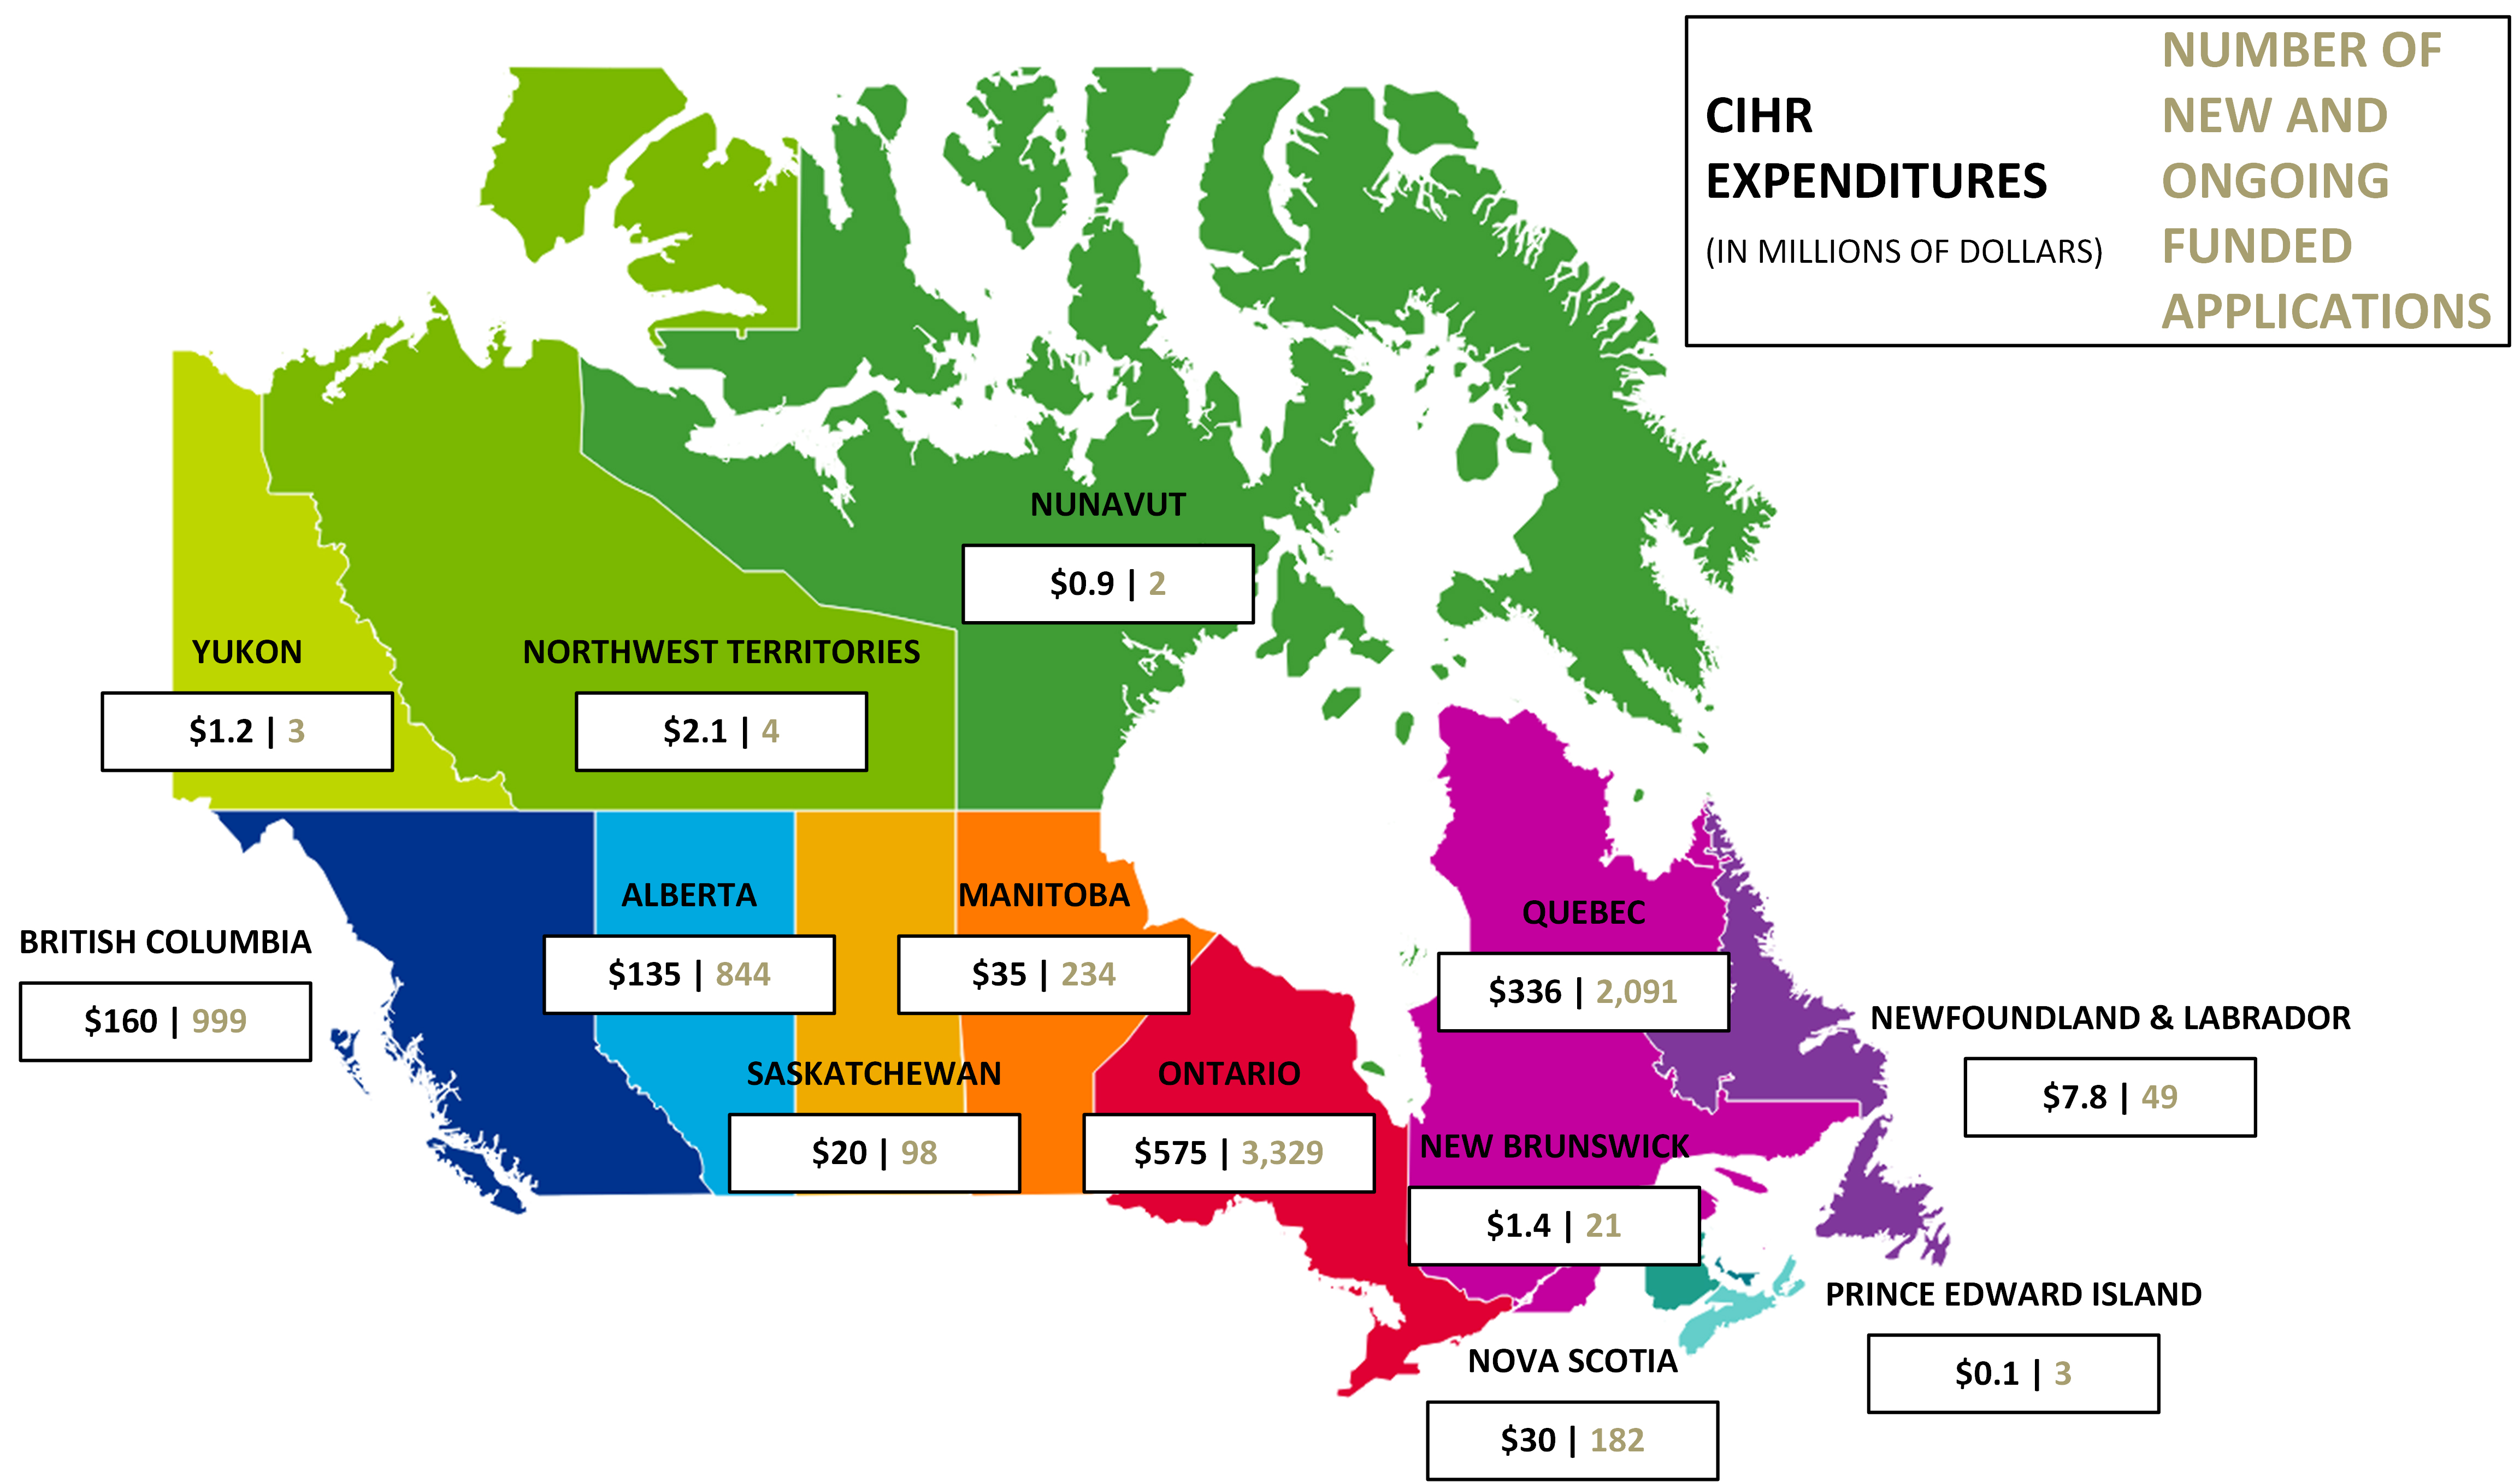
Figure 4: CIHR Investments by Region in 2021-22 (in millions of dollars)
- Due to rounding, figures may not reconcile with other published information
- Excludes operating expenditures, partner contributions and direct payments
Figure 4 long description
| Region | CIHR Expenditures 2021-22 | Number of new and ongoing funded applications 2021-22 |
|---|---|---|
| Alberta | $135 | 844 |
| British Columbia | $160 | 999 |
| Manitoba | $35 | 234 |
| New Brunswick | $1.4 | 21 |
| Newfoundland & Labrador | $7.8 | 49 |
| North West Territories | $2.1 | 4 |
| Nova Scotia | $30 | 182 |
| Nunavut | $0.9 | 2 |
| Ontario | $575 | 3,329 |
| Prince Edward Island | $0.1 | 3 |
| Quebec | $336 | 2,091 |
| Saskatchewan | $20 | 98 |
| Yukon | $1.2 | 3 |
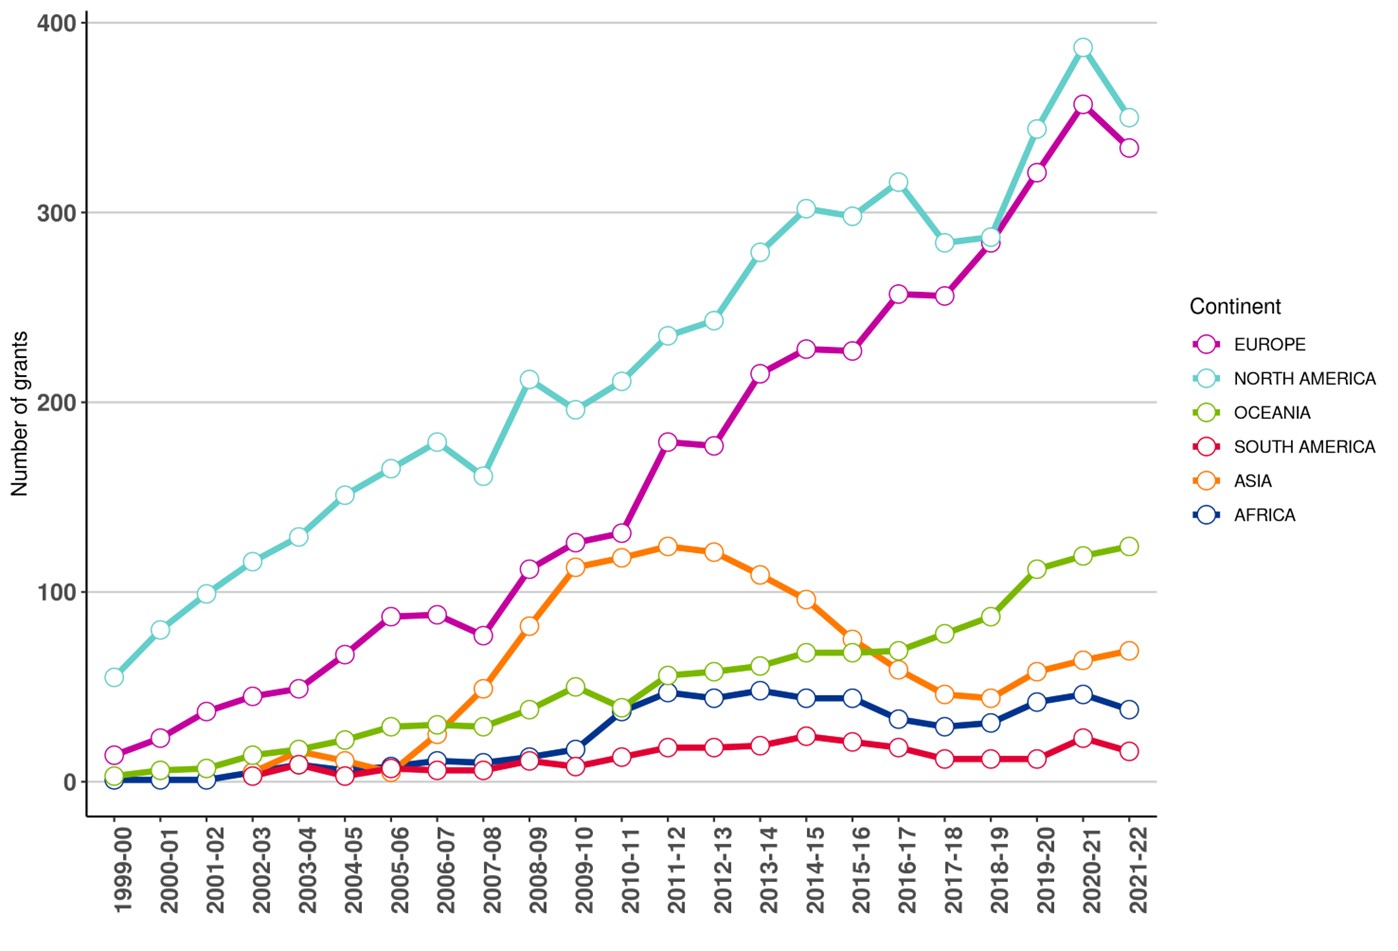
Figure 5a: Number of New and Ongoing Projects
- Due to rounding as well as changes in methodology, figures may not reconcile with other published information.
- Excludes operating expenditures and partner contributions.
- As of March 2021, an updated method is used to determine international collaborators based on affiliations at the time of grant submission.
Figure 5a long description
| Continent | 1999-00 | 2000-01 | 2001-02 | 2002-03 | 2003-04 | 2004-05 | 2005-06 | 2006-07 | 2007-08 | 2008-09 | 2009-10 | 2010-11 | 2011-12 | 2012-13 | 2013-14 | 2014-15 | 2015-16 | 2016-17 | 2017-18 | 2018-19 | 2019-20 | 2020-21 | 2021-22 |
|---|---|---|---|---|---|---|---|---|---|---|---|---|---|---|---|---|---|---|---|---|---|---|---|
| Africa | 1 | 1 | 1 | 5 | 9 | 6 | 8 | 11 | 10 | 13 | 17 | 37 | 47 | 44 | 48 | 44 | 44 | 33 | 29 | 31 | 42 | 46 | 38 |
| Europe | 14 | 23 | 37 | 45 | 49 | 67 | 87 | 88 | 77 | 112 | 126 | 131 | 179 | 177 | 215 | 228 | 227 | 257 | 256 | 284 | 321 | 357 | 334 |
| North America | 55 | 80 | 99 | 116 | 129 | 151 | 165 | 179 | 161 | 212 | 196 | 211 | 235 | 243 | 279 | 302 | 298 | 316 | 284 | 287 | 344 | 387 | 350 |
| Oceania | 3 | 6 | 7 | 14 | 17 | 22 | 29 | 30 | 29 | 38 | 50 | 39 | 56 | 58 | 61 | 68 | 68 | 69 | 78 | 87 | 112 | 119 | 124 |
| Asia | 0 | 0 | 0 | 5 | 16 | 11 | 5 | 25 | 49 | 82 | 113 | 118 | 124 | 121 | 109 | 96 | 75 | 59 | 46 | 44 | 58 | 64 | 69 |
| South America | 0 | 0 | 0 | 3 | 9 | 3 | 7 | 6 | 6 | 11 | 8 | 13 | 18 | 18 | 19 | 24 | 21 | 18 | 12 | 12 | 12 | 23 | 16 |
Figure 5b: Proportion of CIHR Grants with International linkages since 1999-00
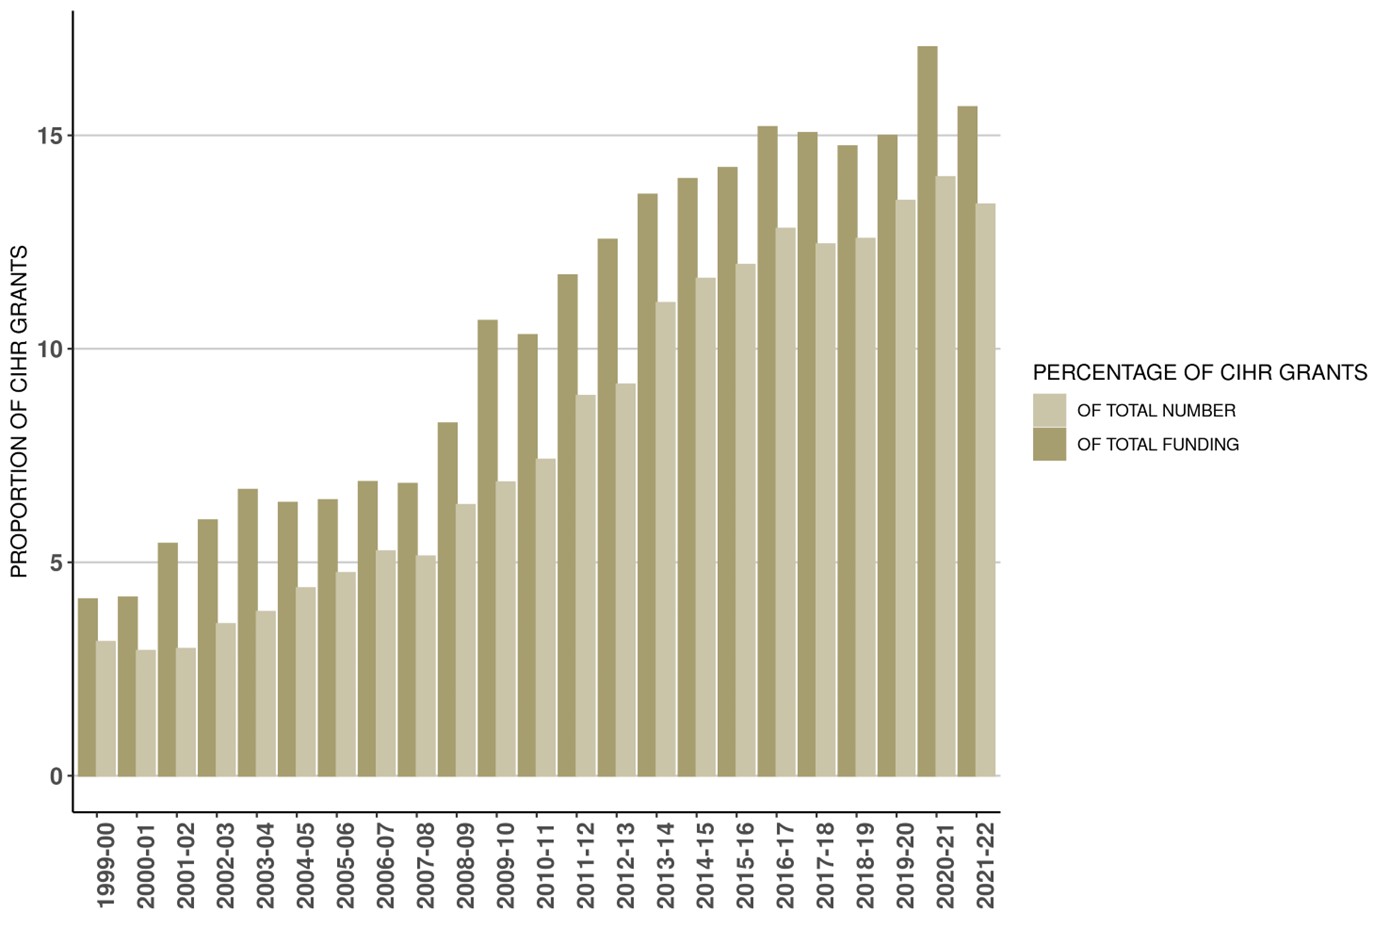
- Due to rounding as well as changes in methodology, figures may not reconcile with other published information.
- Excludes operating expenditures and partner contributions.
- As of March 2021, an updated method is used to determine international collaborators based on affiliations at the time of grant submission.
Figure 5b long description
| Proportion | 1999-00 | 2000-01 | 2001-02 | 2002-03 | 2003-04 | 2004-05 | 2005-06 | 2006-07 | 2007-08 | 2008-09 | 2009-10 | 2010-11 | 2011-12 | 2012-13 | 2013-14 | 2014-15 | 2015-16 | 2016-17 | 2017-18 | 2018-19 | 2019-20 | 2020-21 | 2021-22 |
|---|---|---|---|---|---|---|---|---|---|---|---|---|---|---|---|---|---|---|---|---|---|---|---|
| Percentage of total CIHR investments | 4.1% | 4.2% | 5.4% | 6% | 6.7% | 6.4% | 6.5% | 6.9% | 6.8% | 8.3% | 10.7% | 10.3% | 11.7% | 12.6% | 13.6% | 14% | 14.2% | 15.2% | 15.1% | 14.7% | 15% | 17.1% | 15.7% |
| Percentage of total # of CIHR grants | 3.1% | 2.9% | 3% | 3.6% | 3.8% | 4.4% | 4.7% | 5.3% | 5.1% | 6.3% | 6.9% | 7.4% | 8.9% | 9.2% | 11.1% | 11.6% | 12% | 12.8% | 12.4% | 12.6% | 13.5% | 14% | 13.4% |
Figure 6: Countries with an International Linkage to a CIHR grants since 1999-00
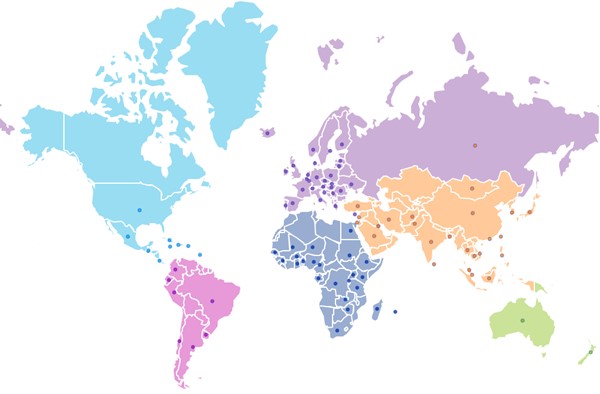
- Due to changes in methodology, figures may not reconcile with other published information
Figure 6 long description
| Countries |
|---|
| Afghanistan Argentina Australia Austria Bangladesh Barbados Belgium Benin Brazil Burkina Faso Cambodia Cameroon Chile China Colombia Costa Rica Croatia Cuba Cyprus Czech Republic Democratic Republic of the Congo Denmark Ecuador Egypt England Ethiopia Finland France Gabon Germany Ghana Greece Guatemala Guinea Haiti Hong Kong Hungary Iceland India Indonesia Iran Ireland Israel Italy Jamaica Japan Kenya Kuwait Lao People's Democratic Republic Latvia Lebanon Lithuania Luxembourg Madagascar Malaysia Mali Mauritius Mexico Mongolia Netherlands New Zealand Niger Nigeria Norway Pakistan Peru Philippines Poland Portugal Puerto Rico Romania Russia Rwanda Saudi Arabia Scotland Senegal Singapore Slovakia South Africa South Korea Spain Sri Lanka Sudan Sweden Switzerland Taiwan Tanzania Thailand Turkey Uganda Ukraine United Kingdom United States Uruguay Vietnam Yugoslavia Zambia Zimbabwe |
Figure 7: Leveraged Partner Funding by Sector (in millions of dollars) – Cumulative totals from 1999-00 to 2021-22
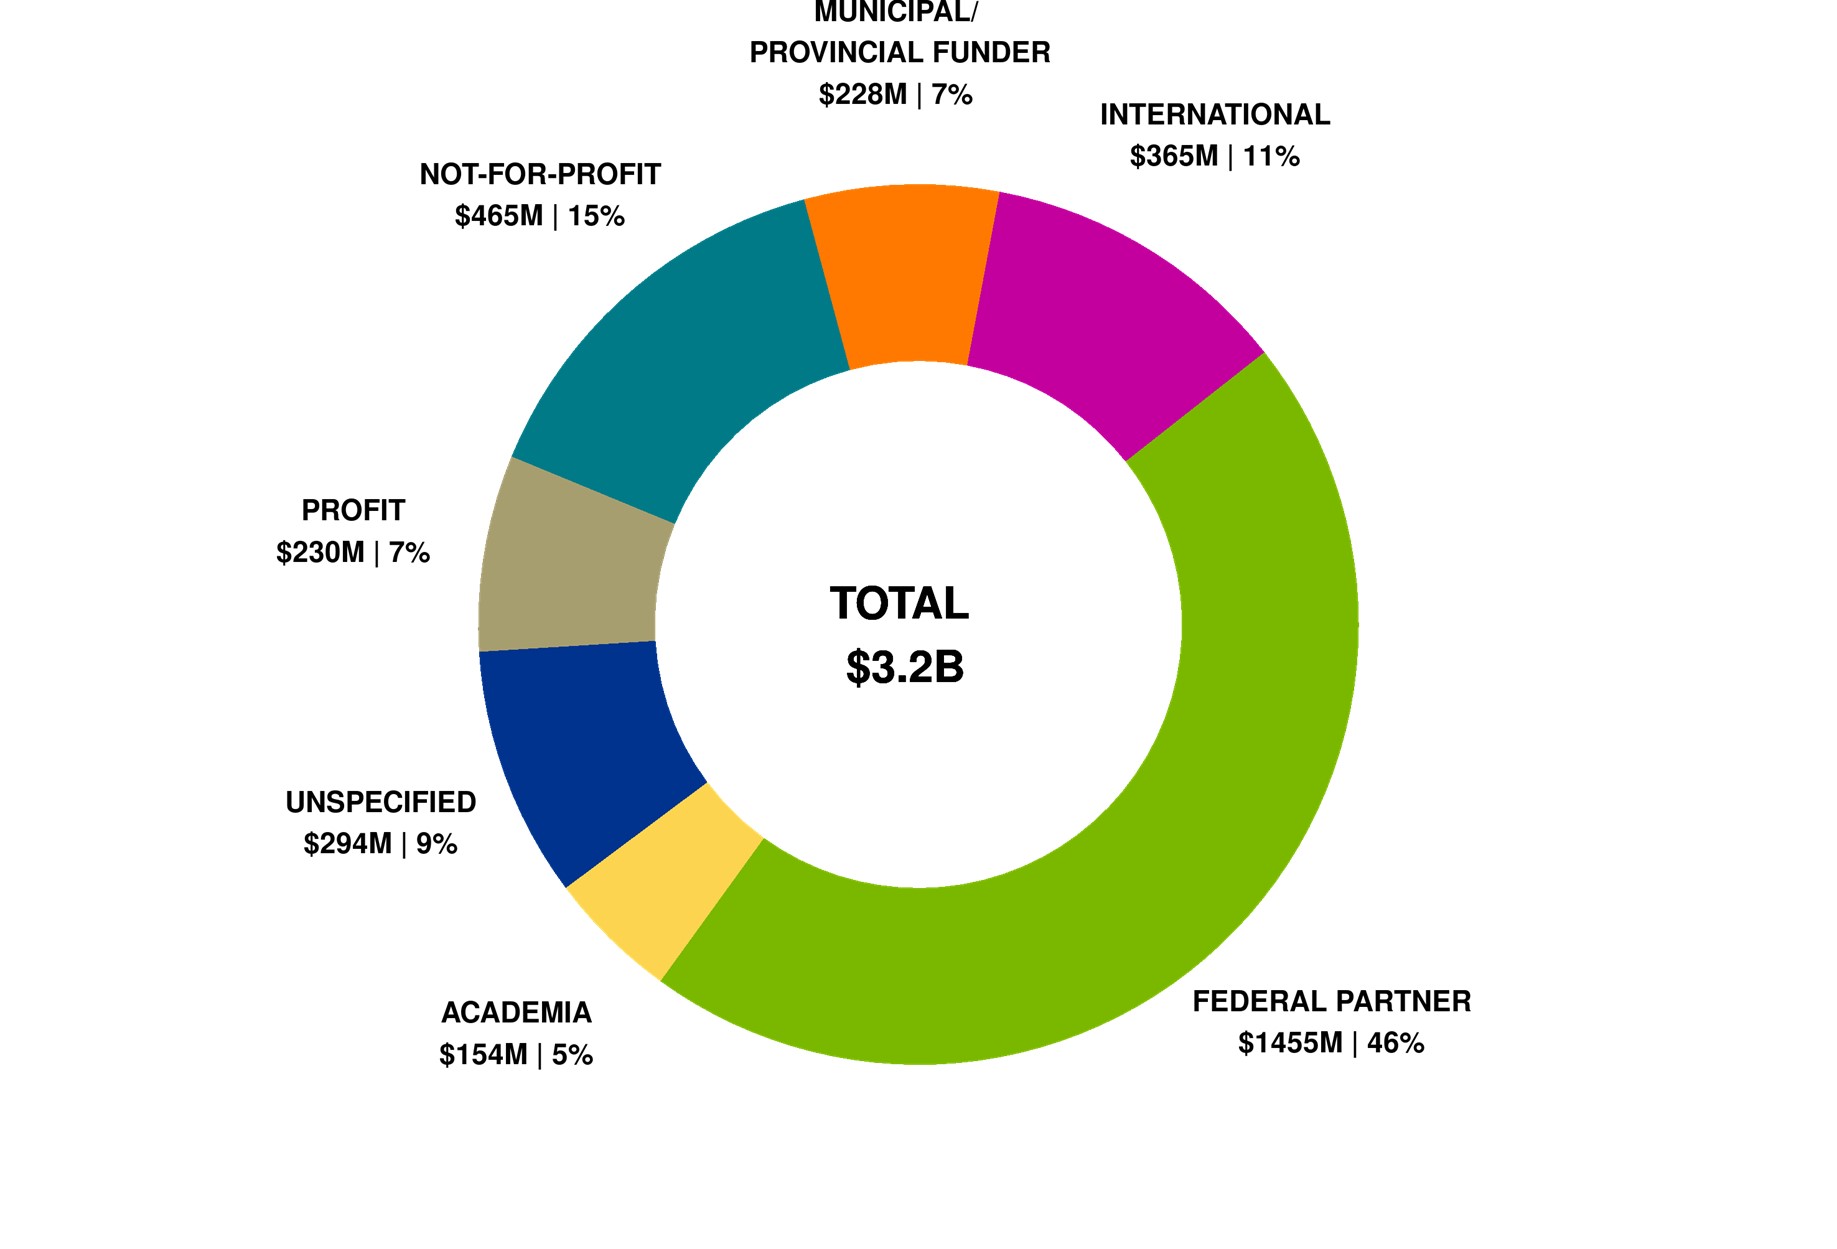
- Due to rounding, figures may not reconcile with other published information
- Includes partner contributions administered by CIHR, in kind and direct contributions from partner directly to the researcher
- Includes both competition and applicant partner contributions where there may or may not be a formal agreement with CIHR
Figure 7 long description
| Sector | Total | Percentage |
|---|---|---|
| Academia | $154 | 4.8% |
| Federal partners | $1,455 | 45.6% |
| International | $365 | 11.4% |
| Municipal/Provincial funder | $228 | 7.1% |
| Not-for-profit | $465 | 14.6% |
| Profit | $230 | 7.2% |
| Unspecified | $294 | 9.2% |
| Total | $3,192 | 100% |
Figure 8: Leveraged Partner Funding by Sector (in millions of dollars) – 2021-22
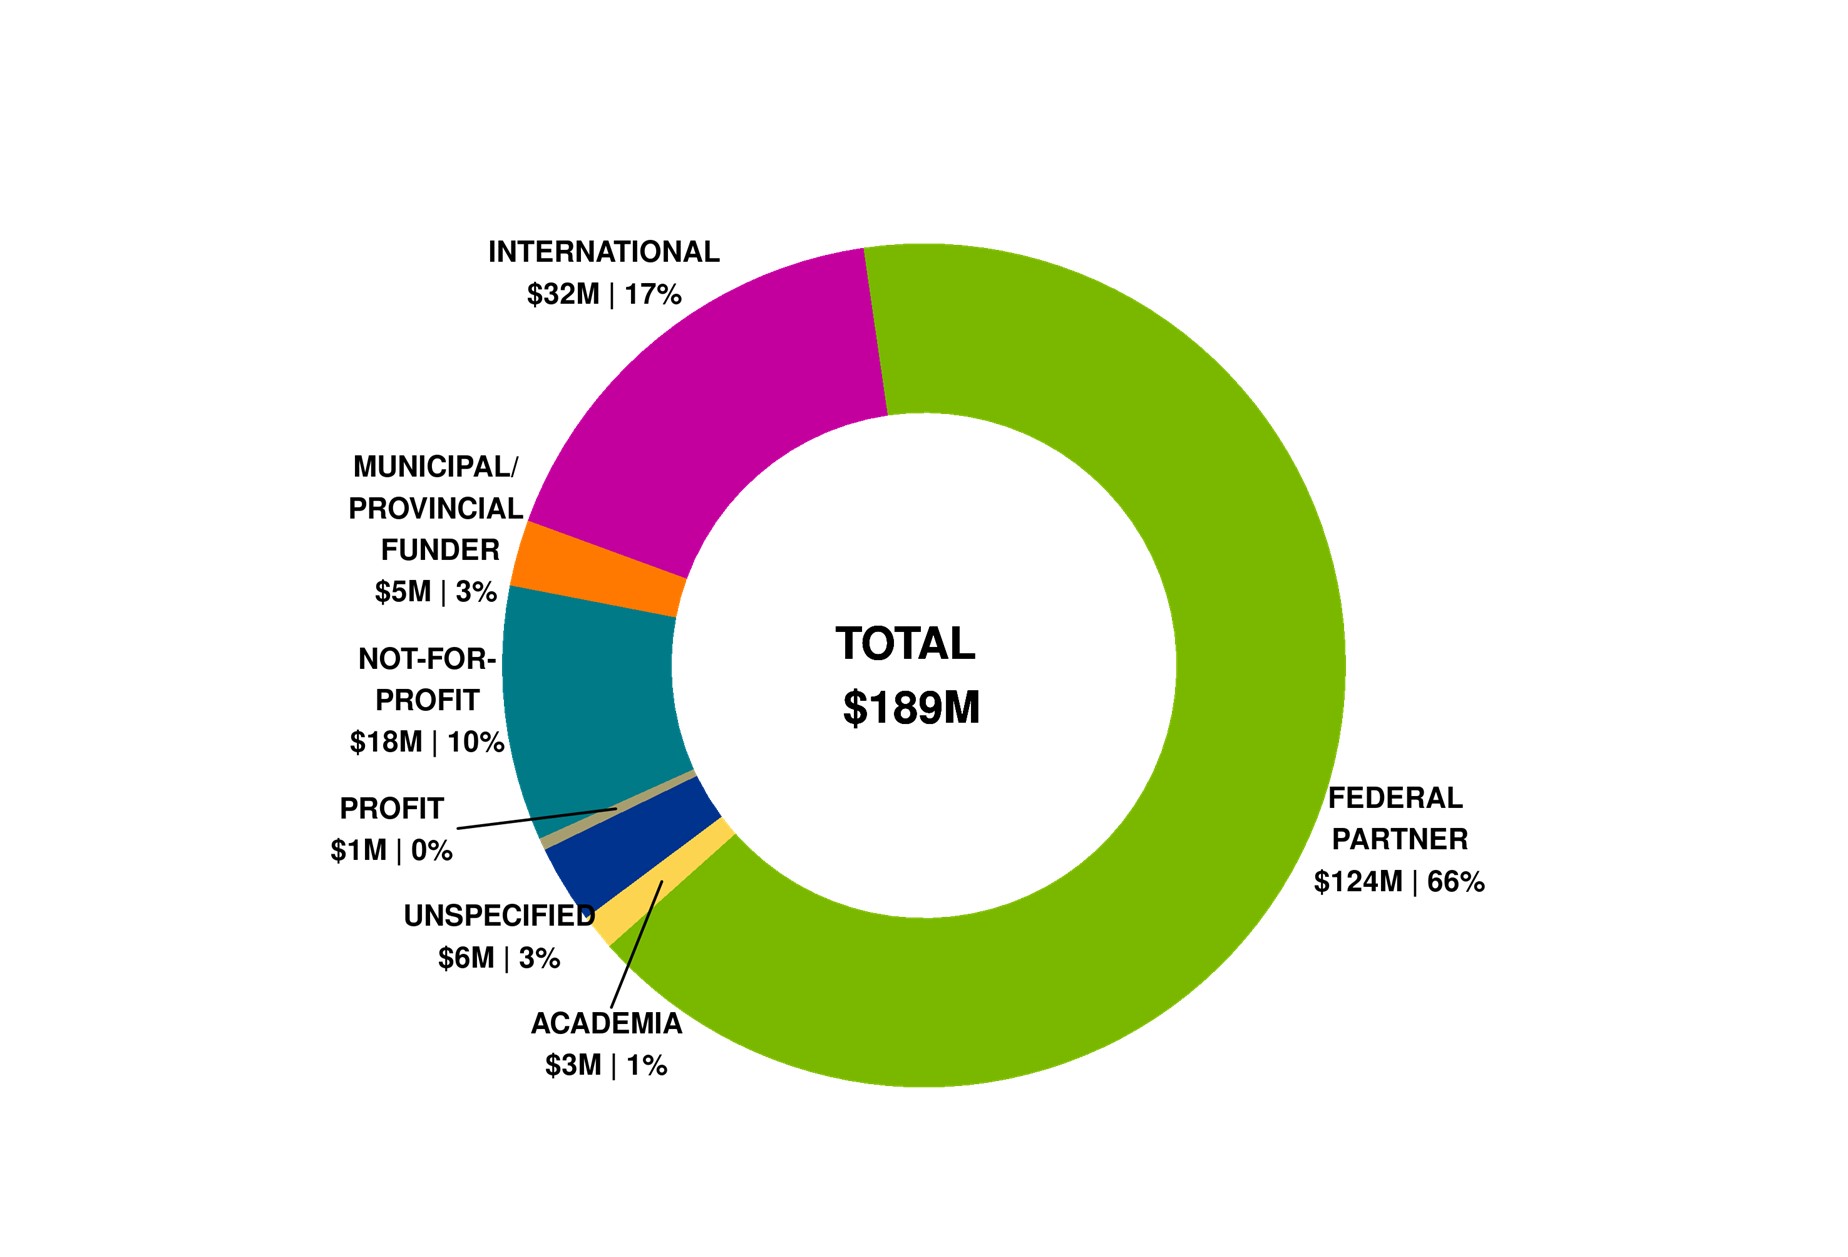
- Due to rounding, figures may not reconcile with other published information
- Includes partner contributions administered by CIHR, in kind and direct contributions from partner directly to the researcher
- Includes both competition and applicant partner contributions where there may or may not be a formal agreement with CIHR
Figure 8 long description
| Sector | Total | Percentage |
|---|---|---|
| Academia | $3 | 1% |
| Federal partner | $124 | 66% |
| International | $32 | 17% |
| Municipal/Provincial funder | $5 | 3% |
| Not-for-profit | $18 | 10% |
| Profit | $1 | 0% |
| Unspecified | $6 | 3% |
| Total | $189 | 100% |
2020-2021
Figure 1: CIHR Fiscal Year Investments by Primary Theme since 1999-00 (in millions of dollars)
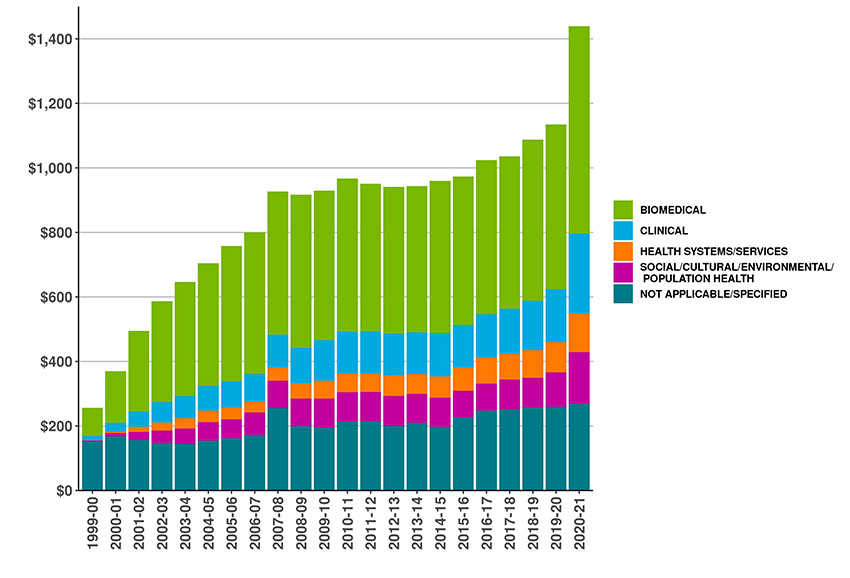
- Due to rounding, figures may not reconcile with other published information
- Excludes operating expenditures and partner contributions
- Primary theme designation is determined by the grantee at the time of application
Figure 1 long description
| Primary theme | 1999-00 | 2000-01 | 2001-02 | 2002-03 | 2003-04 | 2004-05 | 2005-06 | 2006-07 | 2007-08 | 2008-09 | 2009-10 | 2010-11 | 2011-12 | 2012-13 | 2013-14 | 2014-15 | 2015-16 | 2016-17 | 2017-18 | 2018-19 | 2019-20 | 2020-21 |
|---|---|---|---|---|---|---|---|---|---|---|---|---|---|---|---|---|---|---|---|---|---|---|
| Biomedical | 88∣88 | 88∣160 | 250∣250 | 250∣312 | 354∣354 | 354∣381 | 419∣419 | 419∣439 | 444∣444 | 444∣474 | 463∣463 | 463∣475 | 458∣458 | 458∣455 | 454∣454 | 454∣471 | 459∣459 | 459∣478 | 472∣472 | 472∣500 | 510∣510 | 510∣643 |
| Clinical | 13∣13 | 13∣27 | 47∣47 | 47∣64 | 69∣69 | 69∣77 | 82∣82 | 82∣85 | 101∣101 | 101∣110 | 126∣126 | 126∣129 | 130∣130 | 130∣129 | 130∣130 | 130∣134 | 132∣132 | 132∣133 | 140∣140 | 140∣153 | 164∣164 | 164∣247 |
| Health systems/services | 0.7∣0.7 | 0.7∣5 | 16∣16 | 16∣25 | 32∣32 | 32∣36 | 36∣36 | 36∣34 | 42∣42 | 42∣48 | 55∣55 | 55∣58 | 57∣57 | 57∣64 | 61∣61 | 61∣66 | 73∣73 | 73∣82 | 80∣80 | 80∣86 | 94∣94 | 94∣120 |
| Social/Cultural/Environmental/Population Health | 3∣3 | 3∣9 | 25∣25 | 25∣38 | 47∣47 | 47∣56 | 60∣60 | 60∣69 | 84∣84 | 84∣85 | 90∣90 | 90∣91 | 91∣91 | 91∣92 | 90∣90 | 90∣90 | 82∣82 | 82∣83 | 91∣91 | 91∣92 | 108∣108 | 108∣160 |
| Not applicable/Specified | 152∣152 | 152∣168 | 157∣157 | 157∣148 | 144∣144 | 144∣155 | 161∣161 | 161∣172 | 255∣255 | 255∣199 | 195∣195 | 195∣213 | 215∣215 | 215∣201 | 210∣210 | 210∣197 | 227∣227 | 227∣248 | 252∣252 | 252∣258 | 259∣259 | 259∣269 |
| Total | $257 | $370 | $494 | $587 | $647 | $705 | $758 | $800 | $927 | $917 | $929 | $967 | $951 | $941 | $944 | $960 | $973 | $1,024 | $1,035 | $1,088 | $1,135 | $1,439 |
Figure 2: CIHR Investments by Primary Theme 2020-21 (in millions of dollars)
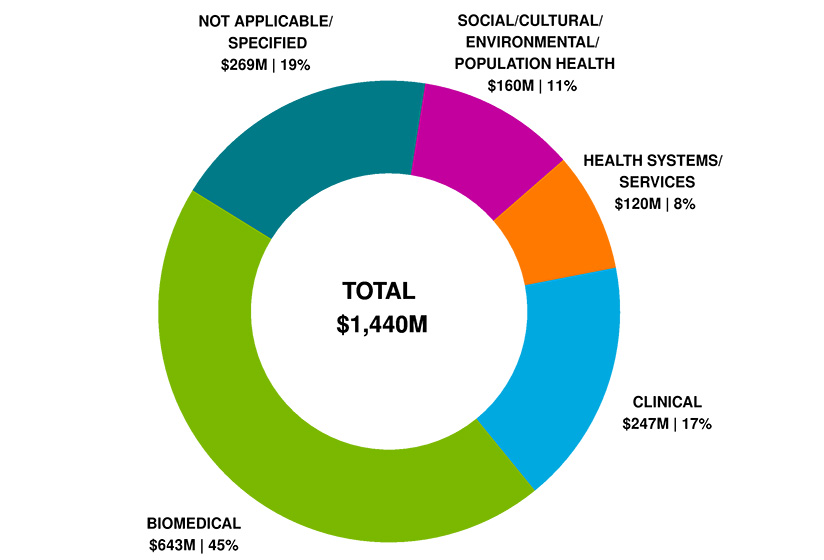
- Due to rounding, figures may not reconcile with other published information
- Excludes operating expenditures and partner contributions
- Primary theme designation is determined by the grantee at the time of application
Figure 2 long description
| Primary Theme | 2020-21 | Percentage Breakdown |
|---|---|---|
| Biomedical | $643 | 45% |
| Clinical | $247 | 17% |
| Health systems/services | $120 | 8% |
| Social/Cultural/Environmental/Population Health | $160 | 11% |
| Not applicable/Specified | $269 | 19% |
| Total | $1,440 | 100% |
Figure 2: CIHR Investments by Primary Theme and COVID-19 funding 2020-21 (in millions of dollars)
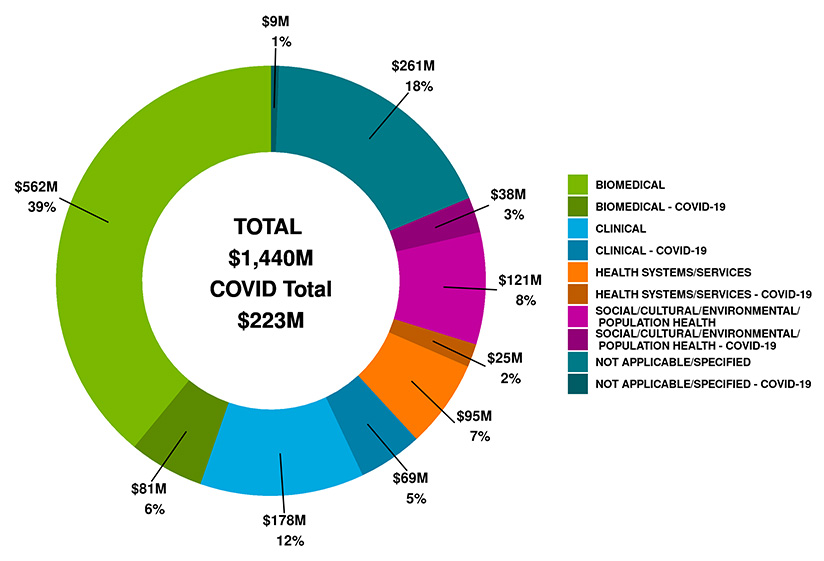
- Due to rounding, figures may not reconcile with other published information
- Excludes operating expenditures and partner contributions
- Primary theme designation is determined by the grantee at the time of application
- COVID-19 funding is determined by granting to a COVID-19-specific funding competition
Figure 2 long description
| Primary Theme | 2020-21 | Percentage Breakdown | |
|---|---|---|---|
| Biomedical | non COVID-19 | $562 | 39% |
| COVID-19 | $81 | 6% | |
| Clinical | non COVID-19 | $178 | 12% |
| COVID-19 | $69 | 5% | |
| Health systems/services | non COVID-19 | $95 | 7% |
| COVID-19 | $25 | 2% | |
| Social/Cultural/Environmental/Population Health | non COVID-19 | $121 | 8% |
| COVID-19 | $38 | 3% | |
| Not applicable/Specified | non COVID-19 | $261 | 18% |
| COVID-19 | $9 | 1% | |
| Total | $1,439 | 101% |
Figure 3: CIHR Fiscal Year Investments by Funding Type since 1999-00 (in millions of dollars)
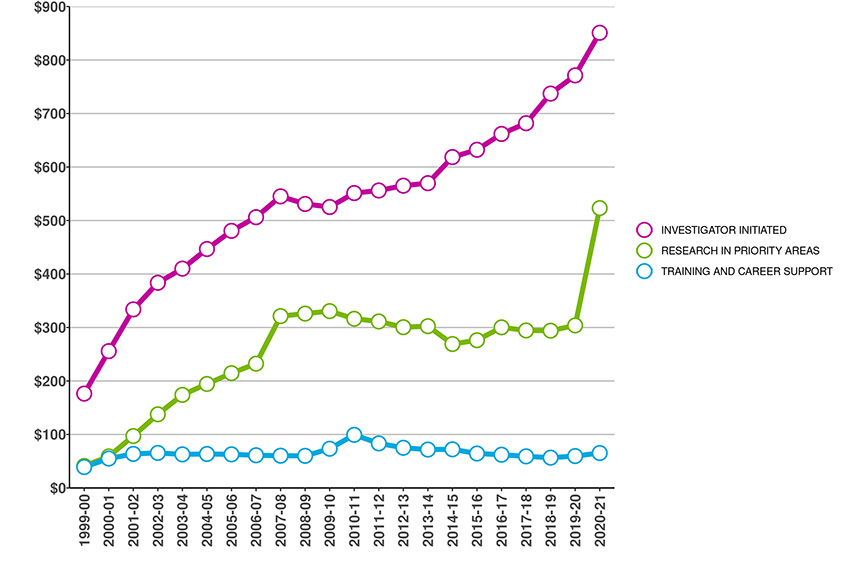
- Due to rounding, figures may not reconcile with other published information
- Excludes operating expenditures and partner contributions
Figure 3 long description
| Funding type | 1999-00 | 2000-01 | 2001-02 | 2002-03 | 2003-04 | 2004-05 | 2005-06 | 2006-07 | 2007-08 | 2008-09 | 2009-10 | 2010-11 | 2011-12 | 2012-13 | 2013-14 | 2014-15 | 2015-16 | 2016-17 | 2017-18 | 2018-19 | 2019-20 | 2020-21 |
|---|---|---|---|---|---|---|---|---|---|---|---|---|---|---|---|---|---|---|---|---|---|---|
| Investigator Initiated | 176∣176 | 176∣256 | 334∣334 | 334∣384 | 410∣410 | 410∣447 | 481∣481 | 481∣506 | 545∣545 | 545∣531 | 525∣525 | 525∣551 | 556∣556 | 556∣565 | 570∣570 | 570∣619 | 632∣632 | 632∣662 | 682∣682 | 682∣737 | 771∣771 | 771∣851 |
| Research in Priority Areas | 41∣41 | 41∣59 | 97∣97 | 97∣138 | 174∣174 | 174∣194 | 215∣215 | 215∣232 | 321∣321 | 321∣326 | 331∣331 | 331∣316 | 311∣311 | 311∣301 | 302∣302 | 302∣269 | 276∣276 | 276∣300 | 294∣294 | 294∣294 | 304∣304 | 304∣523 |
| Training and Career Support | 39∣39 | 39∣55 | 64∣64 | 64∣65 | 63∣63 | 63∣63 | 63∣63 | 63∣61 | 60∣60 | 60∣60 | 73∣73 | 73∣99 | 83∣83 | 83∣75 | 72∣72 | 72∣72 | 64∣64 | 64∣62 | 59∣59 | 59∣57 | 60∣60 | 60∣65 |
| Total | $257 | $370 | $494 | $587 | $647 | $705 | $758 | $800 | $927 | $917 | $929 | $967 | $951 | $941 | $944 | $960 | $973 | $1,024 | $1,035 | $1,088 | $1,135 | $1,439 |
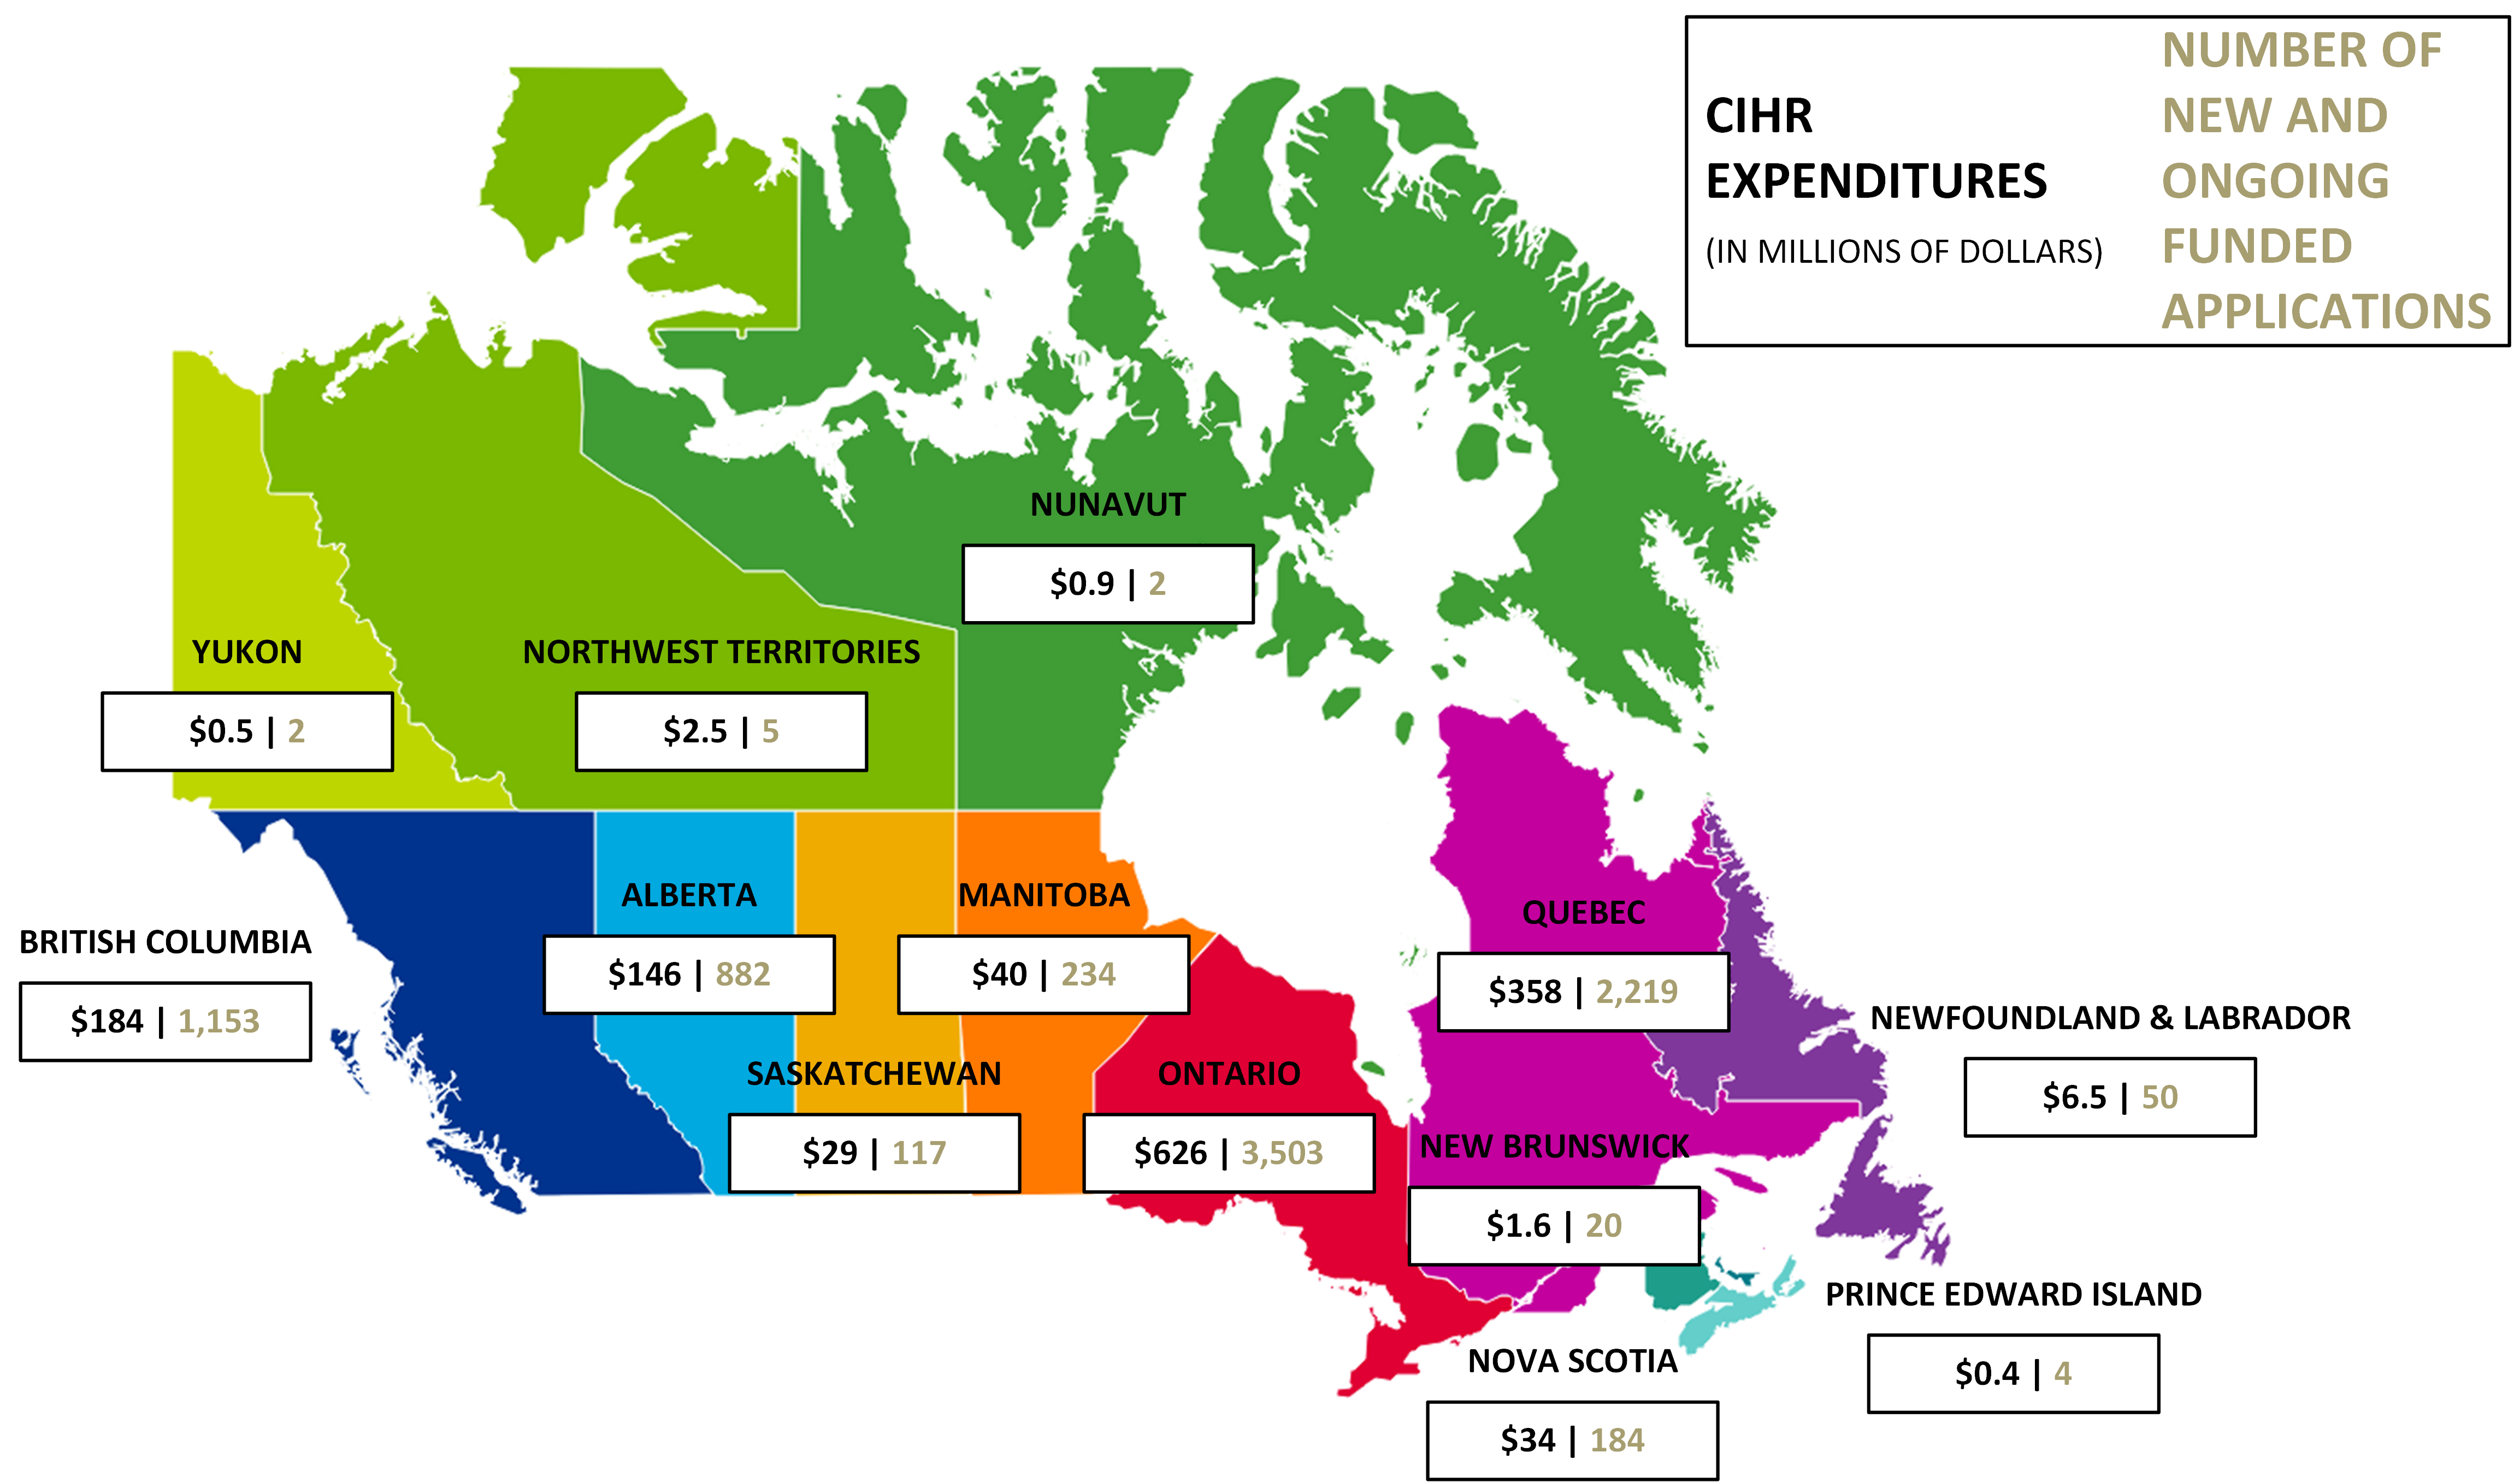
Figure 4: CIHR Investments by Region in 2020-21 (in millions of dollars)
- Due to rounding, figures may not reconcile with other published information
- Excludes operating expenditures, partner contributions and direct payments
Figure 4 long description
| Region | CIHR Expenditures 2020-21 | Number of new and ongoing funded applications 2020-21 |
|---|---|---|
| Alberta | $146 | 882 |
| British Columbia | $184 | 1,153 |
| Manitoba | $40 | 234 |
| New Brunswick | $1.6 | 20 |
| Newfoundland & Labrador | $6.5 | 50 |
| North West Territories | $2.5 | 5 |
| Nova Scotia | $34 | 184 |
| Nunavut | $0.9 | 2 |
| Ontario | $626 | 3503 |
| Prince Edward Island | $0.4 | 4 |
| Quebec | $358 | 2,219 |
| Saskatchewan | $29 | 117 |
| Yukon | $0.5 | 2 |
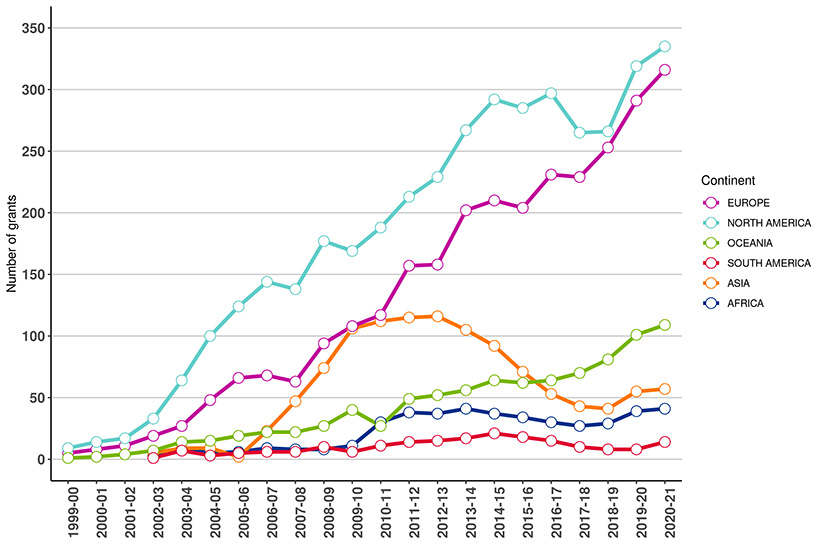
Figure 5a: Number of New and Ongoing Projects
- Due to rounding as well as changes in methodology, figures may not reconcile with other published information
- Excludes operating expenditures and partner contributions
Figure 5a long description
| Continent | 1999-00 | 2000-01 | 2001-02 | 2002-03 | 2003-04 | 2004-05 | 2005-06 | 2006-07 | 2007-08 | 2008-09 | 2009-10 | 2010-11 | 2011-12 | 2012-13 | 2013-14 | 2014-15 | 2015-16 | 2016-17 | 2017-18 | 2018-19 | 2019-20 | 2020-21 |
|---|---|---|---|---|---|---|---|---|---|---|---|---|---|---|---|---|---|---|---|---|---|---|
| Africa | 0 | 0 | 0 | 3 | 9 | 5 | 6 | 9 | 8 | 8 | 11 | 30 | 38 | 37 | 41 | 37 | 34 | 30 | 27 | 29 | 39 | 41 |
| Europe | 5 | 8 | 11 | 19 | 27 | 48 | 66 | 68 | 63 | 94 | 108 | 117 | 157 | 158 | 202 | 210 | 204 | 231 | 229 | 253 | 291 | 316 |
| North America | 9 | 14 | 17 | 33 | 64 | 100 | 124 | 144 | 138 | 177 | 169 | 188 | 213 | 229 | 267 | 292 | 285 | 297 | 265 | 266 | 319 | 335 |
| Oceania | 1 | 2 | 4 | 7 | 14 | 15 | 19 | 22 | 22 | 27 | 40 | 27 | 49 | 52 | 56 | 64 | 62 | 64 | 70 | 81 | 101 | 109 |
| Asia | 0 | 0 | 0 | 5 | 9 | 9 | 2 | 23 | 47 | 74 | 106 | 112 | 115 | 116 | 105 | 92 | 71 | 53 | 43 | 41 | 55 | 57 |
| South America | 0 | 0 | 0 | 1 | 7 | 3 | 5 | 6 | 6 | 10 | 6 | 11 | 14 | 15 | 17 | 21 | 18 | 15 | 10 | 8 | 8 | 14 |
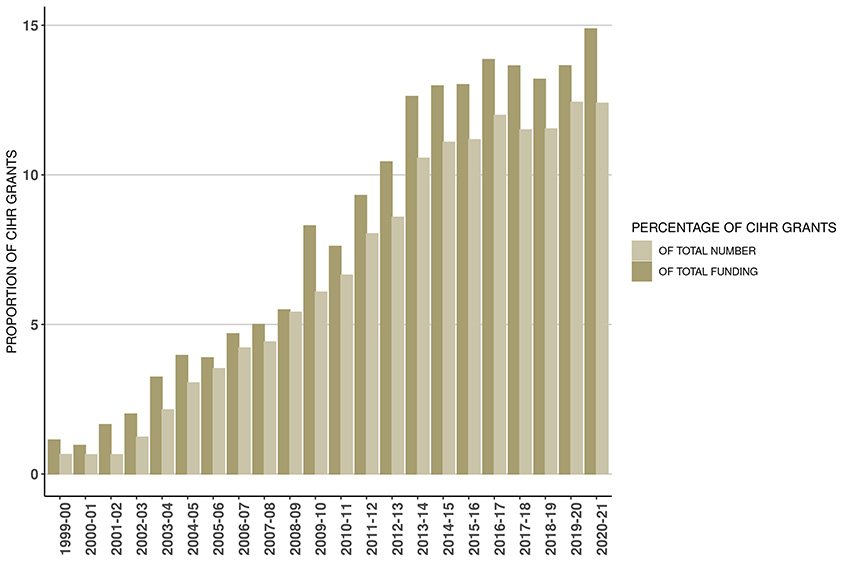
Figure 5b: Proportion of CIHR Grants with International linkages since 1999-00
- Due to rounding as well as changes in methodology, figures may not reconcile with other published information
- Excludes operating expenditures and partner contributions
Figure 5b long description
| Proportion | 1999-00 | 2000-01 | 2001-02 | 2002-03 | 2003-04 | 2004-05 | 2005-06 | 2006-07 | 2007-08 | 2008-09 | 2009-10 | 2010-11 | 2011-12 | 2012-13 | 2013-14 | 2014-15 | 2015-16 | 2016-17 | 2017-18 | 2018-19 | 2019-20 | 2020-21 |
|---|---|---|---|---|---|---|---|---|---|---|---|---|---|---|---|---|---|---|---|---|---|---|
| Percentage of total CIHR | 1.1% | 1.0% | 1.7% | 2.0% | 3.2% | 4.0% | 3.9% | 4.7% | 5.0% | 5.5% | 8.3% | 7.6% | 9.3% | 10.4% | 12.6% | 13.0% | 13.0% | 13.9% | 13.6% | 13.2% | 13.6% | 14.9% |
| Percentage of total # of CIHR grants | 0.7% | 0.6% | 0.6% | 1.2% | 2.1% | 3.0% | 3.5% | 4.2% | 4.4% | 5.4% | 6.1% | 6.6% | 8.0% | 8.6% | 10.6% | 11.1% | 11.2% | 12.0% | 11.5% | 11.5% | 12.4% | 12.4% |
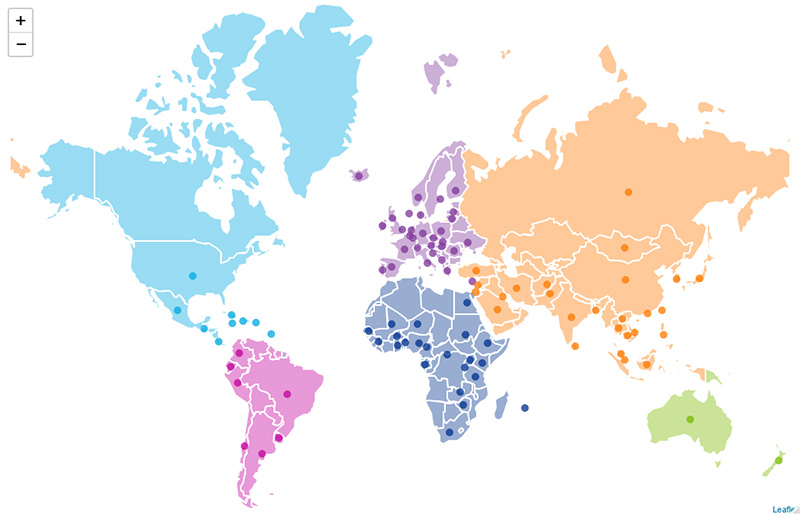
Figure 6: Countries with an International Linkage to a CIHR grants since 1999-00
- Due to changes in methodology, figures may not reconcile with other published information
Figure 6 long description
| Countries |
|---|
| Afghanistan Argentina Australia Austria Bangladesh Barbados Belgium Benin Brazil Burkina Faso Cambodia Cameroon Chile China Colombia Costa Rica Croatia Cuba Cyprus Czech Republic Democratic Republic of the Congo Denmark Ecuador Egypt England Ethiopia Finland France Gabon Germany Ghana Greece Guatemala Guinea Haiti Hong Kong Hungary Iceland India Indonesia Iran Ireland Israel Italy Jamaica Japan Kenya Kuwait Lao People's Democratic Republic Latvia Lebanon Lithuania Luxembourg Malaysia Mali Mauritius Mexico Mongolia Netherlands New Zealand Niger Nigeria Norway Pakistan Peru Philippines Poland Portugal Puerto Rico Romania Russia Rwanda Saudi Arabia Scotland Senegal Singapore Slovakia South Africa South Korea Spain Sri Lanka Sudan Sweden Switzerland Taiwan Tanzania Thailand Turkey Uganda Ukraine United Kingdom United States Uruguay Vietnam Yugoslavia Zambia Zimbabwe |
Figure 7: Leveraged Partner Funding by Sector (in millions of dollars) – Cumulative totals from 1999-00 to 2020-21
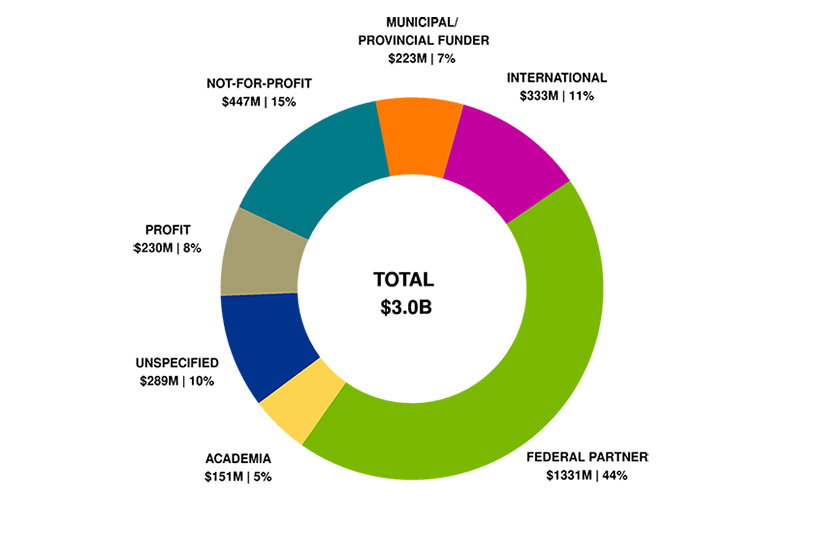
- Due to rounding, figures may not reconcile with other published information
- Includes partner contributions administered by CIHR, in kind and direct contributions from partner directly to the researcher
- Includes both competition and applicant partner contributions where there may or may not be a formal agreement with CIHR
Figure 7 long description
| Sector | Total | Percentage |
|---|---|---|
| Academia | $151 | 5% |
| Federal partners | $1,331 | 44% |
| International | $333 | 11% |
| Municipal/Provincial funder | $223 | 7% |
| Not-for-profit | $447 | 15% |
| Profit | $230 | 8% |
| Unspecified | $289 | 10% |
| Total | $3,003 | 100% |
Figure 8: Leveraged Partner Funding by Sector (in millions of dollars) – 2020-21
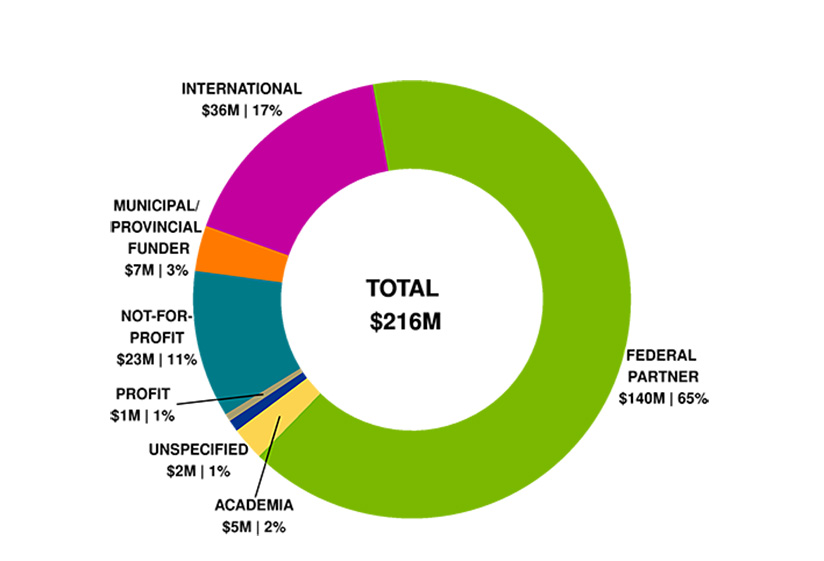
- Due to rounding, figures may not reconcile with other published information
- Includes partner contributions administered by CIHR, in kind and direct contributions from partner directly to the researcher
- Includes both competition and applicant partner contributions where there may or may not be a formal agreement with CIHR
Figure 8 long description
| Sector | Total | Percentage |
|---|---|---|
| Academia | $5 | 2% |
| Federal partner | $140 | 65% |
| International | $36 | 17% |
| Municipal/Provincial funder | $7 | 3% |
| Not-for-profit | $23 | 11% |
| Profit | $1 | 1% |
| Unspecified | $2 | 1% |
| Total | $216 | 100% |
2019-2020
Figure 1: CIHR Fiscal Year Investments by Primary Theme since 1999-00 (in millions of dollars)
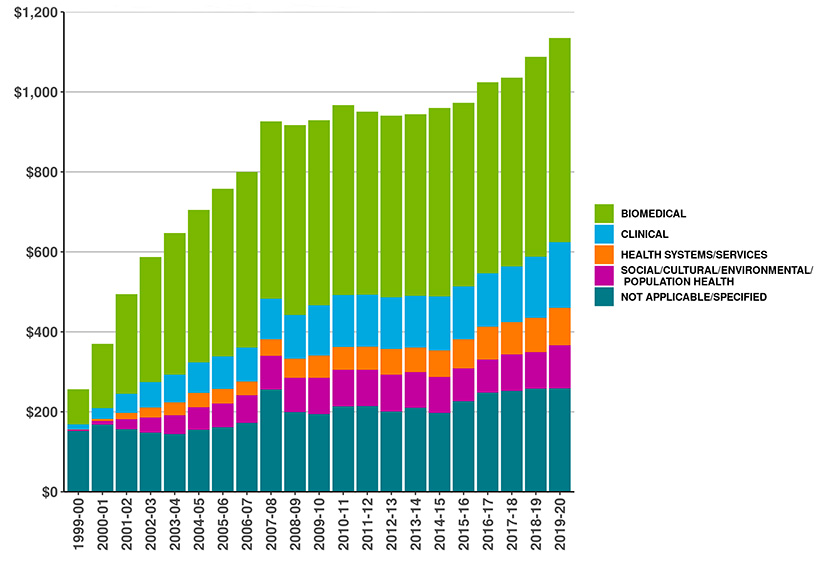
- Due to rounding, figures may not reconcile with other published information
- Excludes operating expenditures and partner contributions
- Primary theme designation is determined by the grantee at the time of application
Figure 1 long description
| Primary theme | 1999-00 | 2000-01 | 2001-02 | 2002-03 | 2003-04 | 2004-05 | 2005-06 | 2006-07 | 2007-08 | 2008-09 | 2009-10 | 2010-11 | 2011-12 | 2012-13 | 2013-14 | 2014-15 | 2015-16 | 2016-17 | 2017-18 | 2018-19 | 2019-20 |
|---|---|---|---|---|---|---|---|---|---|---|---|---|---|---|---|---|---|---|---|---|---|
| Biomedical | 88∣88 | 88∣160 | 250∣250 | 250∣312 | 354∣354 | 354∣381 | 419∣419 | 419∣439 | 444∣444 | 444∣474 | 463∣463 | 463∣475 | 458∣458 | 458∣455 | 454∣454 | 454∣471 | 459∣459 | 459∣478 | 472∣472 | 472∣500 | $510 |
| Clinical | 13∣13 | 13∣27 | 47∣47 | 47∣64 | 69∣69 | 69∣77 | 82∣82 | 82∣85 | 101∣101 | 101∣110 | 126∣126 | 126∣129 | 130∣130 | 130∣129 | 130∣130 | 130∣134 | 132∣132 | 132∣133 | 140∣140 | 140∣153 | $164 |
| Health systems/services | 0.7∣0.7 | 0.7∣5 | 16∣16 | 16∣25 | 32∣32 | 32∣36 | 36∣36 | 36∣34 | 42∣42 | 42∣48 | 55∣55 | 55∣58 | 57∣57 | 57∣64 | 61∣61 | 61∣66 | 73∣73 | 73∣82 | 80∣80 | 80∣86 | $94 |
| Social/Cultural/Environmental/Population Health | 3∣3 | 3∣9 | 25∣25 | 25∣38 | 47∣47 | 47∣56 | 60∣60 | 60∣69 | 84∣84 | 84∣85 | 90∣90 | 90∣91 | 91∣91 | 91∣92 | 90∣90 | 90∣90 | 82∣82 | 82∣83 | 91∣91 | 91∣92 | $108 |
| Not applicable/Specified | 152∣152 | 152∣168 | 157∣157 | 157∣148 | 144∣144 | 144∣155 | 161∣161 | 161∣172 | 255∣255 | 255∣199 | 195∣195 | 195∣213 | 215∣215 | 215∣201 | 210∣210 | 210∣197 | 227∣227 | 227∣248 | 252∣252 | 252∣258 | $259 |
| Total | $257 | $370 | $494 | $587 | $647 | $705 | $758 | $800 | $927 | $917 | $929 | $967 | $951 | $941 | $944 | $960 | $973 | $1,024 | $1,035 | $1,088 | $1,135 |
Figure 2: CIHR Investments by Primary Theme 2019-20 (in millions of dollars)
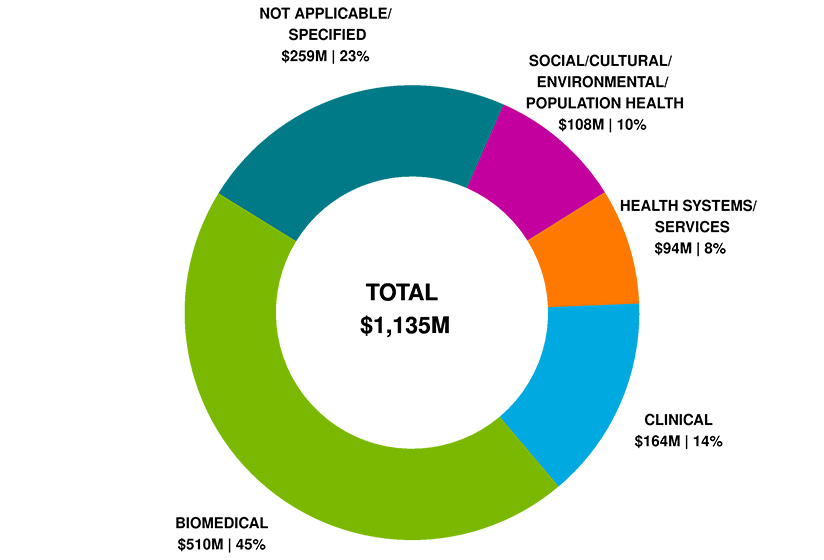
- Due to rounding, figures may not reconcile with other published information
- Excludes operating expenditures and partner contributions
- Primary theme designation is determined by the grantee at the time of the application
Figure 2 long description
| Primary Theme | 2019-20 | Percentage Breakdown |
|---|---|---|
| Biomedical | $510 | 45% |
| Clinical | $164 | 14% |
| Health systems/services | $94 | 8% |
| Social/Cultural/Environmental/Population Health | $108 | 10% |
| Not applicable/Specified | $259 | 23% |
| Total | $1,135 | 100% |
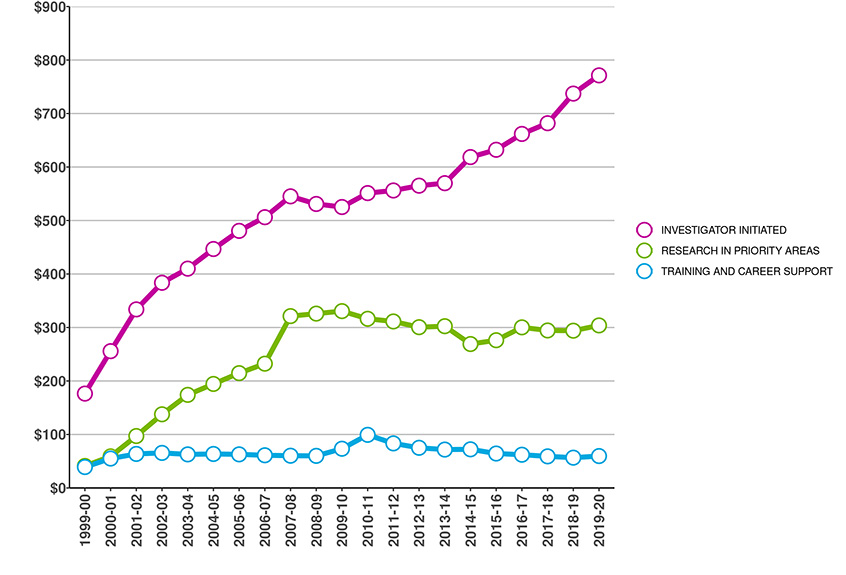
Figure 3: CIHR Fiscal Year Investments by Funding Type since 1999-00 (in millions of dollars)
- Due to rounding, figures may not reconcile with other published information
- Excludes operating expenditures and partner contributions
Figure 3 long description
| Funding type | 1999-00 | 2000-01 | 2001-02 | 2002-03 | 2003-04 | 2004-05 | 2005-06 | 2006-07 | 2007-08 | 2008-09 | 2009-10 | 2010-11 | 2011-12 | 2012-13 | 2013-14 | 2014-15 | 2015-16 | 2016-17 | 2017-18 | 2018-19 | 2019-20 |
|---|---|---|---|---|---|---|---|---|---|---|---|---|---|---|---|---|---|---|---|---|---|
| Investigator Initiated | 176∣176 | 176∣256 | 334∣334 | 334∣384 | 410∣410 | 410∣447 | 481∣481 | 481∣506 | 545∣545 | 545∣531 | 525∣525 | 525∣551 | 556∣556 | 556∣565 | 570∣570 | 570∣619 | 632∣632 | 632∣662 | 682∣682 | 682∣737 | $771 |
| Research in Priority Areas | 41∣41 | 41∣59 | 97∣97 | 97∣138 | 174∣174 | 174∣194 | 215∣215 | 215∣232 | 321∣321 | 321∣326 | 331∣331 | 331∣316 | 311∣311 | 311∣301 | 302∣302 | 302∣269 | 276∣276 | 276∣300 | 294∣294 | 294∣294 | $304 |
| Training and Career Support | 39∣39 | 39∣55 | 64∣64 | 64∣65 | 63∣63 | 63∣63 | 63∣63 | 63∣61 | 60∣60 | 60∣60 | 73∣73 | 73∣99 | 83∣83 | 83∣75 | 72∣72 | 72∣72 | 64∣64 | 64∣62 | 59∣59 | 59∣57 | $60 |
| Total | $257 | $370 | $494 | $587 | $647 | $705 | $758 | $800 | $927 | $917 | $929 | $967 | $951 | $941 | $944 | $960 | $973 | $1,024 | $1,035 | $1,088 | $1,135 |
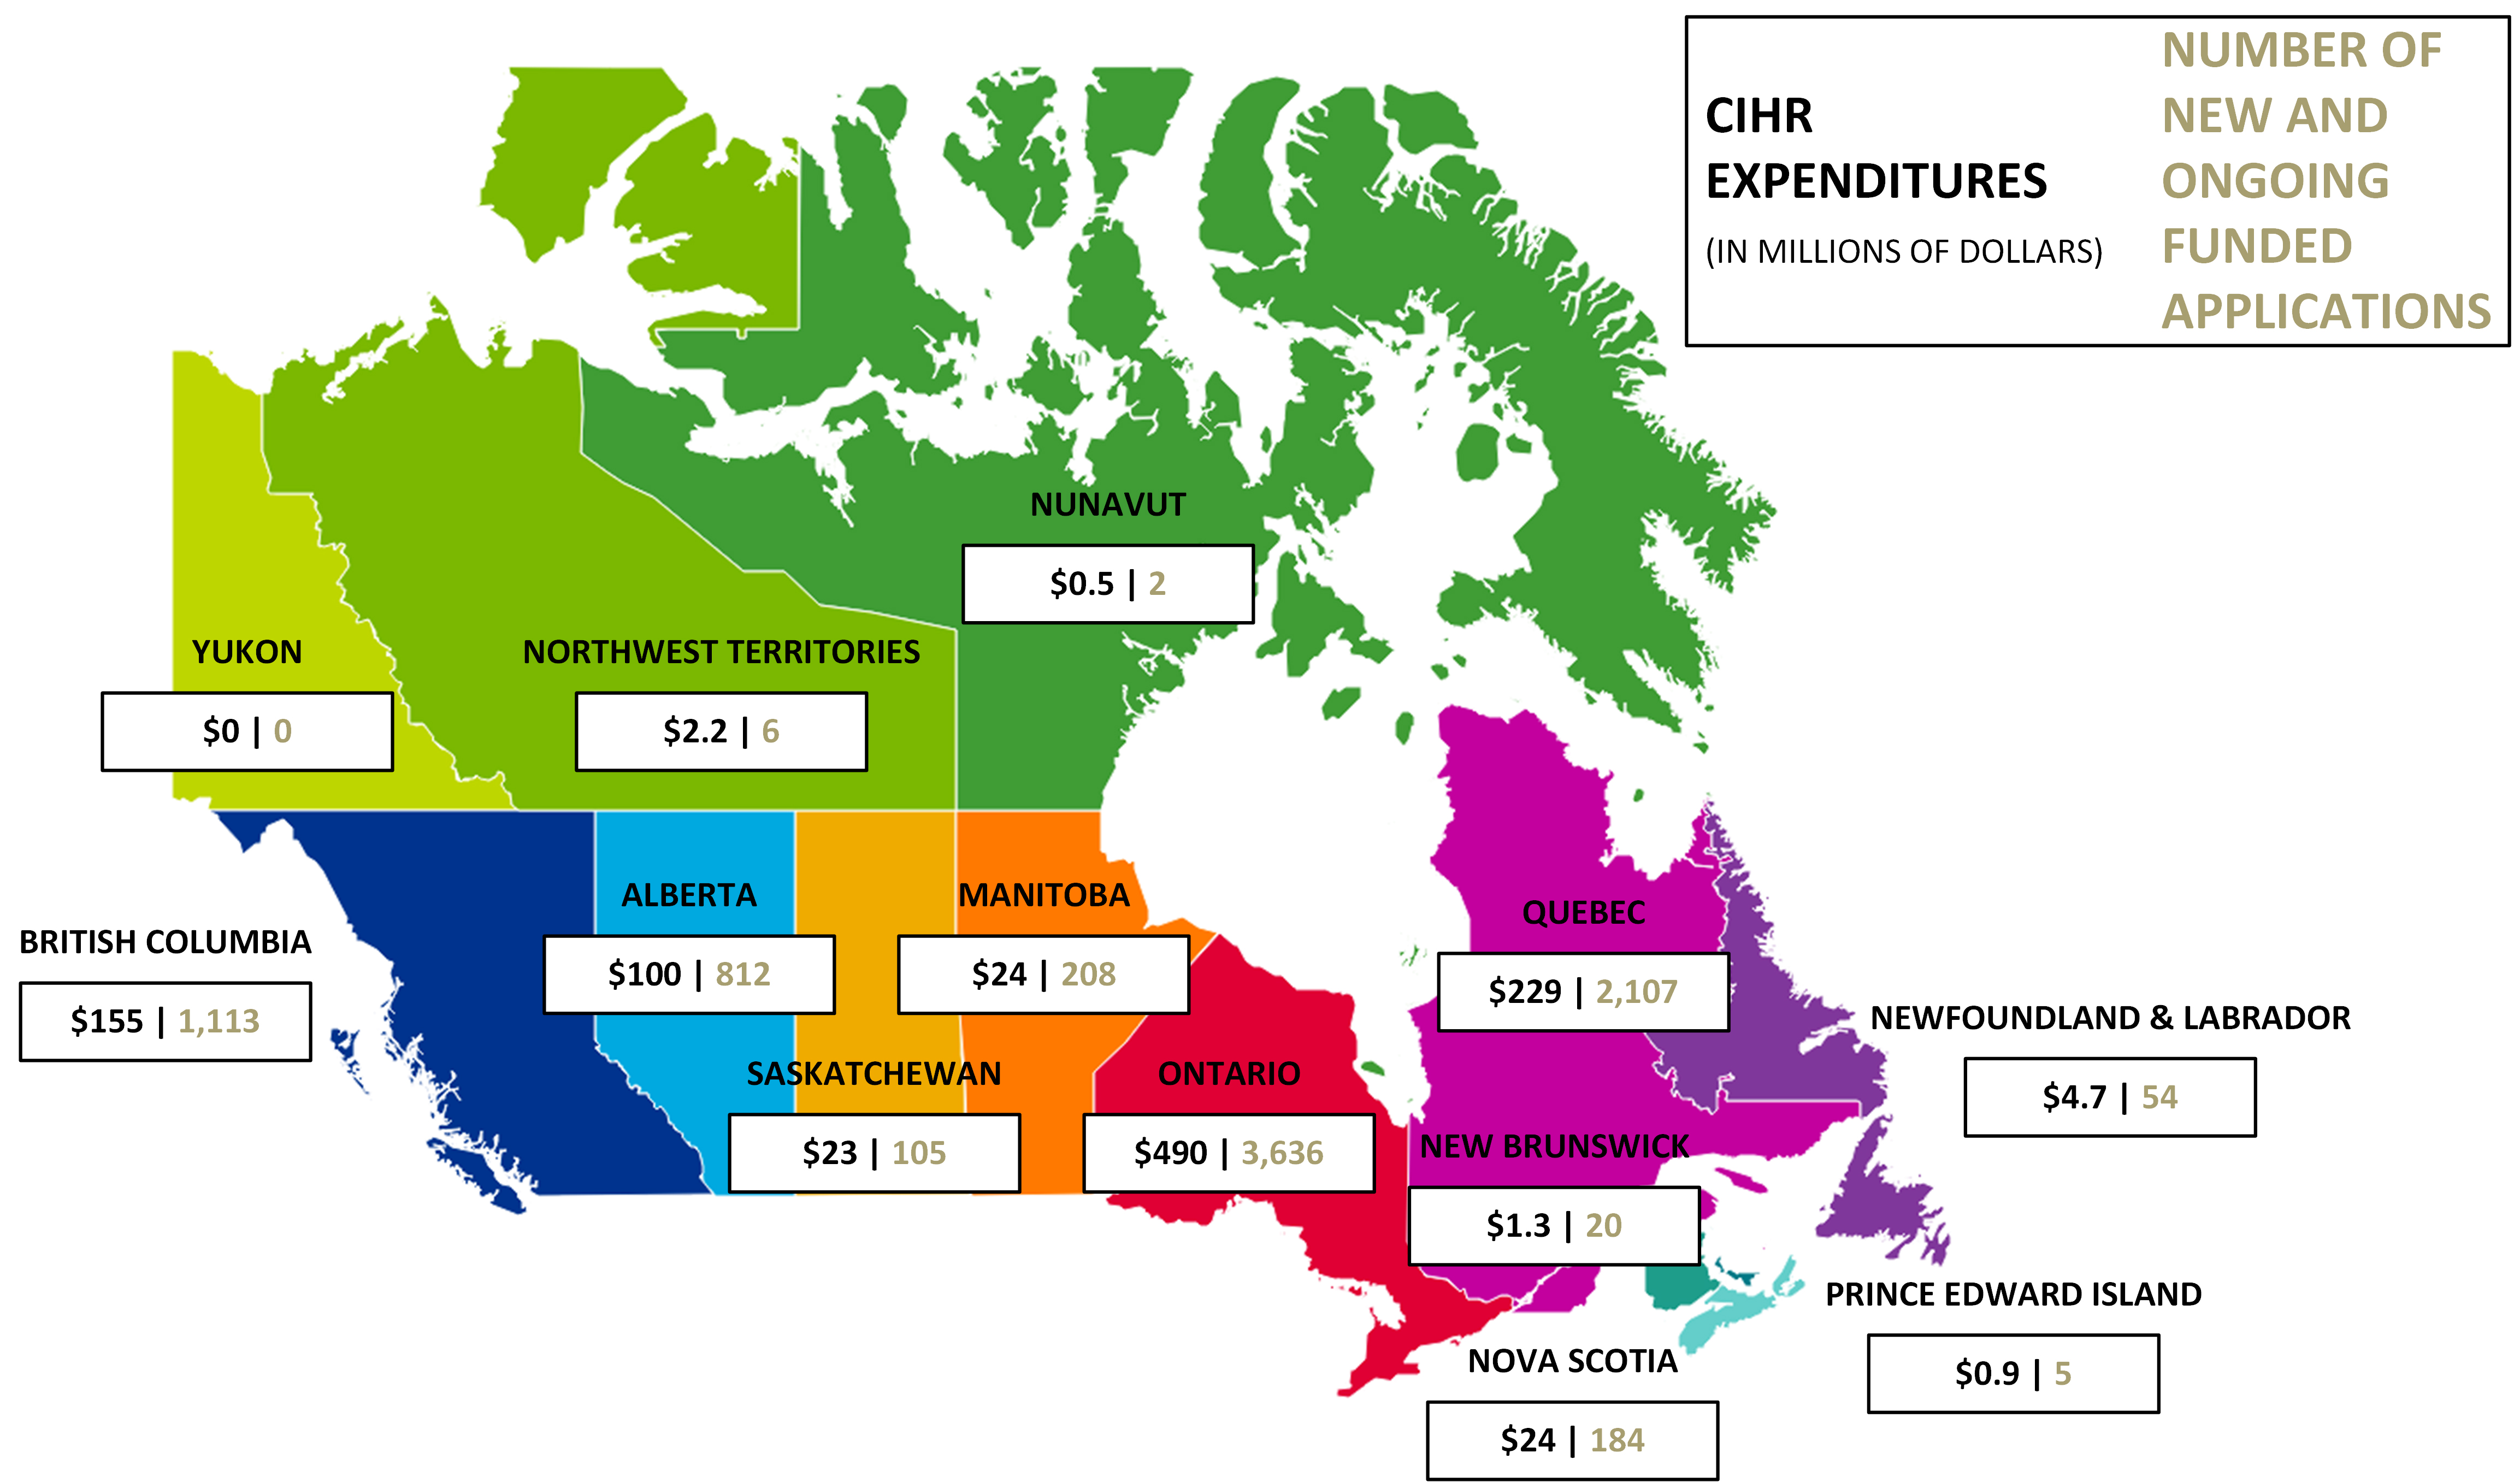
Figure 4: CIHR Investments by Region in 2019-20 (in millions of dollars)
- Due to rounding, figures may not reconcile with other published information
- Excludes operating expenditures, partner contributions and direct payments
Figure 4 long description
| Region | CIHR Expenditures 2019-20 | Number of new and ongoing funded applications 2019-20 |
|---|---|---|
| Alberta | $100 | 812 |
| British Columbia | $155 | 1113 |
| Manitoba | $24 | 208 |
| New Brunswick | $1.3 | 20 |
| Newfoundland & Labrador | $4.7 | 54 |
| North West Territories | $2.2 | 6 |
| Nova Scotia | $24 | 184 |
| Nunavut | $0.5 | 2 |
| Ontario | $490 | 3636 |
| Prince Edward Island | $0.9 | 5 |
| Quebec | $229 | 2107 |
| Saskatchewan | $23 | 105 |
| Yukon | $0 | 0 |
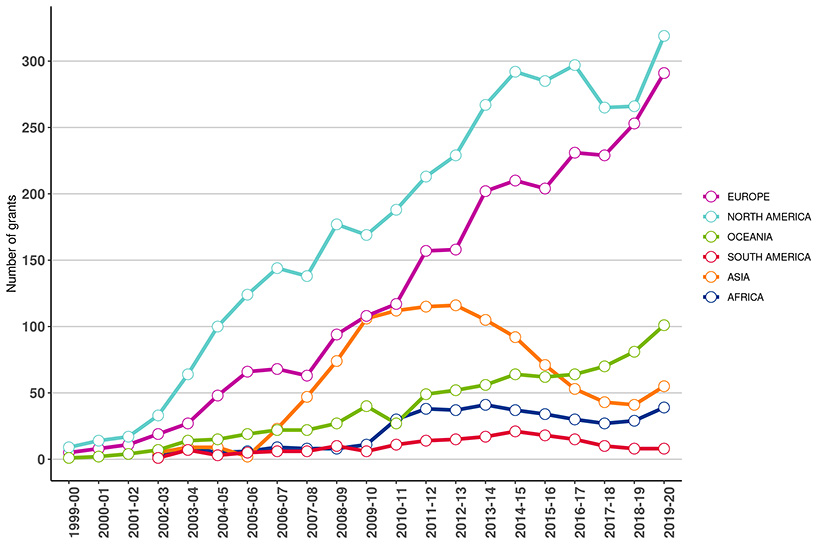
Figure 5a: Number of New and Ongoing Projects
- Due to rounding as well as changes in methodology, figures may not reconcile with other published information
- Excludes operating expenditures and partner contributions
Figure 5a long description
| Continent | 1999-00 | 2000-01 | 2001-02 | 2002-03 | 2003-04 | 2004-05 | 2005-06 | 2006-07 | 2007-08 | 2008-09 | 2009-10 | 2010-11 | 2011-12 | 2012-13 | 2013-14 | 2014-15 | 2015-16 | 2016-17 | 2017-18 | 2018-19 | 2019-20 |
|---|---|---|---|---|---|---|---|---|---|---|---|---|---|---|---|---|---|---|---|---|---|
| Africa | 0 | 0 | 0 | 3 | 9 | 5 | 6 | 9 | 8 | 8 | 11 | 30 | 38 | 37 | 41 | 37 | 34 | 30 | 27 | 29 | 39 |
| Europe | 5 | 8 | 11 | 19 | 27 | 48 | 66 | 68 | 63 | 94 | 108 | 117 | 157 | 158 | 202 | 210 | 204 | 231 | 229 | 253 | 291 |
| North America | 9 | 14 | 17 | 33 | 64 | 100 | 124 | 144 | 138 | 177 | 169 | 188 | 213 | 229 | 267 | 292 | 285 | 297 | 265 | 266 | 319 |
| Oceania | 1 | 2 | 4 | 7 | 14 | 15 | 19 | 22 | 22 | 27 | 40 | 27 | 49 | 52 | 56 | 64 | 62 | 64 | 70 | 81 | 101 |
| Asia | 0 | 0 | 0 | 5 | 9 | 9 | 2 | 23 | 47 | 74 | 106 | 112 | 115 | 116 | 105 | 92 | 71 | 53 | 43 | 41 | 55 |
| South America | 0 | 0 | 0 | 1 | 7 | 3 | 5 | 6 | 6 | 10 | 6 | 11 | 14 | 15 | 17 | 21 | 18 | 15 | 10 | 8 | 8 |
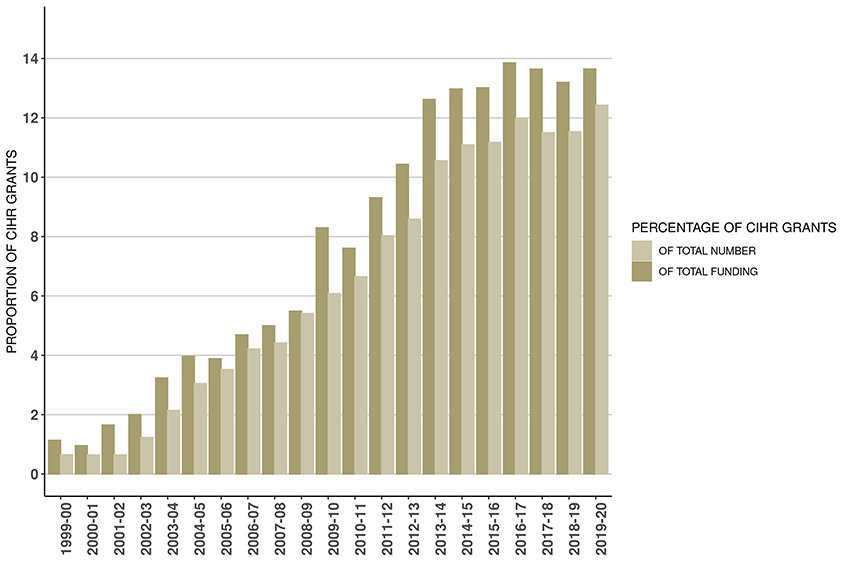
Figure 5b: Proportion of CIHR Grants with International linkages since 1999-00
- Due to rounding as well as changes in methodology, figures may not reconcile with other published information
- Excludes operating expenditures and partner contributions
Figure 5b long description
| Proportion | 1999-00 | 2000-01 | 2001-02 | 2002-03 | 2003-04 | 2004-05 | 2005-06 | 2006-07 | 2007-08 | 2008-09 | 2009-10 | 2010-11 | 2011-12 | 2012-13 | 2013-14 | 2014-15 | 2015-16 | 2016-17 | 2017-18 | 2018-19 | 2019-20 |
|---|---|---|---|---|---|---|---|---|---|---|---|---|---|---|---|---|---|---|---|---|---|
| Percentage of total CIHR | 1.1% | 1.0% | 1.7% | 2.0% | 3.2% | 4.0% | 3.9% | 4.7% | 5.0% | 5.5% | 8.3% | 7.6% | 9.3% | 10.4% | 12.6% | 13.0% | 13.0% | 13.9% | 13.6% | 13.2% | 13.6% |
| Percentage of total # of CIHR grants | 0.7% | 0.6% | 0.6% | 1.2% | 2.1% | 3.0% | 3.5% | 4.2% | 4.4% | 5.4% | 6.1% | 6.6% | 8.0% | 8.6% | 10.6% | 11.1% | 11.2% | 12.0% | 11.5% | 11.5% | 12.4% |
Figure 6: Countries with an International Linkage to a CIHR grants since 1999-00
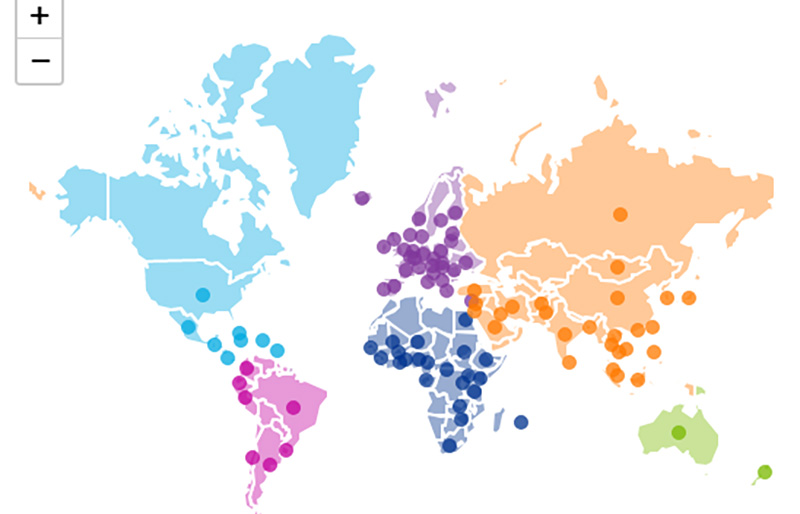
- Due to changes in methodology, figures may not reconcile with other published information
Figure 6 long description
| Countries |
|---|
| Afghanistan Argentina Australia Austria Bangladesh Barbados Belgium Benin Brazil Burkina Faso Cambodia Cameroon Chile China Colombia Costa Rica Croatia Cuba Cyprus Czech Republic Democratic Republic of the Congo Denmark Ecuador Egypt England Ethiopia Finland France Gabon Germany Ghana Greece Guatemala Guinea Haiti Hong Kong Hungary Iceland India Indonesia Iran Ireland Israel Italy Jamaica Japan Kenya Kuwait Lao People's Democratic Republic Latvia Lebanon Lithuania Luxembourg Malaysia Mali Mauritius Mexico Mongolia Netherlands New Zealand Niger Nigeria Norway Pakistan Peru Philippines Poland Portugal Puerto Rico Romania Russia Rwanda Saudi Arabia Scotland Senegal Singapore Slovakia South Africa South Korea Spain Sri Lanka Sudan Sweden Switzerland Taiwan Tanzania Thailand Turkey Uganda Ukraine United Kingdom United States Uruguay Vietnam Yugoslavia Zambia Zimbabwe |
Figure 7: Leveraged Partner Funding by Sector (in millions of dollars) – Cumulative totals from 1999-00 to 2019-20
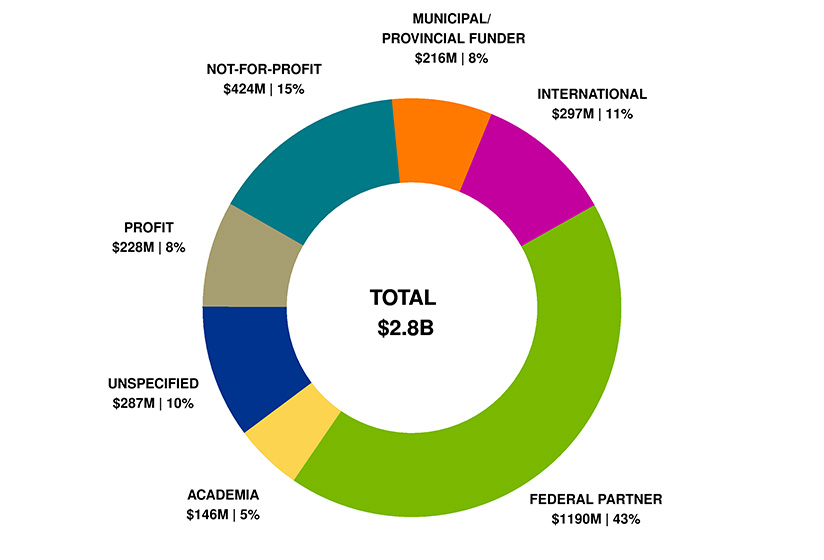
- Due to rounding, figures may not reconcile with other published information
- Includes partner contributions administered by CIHR, in kind and direct contributions from partner directly to the researcher
- Includes both competition and applicant partner contributions where there may or may not be a formal agreement with CIHR
Figure 7 long description
| Sector | Total | Percentage |
|---|---|---|
| Academia | $146 | 5% |
| Federal partners | $1,190 | 43% |
| International | $297 | 11% |
| Municipal/Provincial funder | $216 | 8% |
| Not-for-profit | $424 | 15% |
| Profit | $228 | 8% |
| Unspecified | $287 | 10% |
| Total | $2,788 | 100% |
Figure 8: Leveraged Partner Funding by Sector (in millions of dollars) – 2019-20
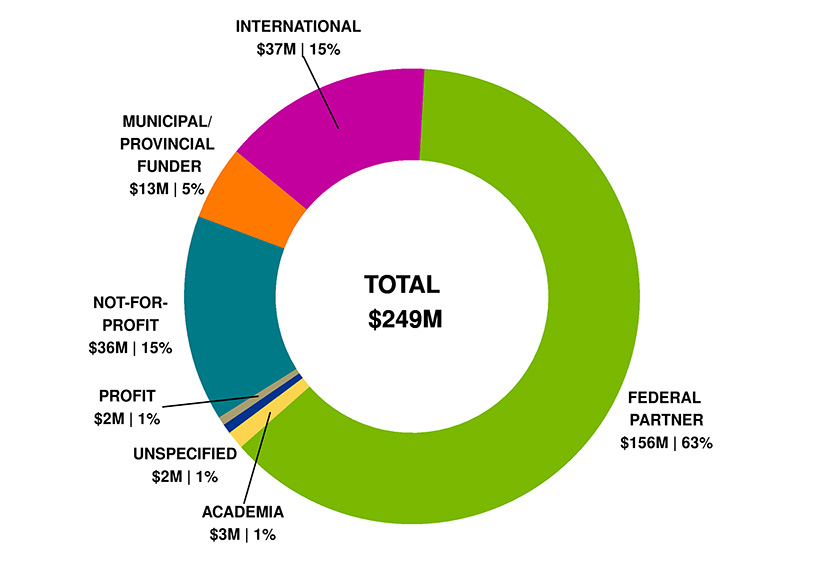
- Due to rounding, figures may not reconcile with other published information
- Includes partner contributions administered by CIHR, in kind and direct contributions from partner directly to the researcher
- Includes both competition and applicant partner contributions where there may or may not be a formal agreement with CIHR
Figure 8 long description
| Sector | Total | Percentage |
|---|---|---|
| Academia | $3 | 1% |
| Federal partner | $156 | 63% |
| International | $37 | 15% |
| Municipal/Provincial funder | $13 | 3% |
| Not-for-profit | $36 | 15% |
| Profit | $2 | 1% |
| Unspecified | $2 | 1% |
| Total | $249 | 100% |
2018-2019
Figure 1: CIHR Fiscal Year Investments by Primary Theme since 1999-00 (in millions of dollars)
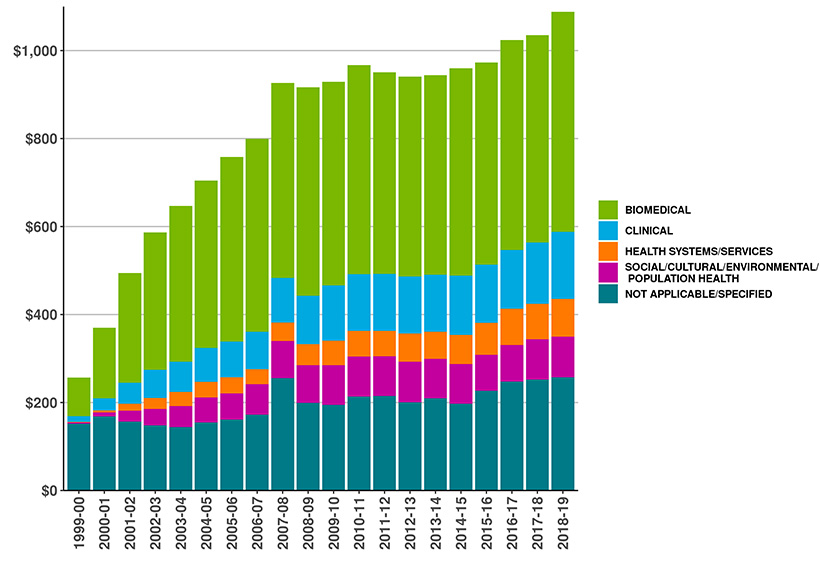
- Due to rounding, figures may not reconcile with other published information
- Excludes operating expenditures and partner contributions
- Primary theme designation is determined by the grantee at the time of application
Figure 1 long description
| Primary theme | 1999-00 | 2000-01 | 2001-02 | 2002-03 | 2003-04 | 2004-05 | 2005-06 | 2006-07 | 2007-08 | 2008-09 | 2009-10 | 2010-11 | 2011-12 | 2012-13 | 2013-14 | 2014-15 | 2015-16 | 2016-17 | 2017-18 | 2018-19 |
|---|---|---|---|---|---|---|---|---|---|---|---|---|---|---|---|---|---|---|---|---|
| Biomedical | 88∣88 | 88∣160 | 250∣250 | 250∣312 | 354∣354 | 354∣381 | 419∣419 | 419∣439 | 444∣444 | 444∣474 | 463∣463 | 463∣475 | 458∣458 | 458∣455 | 454∣454 | 454∣471 | 459∣459 | 459∣478 | 472∣472 | 472∣500 |
| Clinical | 13∣13 | 13∣27 | 47∣47 | 47∣64 | 69∣69 | 69∣77 | 82∣82 | 82∣85 | 101∣101 | 101∣110 | 126∣126 | 126∣129 | 130∣130 | 130∣129 | 130∣130 | 130∣134 | 132∣132 | 132∣133 | 140∣140 | 140∣153 |
| Health systems/services | 0.7∣0.7 | 0.7∣5 | 16∣16 | 16∣25 | 32∣32 | 32∣36 | 36∣36 | 36∣34 | 42∣42 | 42∣48 | 55∣55 | 55∣58 | 57∣57 | 57∣64 | 61∣61 | 61∣66 | 73∣73 | 73∣82 | 80∣80 | 80∣86 |
| Social/Cultural/Environmental/Population Health | 3∣3 | 3∣9 | 25∣25 | 25∣38 | 47∣47 | 47∣56 | 60∣60 | 60∣69 | 84∣84 | 84∣85 | 90∣90 | 90∣91 | 91∣91 | 91∣92 | 90∣90 | 90∣90 | 82∣82 | 82∣83 | 91∣91 | 91∣92 |
| Not applicable/Specified | 152∣152 | 152∣168 | 157∣157 | 157∣148 | 144∣144 | 144∣155 | 161∣161 | 161∣172 | 255∣255 | 255∣199 | 195∣195 | 195∣213 | 215∣215 | 215∣201 | 210∣210 | 210∣197 | 227∣227 | 227∣248 | 252∣252 | 252∣258 |
| Total | $257 | $370 | $494 | $587 | $647 | $705 | $758 | $800 | $927 | $917 | $929 | $967 | $951 | $941 | $944 | $960 | $973 | $1,024 | $1,035 | $1,088 |
Figure 2: CIHR Investments by Primary Theme 2018-19 (in millions of dollars)
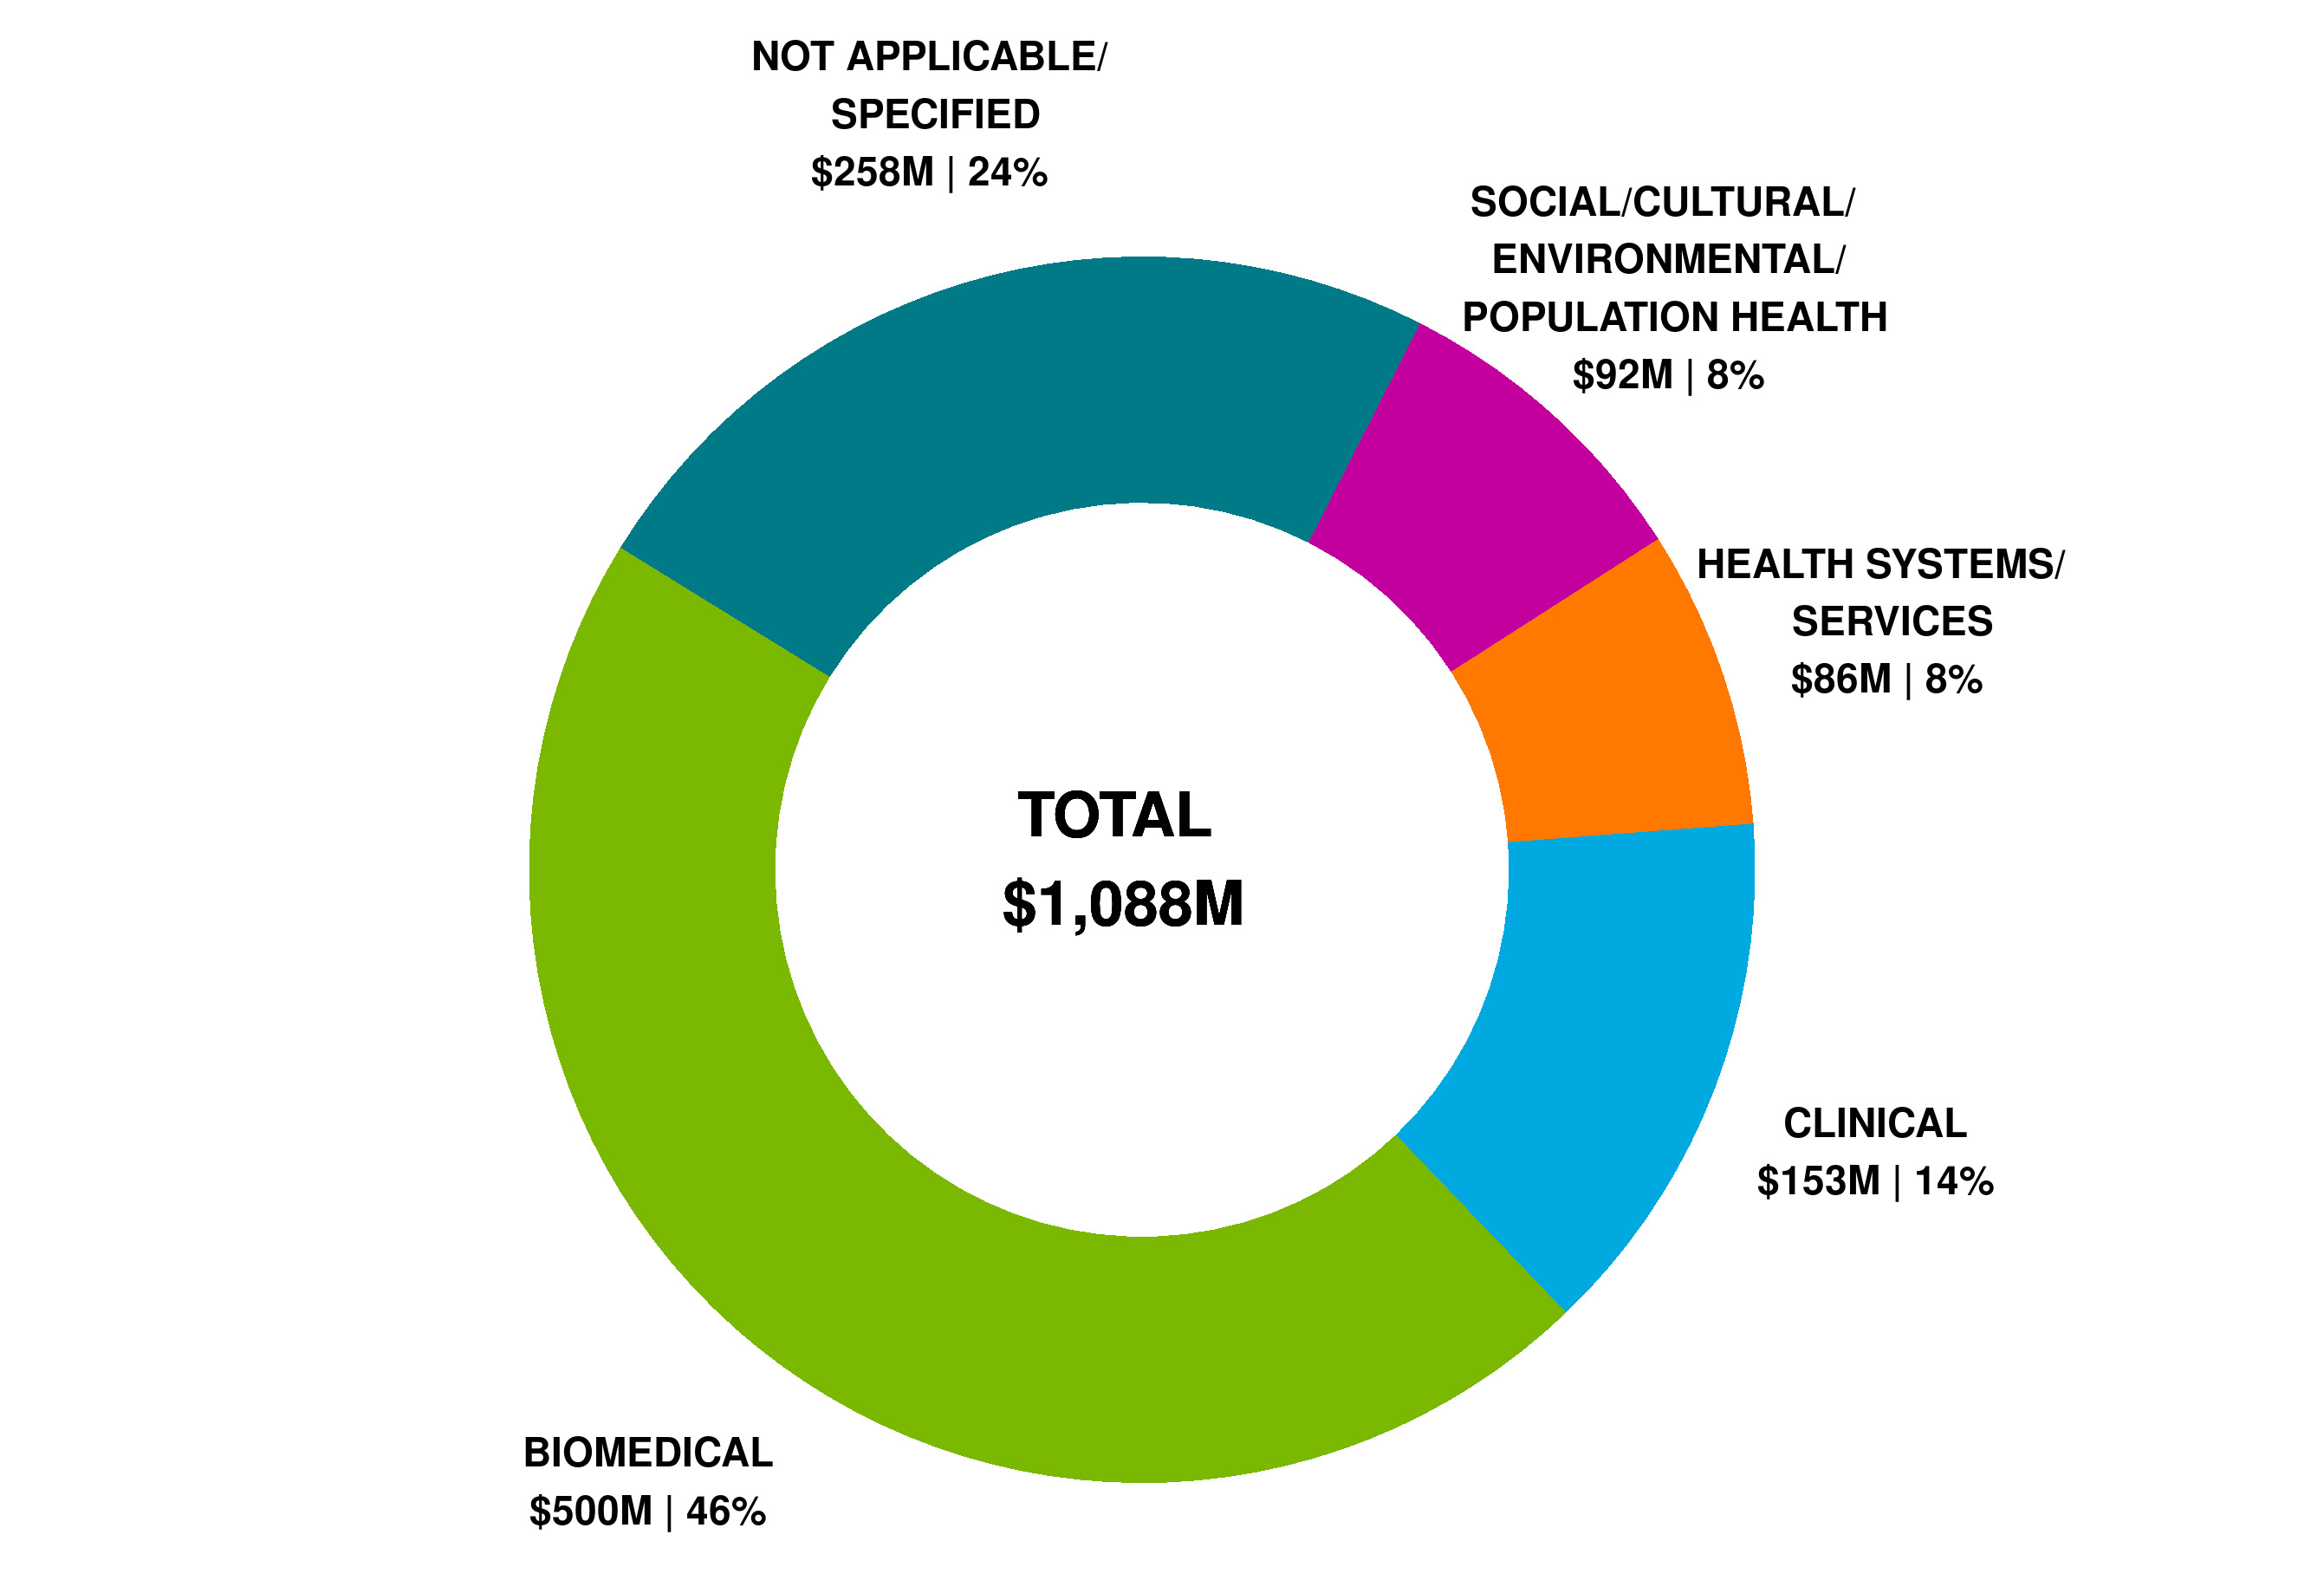
- Due to rounding, figures may not reconcile with other published information
- Excludes operating expenditures and partner contributions
- Primary theme designation is determined by the grantee at the time of the application
Figure 2 long description
| Primary Theme | 2018-19 | Percentage Breakdown |
|---|---|---|
| Biomedical | $500 | 46% |
| Clinical | $153 | 14% |
| Health systems/services | $86 | 8% |
| Social/Cultural/Environmental/Population Health | $92 | 8% |
| Not applicable/Specified | $258 | 24% |
| Total | $1,088 | 100% |
Figure 3: CIHR Fiscal Year Investments by Funding Type since 1999-00 (in millions of dollars)
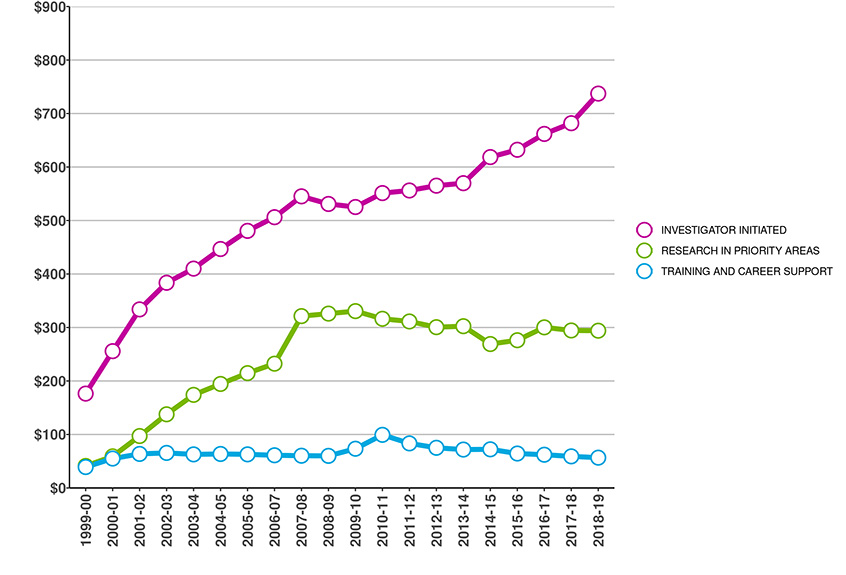
- Due to rounding, figures may not reconcile with other published information
- Excludes operating expenditures and partner contributions
Figure 3 long description
| Funding type | 1999-00 | 2000-01 | 2001-02 | 2002-03 | 2003-04 | 2004-05 | 2005-06 | 2006-07 | 2007-08 | 2008-09 | 2009-10 | 2010-11 | 2011-12 | 2012-13 | 2013-14 | 2014-15 | 2015-16 | 2016-17 | 2017-18 | 2018-19 |
|---|---|---|---|---|---|---|---|---|---|---|---|---|---|---|---|---|---|---|---|---|
| Investigator Initiated | 176∣176 | 176∣256 | 334∣334 | 334∣384 | 410∣410 | 410∣447 | 481∣481 | 481∣506 | 545∣545 | 545∣531 | 525∣525 | 525∣551 | 556∣556 | 556∣565 | 570∣570 | 570∣619 | 632∣632 | 632∣662 | 682∣682 | 682∣737 |
| Research in Priority Areas | 41∣41 | 41∣59 | 97∣97 | 97∣138 | 174∣174 | 174∣194 | 215∣215 | 215∣232 | 321∣321 | 321∣326 | 331∣331 | 331∣316 | 311∣311 | 311∣301 | 302∣302 | 302∣269 | 276∣276 | 276∣300 | 294∣294 | 294∣294 |
| Training and Career Support | 39∣39 | 39∣55 | 64∣64 | 64∣65 | 63∣63 | 63∣63 | 63∣63 | 63∣61 | 60∣60 | 60∣60 | 73∣73 | 73∣99 | 83∣83 | 83∣75 | 72∣72 | 72∣72 | 64∣64 | 64∣62 | 59∣59 | 59∣57 |
| Total | $257 | $370 | $494 | $587 | $647 | $705 | $758 | $800 | $927 | $917 | $929 | $967 | $951 | $941 | $944 | $960 | $973 | $1,024 | $1,035 | $1,088 |
Figure 4: CIHR Investments by Region in 2018-19 (in millions of dollars)
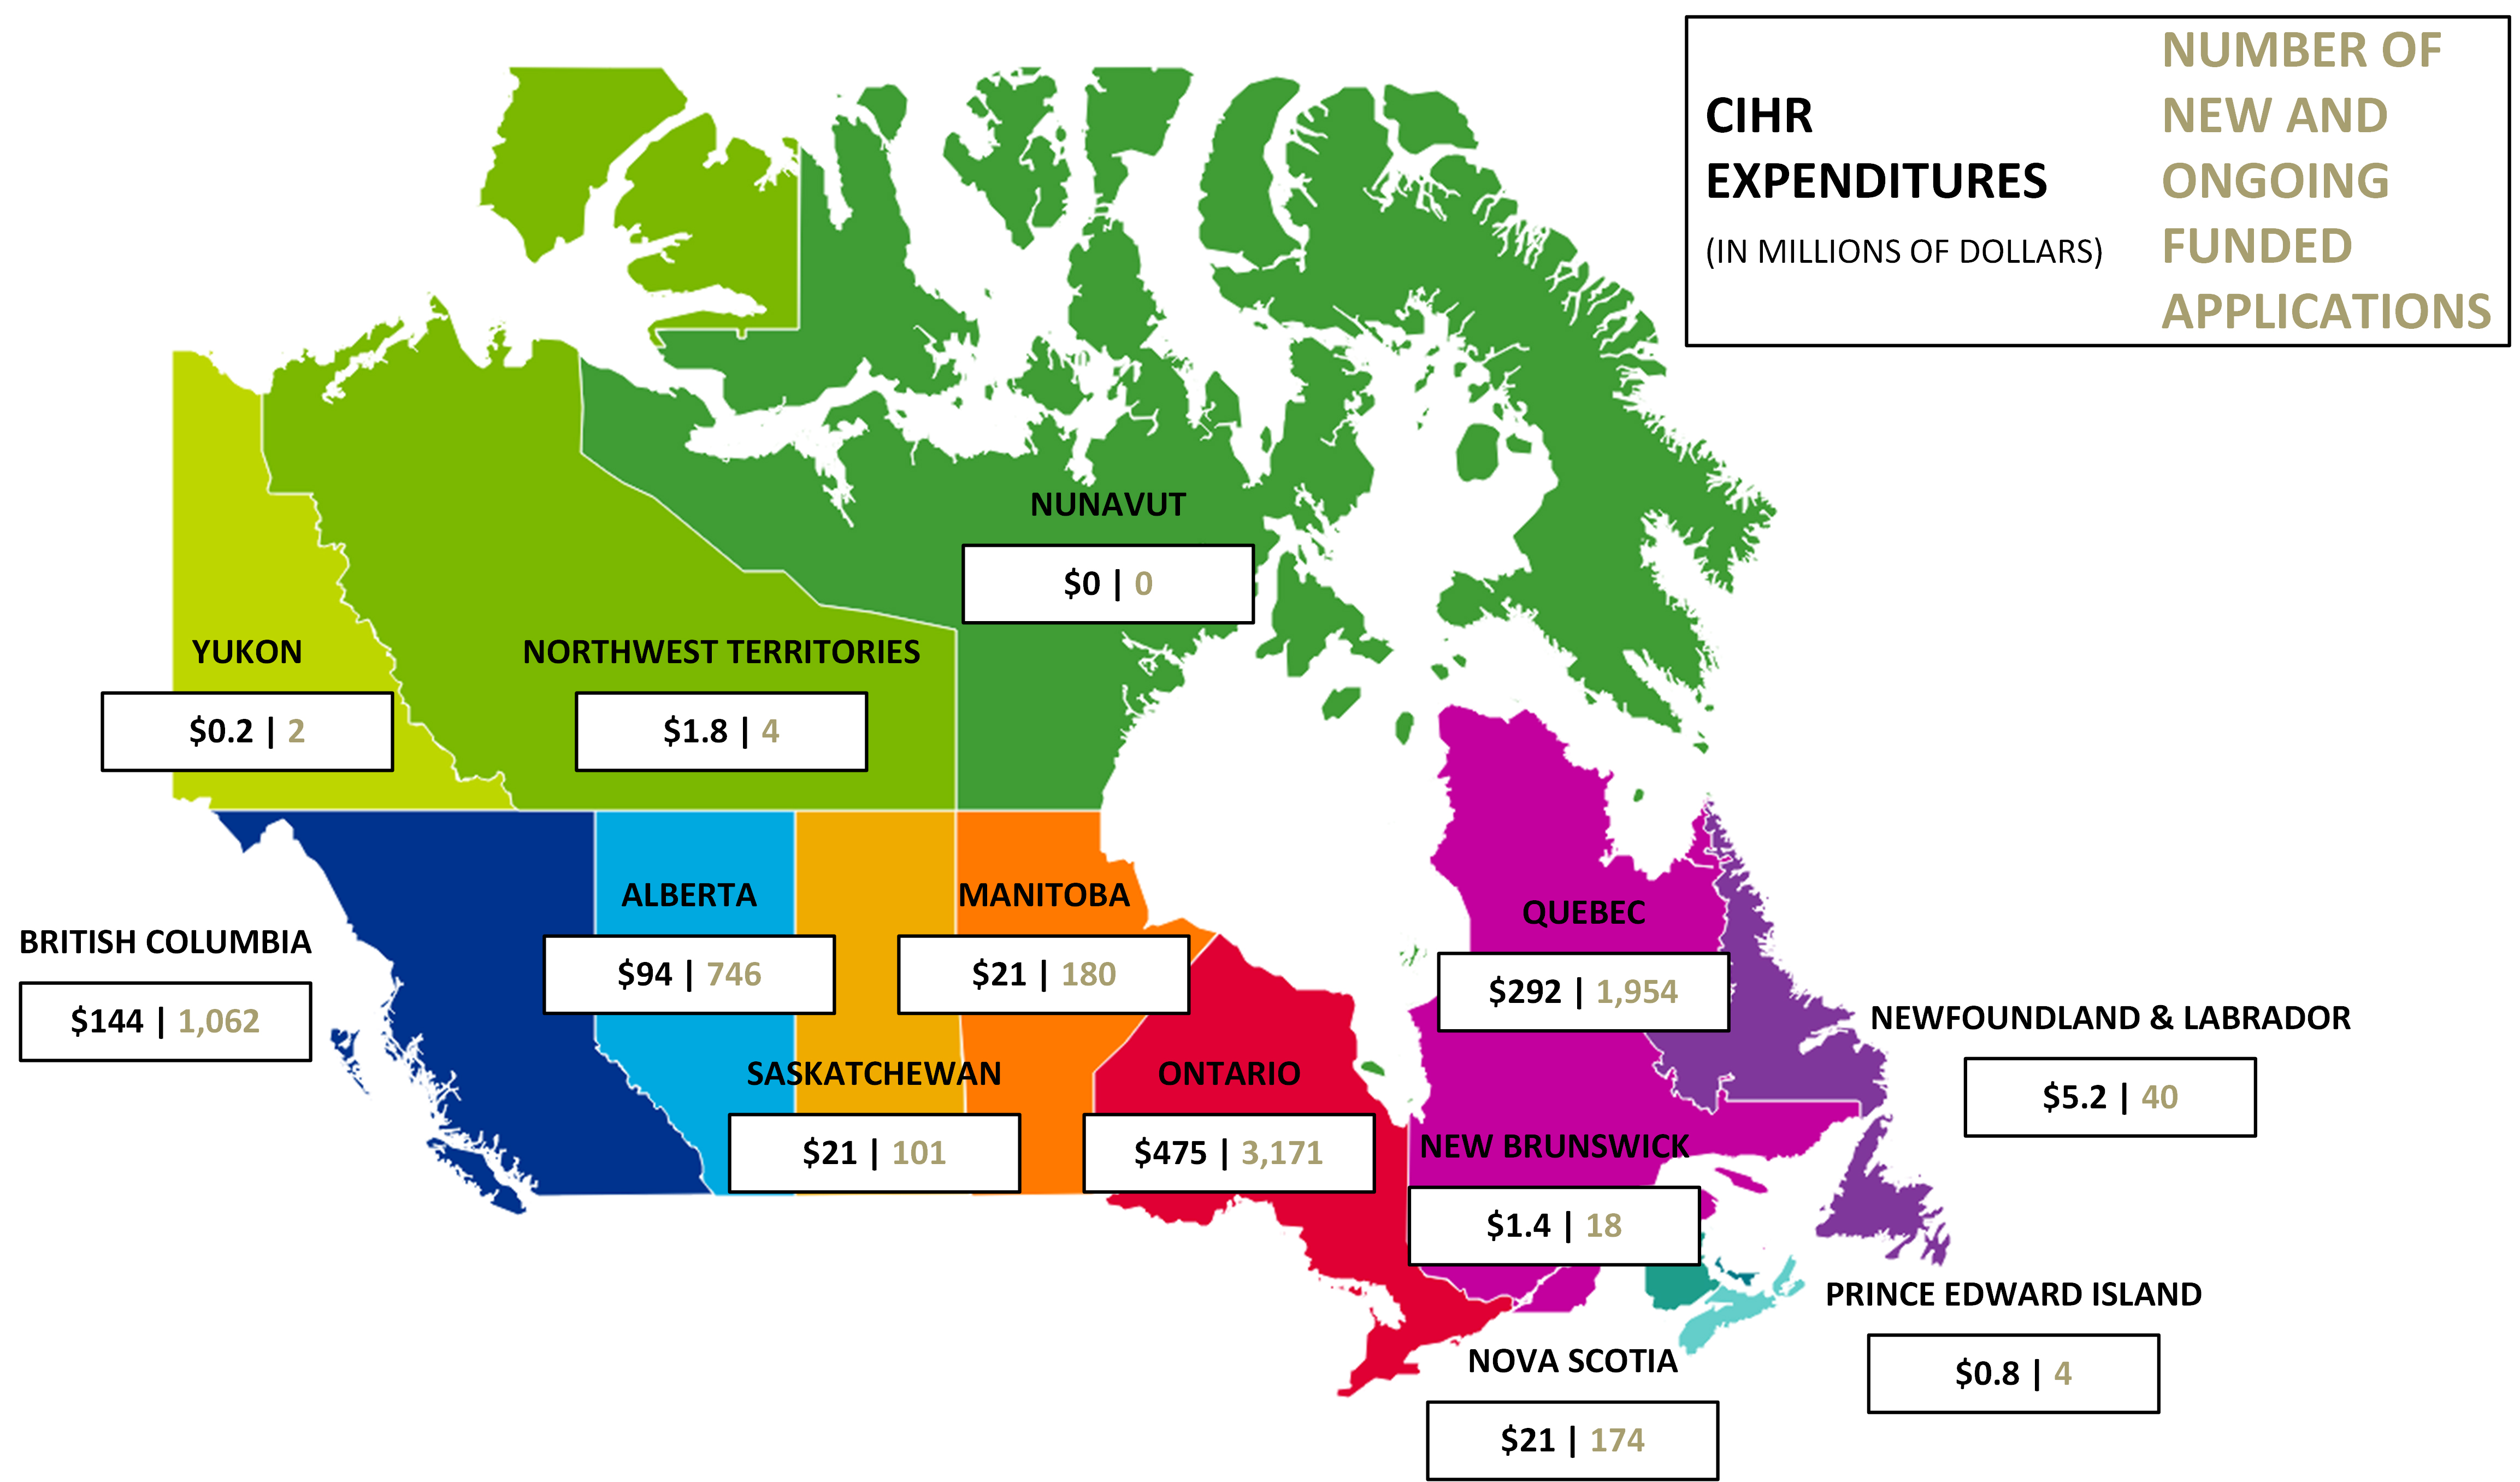
- Due to rounding, figures may not reconcile with other published information
- Excludes operating expenditures, partner contributions and direct payments
Figure 4 long description
| Region | CIHR Expenditures 2018-19 | Number of new and ongoing funded applications 2018-19 |
|---|---|---|
| Alberta | $94 | 746 |
| British Columbia | $144 | 1,062 |
| Manitoba | $21 | 180 |
| New Brunswick | $1.4 | 18 |
| Newfoundland & Labrador | $5.2 | 40 |
| North West Territories | $1.8 | 4 |
| Nova Scotia | $21 | 174 |
| Nunavut | $0 | 0 |
| Ontario | $475 | 3,171 |
| Prince Edward Island | $0.8 | 4 |
| Quebec | $292 | 1,954 |
| Saskatchewan | $21 | 101 |
| Yukon | $0.2 | 2 |
Figure 5a: Number of New and Ongoing Projects
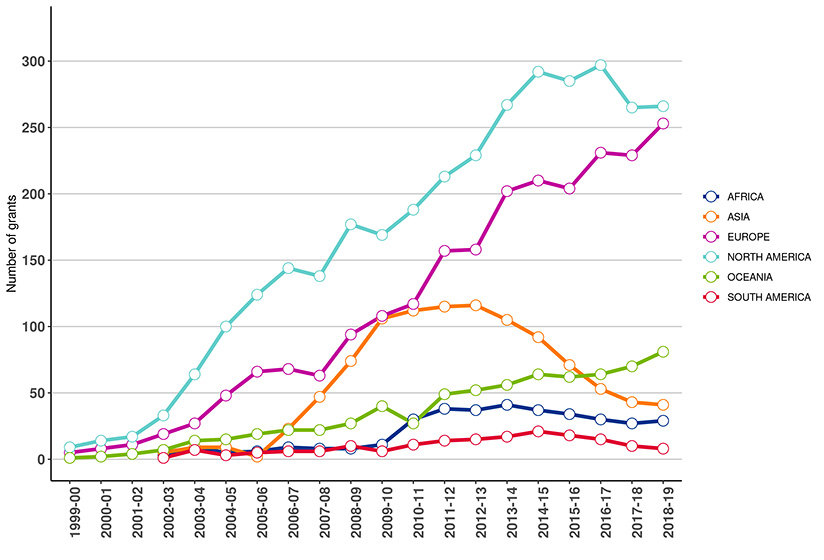
- Due to rounding as well as changes in methodology, figures may not reconcile with other published information
- Excludes operating expenditures and partner contributions
Figure 5a long description
| Continent | 1999-00 | 2000-01 | 2001-02 | 2002-03 | 2003-04 | 2004-05 | 2005-06 | 2006-07 | 2007-08 | 2008-09 | 2009-10 | 2010-11 | 2011-12 | 2012-13 | 2013-14 | 2014-15 | 2015-16 | 2016-17 | 2017-18 | 2018-19 |
|---|---|---|---|---|---|---|---|---|---|---|---|---|---|---|---|---|---|---|---|---|
| Africa | 0 | 0 | 0 | 3 | 9 | 5 | 6 | 9 | 8 | 8 | 11 | 30 | 38 | 37 | 41 | 37 | 34 | 30 | 27 | 29 |
| Europe | 5 | 8 | 11 | 19 | 27 | 48 | 66 | 68 | 63 | 94 | 108 | 117 | 157 | 158 | 202 | 210 | 204 | 231 | 229 | 253 |
| North America | 9 | 14 | 17 | 33 | 64 | 100 | 124 | 144 | 138 | 177 | 169 | 188 | 213 | 229 | 267 | 292 | 285 | 297 | 265 | 266 |
| Oceania | 1 | 2 | 4 | 7 | 14 | 15 | 19 | 22 | 22 | 27 | 40 | 27 | 49 | 52 | 56 | 64 | 62 | 64 | 70 | 81 |
| Asia | 0 | 0 | 0 | 5 | 9 | 9 | 2 | 23 | 47 | 74 | 106 | 112 | 115 | 116 | 105 | 92 | 71 | 53 | 43 | 41 |
| South America | 0 | 0 | 0 | 1 | 7 | 3 | 5 | 6 | 6 | 10 | 6 | 11 | 14 | 15 | 17 | 21 | 18 | 15 | 10 | 8 |
Figure 5b: Proportion of CIHR Grants with International linkages since 1999-00
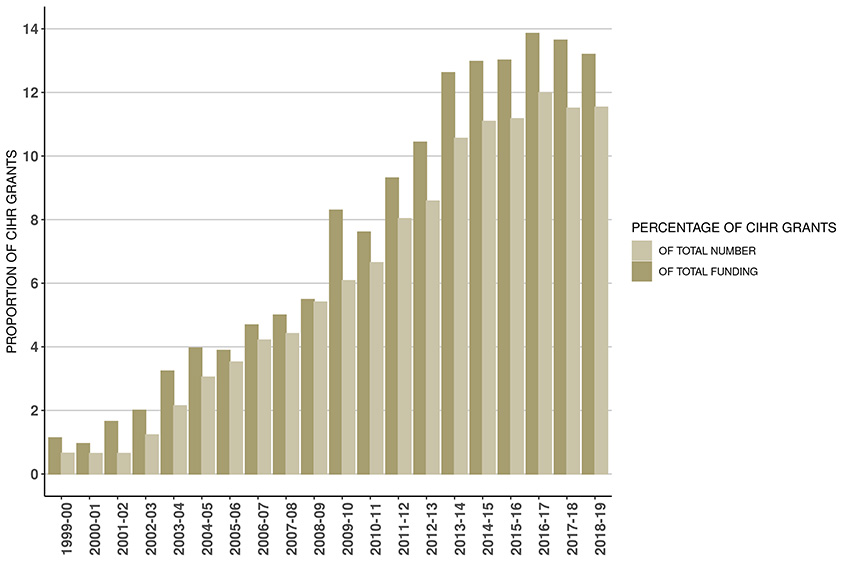
- Due to rounding as well as changes in methodology, figures may not reconcile with other published information
- Excludes operating expenditures and partner contributions
Figure 5b long description
| Proportion | 1999-00 | 2000-01 | 2001-02 | 2002-03 | 2003-04 | 2004-05 | 2005-06 | 2006-07 | 2007-08 | 2008-09 | 2009-10 | 2010-11 | 2011-12 | 2012-13 | 2013-14 | 2014-15 | 2015-16 | 2016-17 | 2017-18 | 2018-19 |
|---|---|---|---|---|---|---|---|---|---|---|---|---|---|---|---|---|---|---|---|---|
| Percentage of total CIHR | 1.1% | 1.0% | 1.7% | 2.0% | 3.2% | 4.0% | 3.9% | 4.7% | 5.0% | 5.5% | 8.3% | 7.6% | 9.3% | 10.4% | 12.6% | 13.0% | 13.0% | 13.9% | 13.6% | 13.2% |
| Percentage of total # of CIHR grants | 0.7% | 0.6% | 0.6% | 1.2% | 2.1% | 3.0% | 3.5% | 4.2% | 4.4% | 5.4% | 6.1% | 6.6% | 8.0% | 8.6% | 10.6% | 11.1% | 11.2% | 12.0% | 11.5% | 11.5% |
Figure 6: Countries with an International Linkage to a CIHR grants since 1999-00
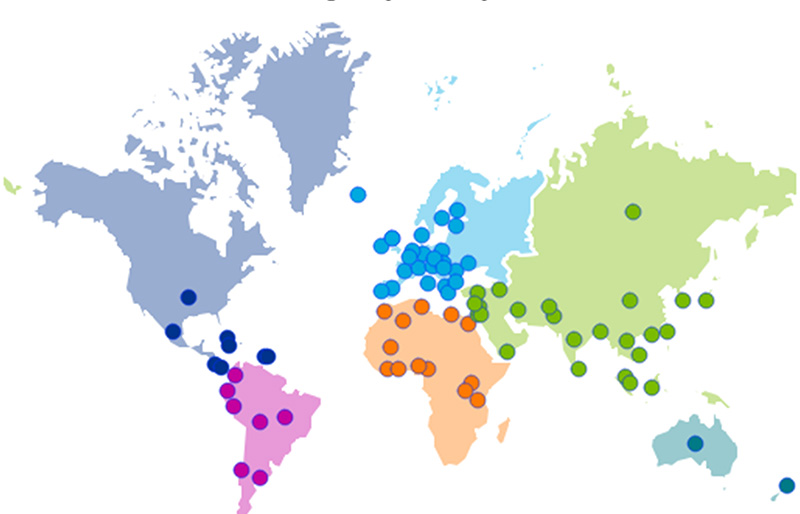
- Due to changes in methodology, figures may not reconcile with other published information
Figure 6 long description
| Countries |
|---|
| Afghanistan Argentina Australia Austria Bangladesh Barbados Belgium Benin Brazil Burkina Faso Cambodia Cameroon Chile China Colombia Costa Rica Croatia Cuba Cyprus Czech Republic Democratic Republic of the Congo Denmark Ecuador Egypt England Ethiopia Finland France Gabon Germany Ghana Greece Guatemala Guinea Haiti Hong Kong Hungary Iceland India Indonesia Iran Ireland Israel Italy Jamaica Japan Kenya Kuwait Lao People's Democratic Republic Latvia Lebanon Lithuania Luxembourg Malaysia Mali Mauritius Mexico Mongolia Netherlands New Zealand Niger Nigeria Norway Pakistan Peru Philippines Poland Portugal Puerto Rico Romania Russia Rwanda Saudi Arabia Scotland Senegal Singapore Slovakia South Africa South Korea Spain Sri Lanka Sudan Sweden Switzerland Taiwan Tanzania Thailand Turkey Uganda Ukraine United Kingdom United States Uruguay Vietnam Yugoslavia Zambia Zimbabwe |
Figure 7: Leveraged Partner Funding by Sector (in millions of dollars) – Cumulative totals from 1999-00 to 2018-19
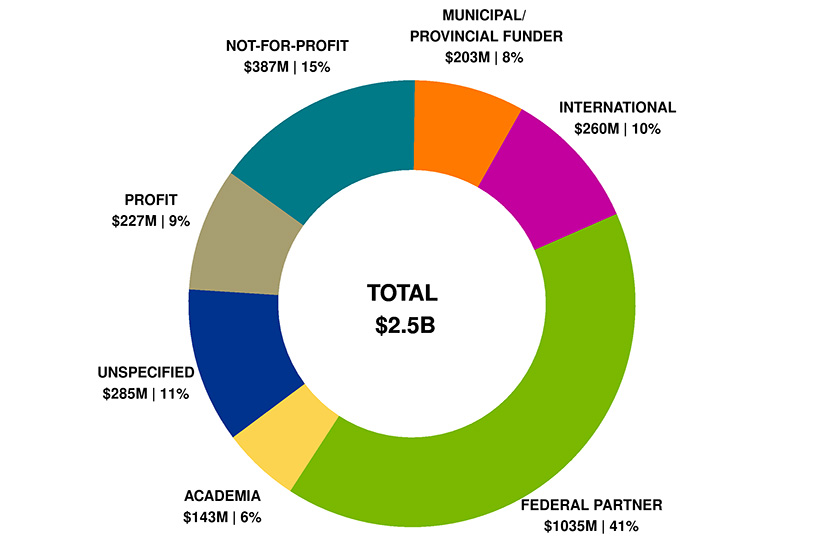
- Due to rounding, figures may not reconcile with other published information
- Includes partner contributions administered by CIHR, in kind and direct contributions from partner directly to the researcher
- Includes both competition and applicant partner contributions where there may or may not be a formal agreement with CIHR
Figure 7 long description
| Sector | Total | Percentage |
|---|---|---|
| Academia | $143 | 6% |
| Federal partners | $1,035 | 41% |
| International | $260 | 10% |
| Municipal/Provincial funder | $203 | 8% |
| Not-for-profit | $387 | 15% |
| Profit | $227 | 9% |
| Unspecified | $285 | 11% |
| Total | $2,539 | 100% |
Figure 8: Leveraged Partner Funding by Sector (in millions of dollars) – 2018-19
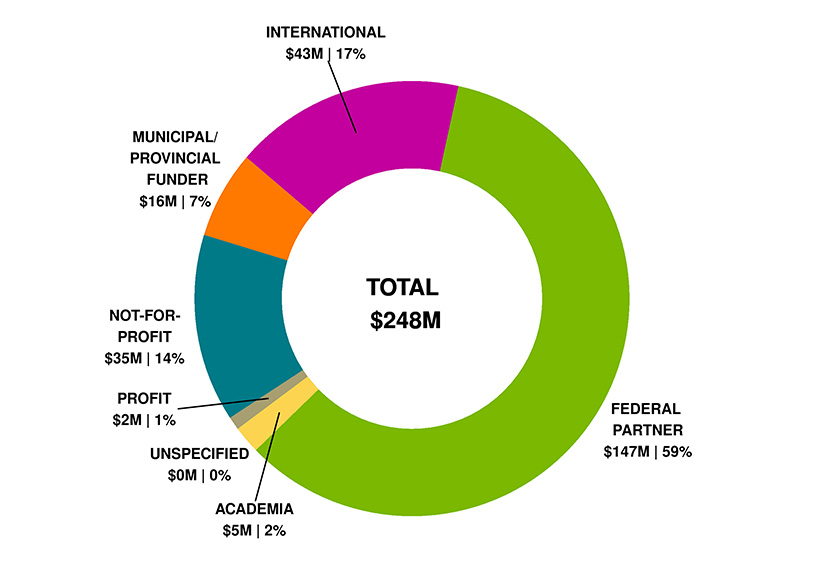
- Due to rounding, figures may not reconcile with other published information
- Includes partner contributions administered by CIHR, in kind and direct contributions from partner directly to the researcher
- Includes both competition and applicant partner contributions where there may or may not be a formal agreement with CIHR
Figure 8 long description
| Sector | Total | Percentage |
|---|---|---|
| Academia | $5 | 2% |
| Federal partner | $147 | 59% |
| International | $43 | 17% |
| Municipal/Provincial funder | $16 | 7% |
| Not-for-profit | $35 | 14% |
| Profit | $2 | 1% |
| Unspecified | <$1 | <1% |
| Total | $248 | 100% |
2017-2018
Figure 1: CIHR Fiscal Year Investments by Primary Theme since 1999-00 (in millions of dollars)
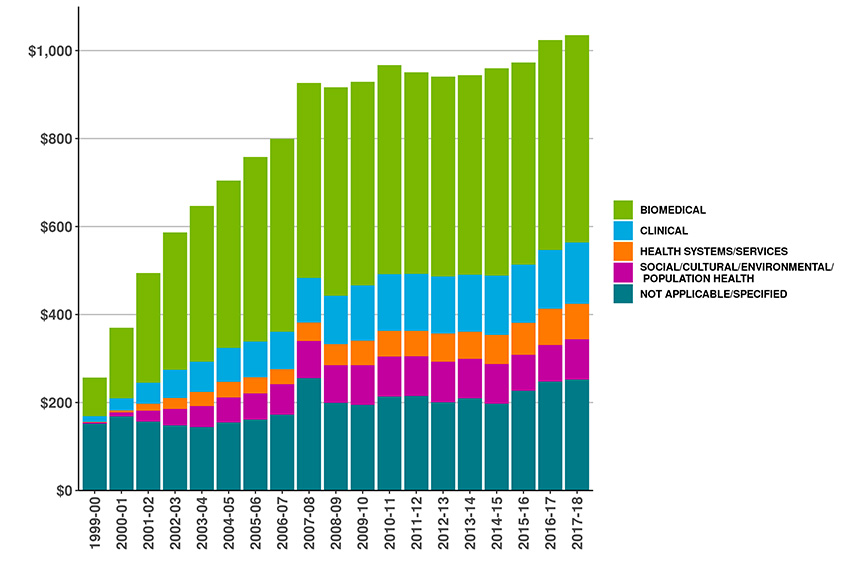
- Due to rounding, figures may not reconcile with other published information
- Excludes operating expenditures and partner contributions
- Primary theme designation is determined by the grantee at the time of application
Figure 1 long description
| Primary theme | 1999-00 | 2000-01 | 2001-02 | 2002-03 | 2003-04 | 2004-05 | 2005-06 | 2006-07 | 2007-08 | 2008-09 | 2009-10 | 2010-11 | 2011-12 | 2012-13 | 2013-14 | 2014-15 | 2015-16 | 2016-17 | 2017-18 |
|---|---|---|---|---|---|---|---|---|---|---|---|---|---|---|---|---|---|---|---|
| Biomedical | 88∣88 | 88∣160 | 250∣250 | 250∣312 | 354∣354 | 354∣381 | 419∣419 | 419∣439 | 444∣444 | 444∣474 | 463∣463 | 463∣475 | 458∣458 | 458∣455 | 454∣454 | 454∣471 | 459∣459 | 459∣478 | $472 |
| Clinical | 13∣13 | 13∣27 | 47∣47 | 47∣64 | 69∣69 | 69∣77 | 82∣82 | 82∣85 | 101∣101 | 101∣110 | 126∣126 | 126∣129 | 130∣130 | 130∣129 | 130∣130 | 130∣134 | 132∣132 | 132∣133 | $140 |
| Health systems/services | 0.7∣0.7 | 0.7∣5 | 16∣16 | 16∣25 | 32∣32 | 32∣36 | 36∣36 | 36∣34 | 42∣42 | 42∣48 | 55∣55 | 55∣58 | 57∣57 | 57∣64 | 61∣61 | 61∣66 | 73∣73 | 73∣82 | $80 |
| Social/Cultural/Environmental/Population Health | 3∣3 | 3∣9 | 25∣25 | 25∣38 | 47∣47 | 47∣56 | 60∣60 | 60∣69 | 84∣84 | 84∣85 | 90∣90 | 90∣91 | 91∣91 | 91∣92 | 90∣90 | 90∣90 | 82∣82 | 82∣83 | $91 |
| Not applicable/Specified | 152∣152 | 152∣168 | 157∣157 | 157∣148 | 144∣144 | 144∣155 | 161∣161 | 161∣172 | 255∣255 | 255∣199 | 195∣195 | 195∣213 | 215∣215 | 215∣201 | 210∣210 | 210∣197 | 227∣227 | 227∣248 | $252 |
| Total | $257 | $370 | $494 | $587 | $647 | $705 | $758 | $800 | $927 | $917 | $929 | $967 | $951 | $941 | $944 | $960 | $973 | $1,024 | $1,035 |
Figure 2: CIHR Investments by Primary Theme 2017-18 (in millions of dollars)
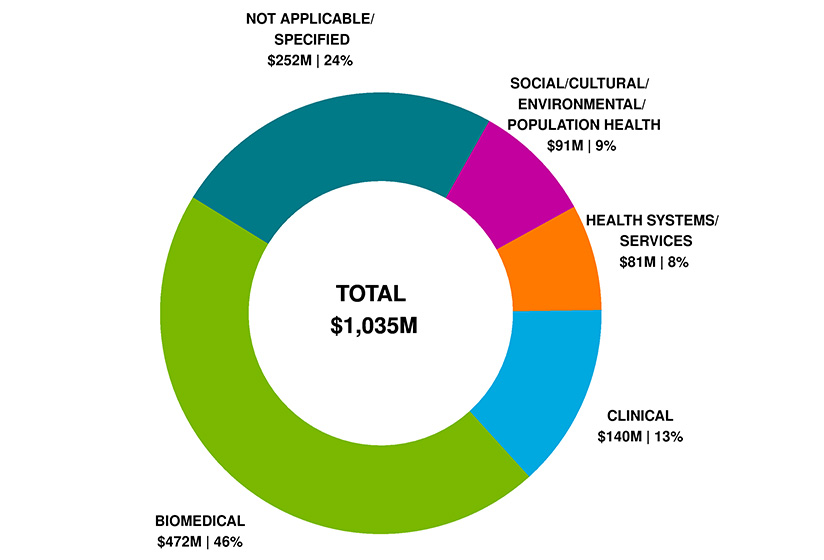
- Due to rounding, figures may not reconcile with other published information
- Excludes operating expenditures and partner contributions
- Primary theme designation is determined by the grantee at the time of the application
Figure 2 long description
| Primary Theme | 2017-18 | Percentage Breakdown |
|---|---|---|
| Biomedical | $472 | 46% |
| Clinical | $140 | 13% |
| Health systems/services | $81 | 8% |
| Social/Cultural/Environmental/Population Health | $91 | 9% |
| Not applicable/Specified | $252 | 24% |
| Total | $1,035 | 100% |
Figure 3: CIHR Fiscal Year Investments by Funding Type since 1999-00 (in millions of dollars)
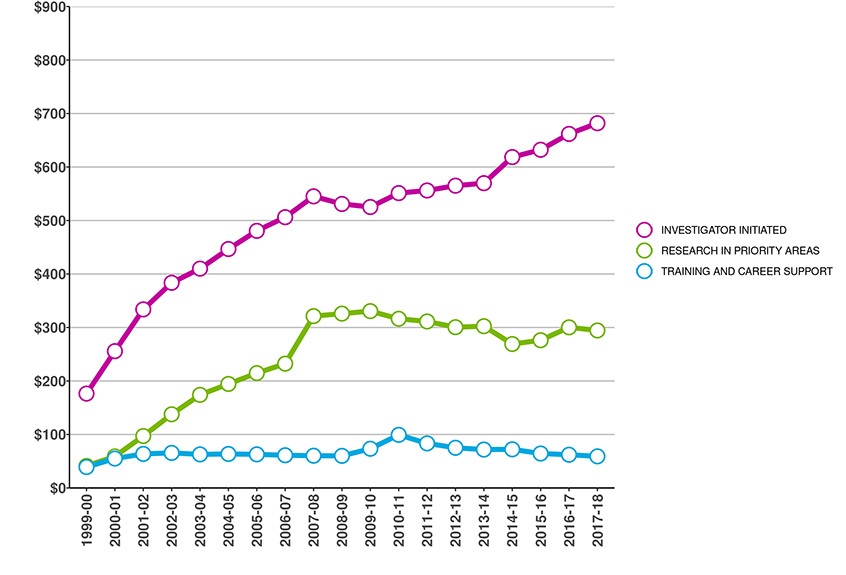
- Due to rounding, figures may not reconcile with other published information
- Excludes operating expenditures and partner contributions
Figure 3 long description
| Funding type | 1999-00 | 2000-01 | 2001-02 | 2002-03 | 2003-04 | 2004-05 | 2005-06 | 2006-07 | 2007-08 | 2008-09 | 2009-10 | 2010-11 | 2011-12 | 2012-13 | 2013-14 | 2014-15 | 2015-16 | 2016-17 | 2017-18 |
|---|---|---|---|---|---|---|---|---|---|---|---|---|---|---|---|---|---|---|---|
| Investigator Initiated | 176∣176 | 176∣256 | 334∣334 | 334∣384 | 410∣410 | 410∣447 | 481∣481 | 481∣506 | 545∣545 | 545∣531 | 525∣525 | 525∣551 | 556∣556 | 556∣565 | 570∣570 | 570∣619 | 632∣632 | 632∣662 | $682 |
| Research in Priority Areas | 41∣41 | 41∣59 | 97∣97 | 97∣138 | 174∣174 | 174∣194 | 215∣215 | 215∣232 | 321∣321 | 321∣326 | 331∣331 | 331∣316 | 311∣311 | 311∣301 | 302∣302 | 302∣269 | 276∣276 | 276∣300 | $294 |
| Training and Career Support | 39∣39 | 39∣55 | 64∣64 | 64∣65 | 63∣63 | 63∣63 | 63∣63 | 63∣61 | 60∣60 | 60∣60 | 73∣73 | 73∣99 | 83∣83 | 83∣75 | 72∣72 | 72∣72 | 64∣64 | 64∣62 | $59 |
| Total | $257 | $370 | $494 | $587 | $647 | $705 | $758 | $800 | $927 | $917 | $929 | $967 | $951 | $941 | $944 | $960 | $973 | $1,024 | $1,035 |
Figure 4: CIHR Investments by Region in 2017-18 (in millions of dollars)
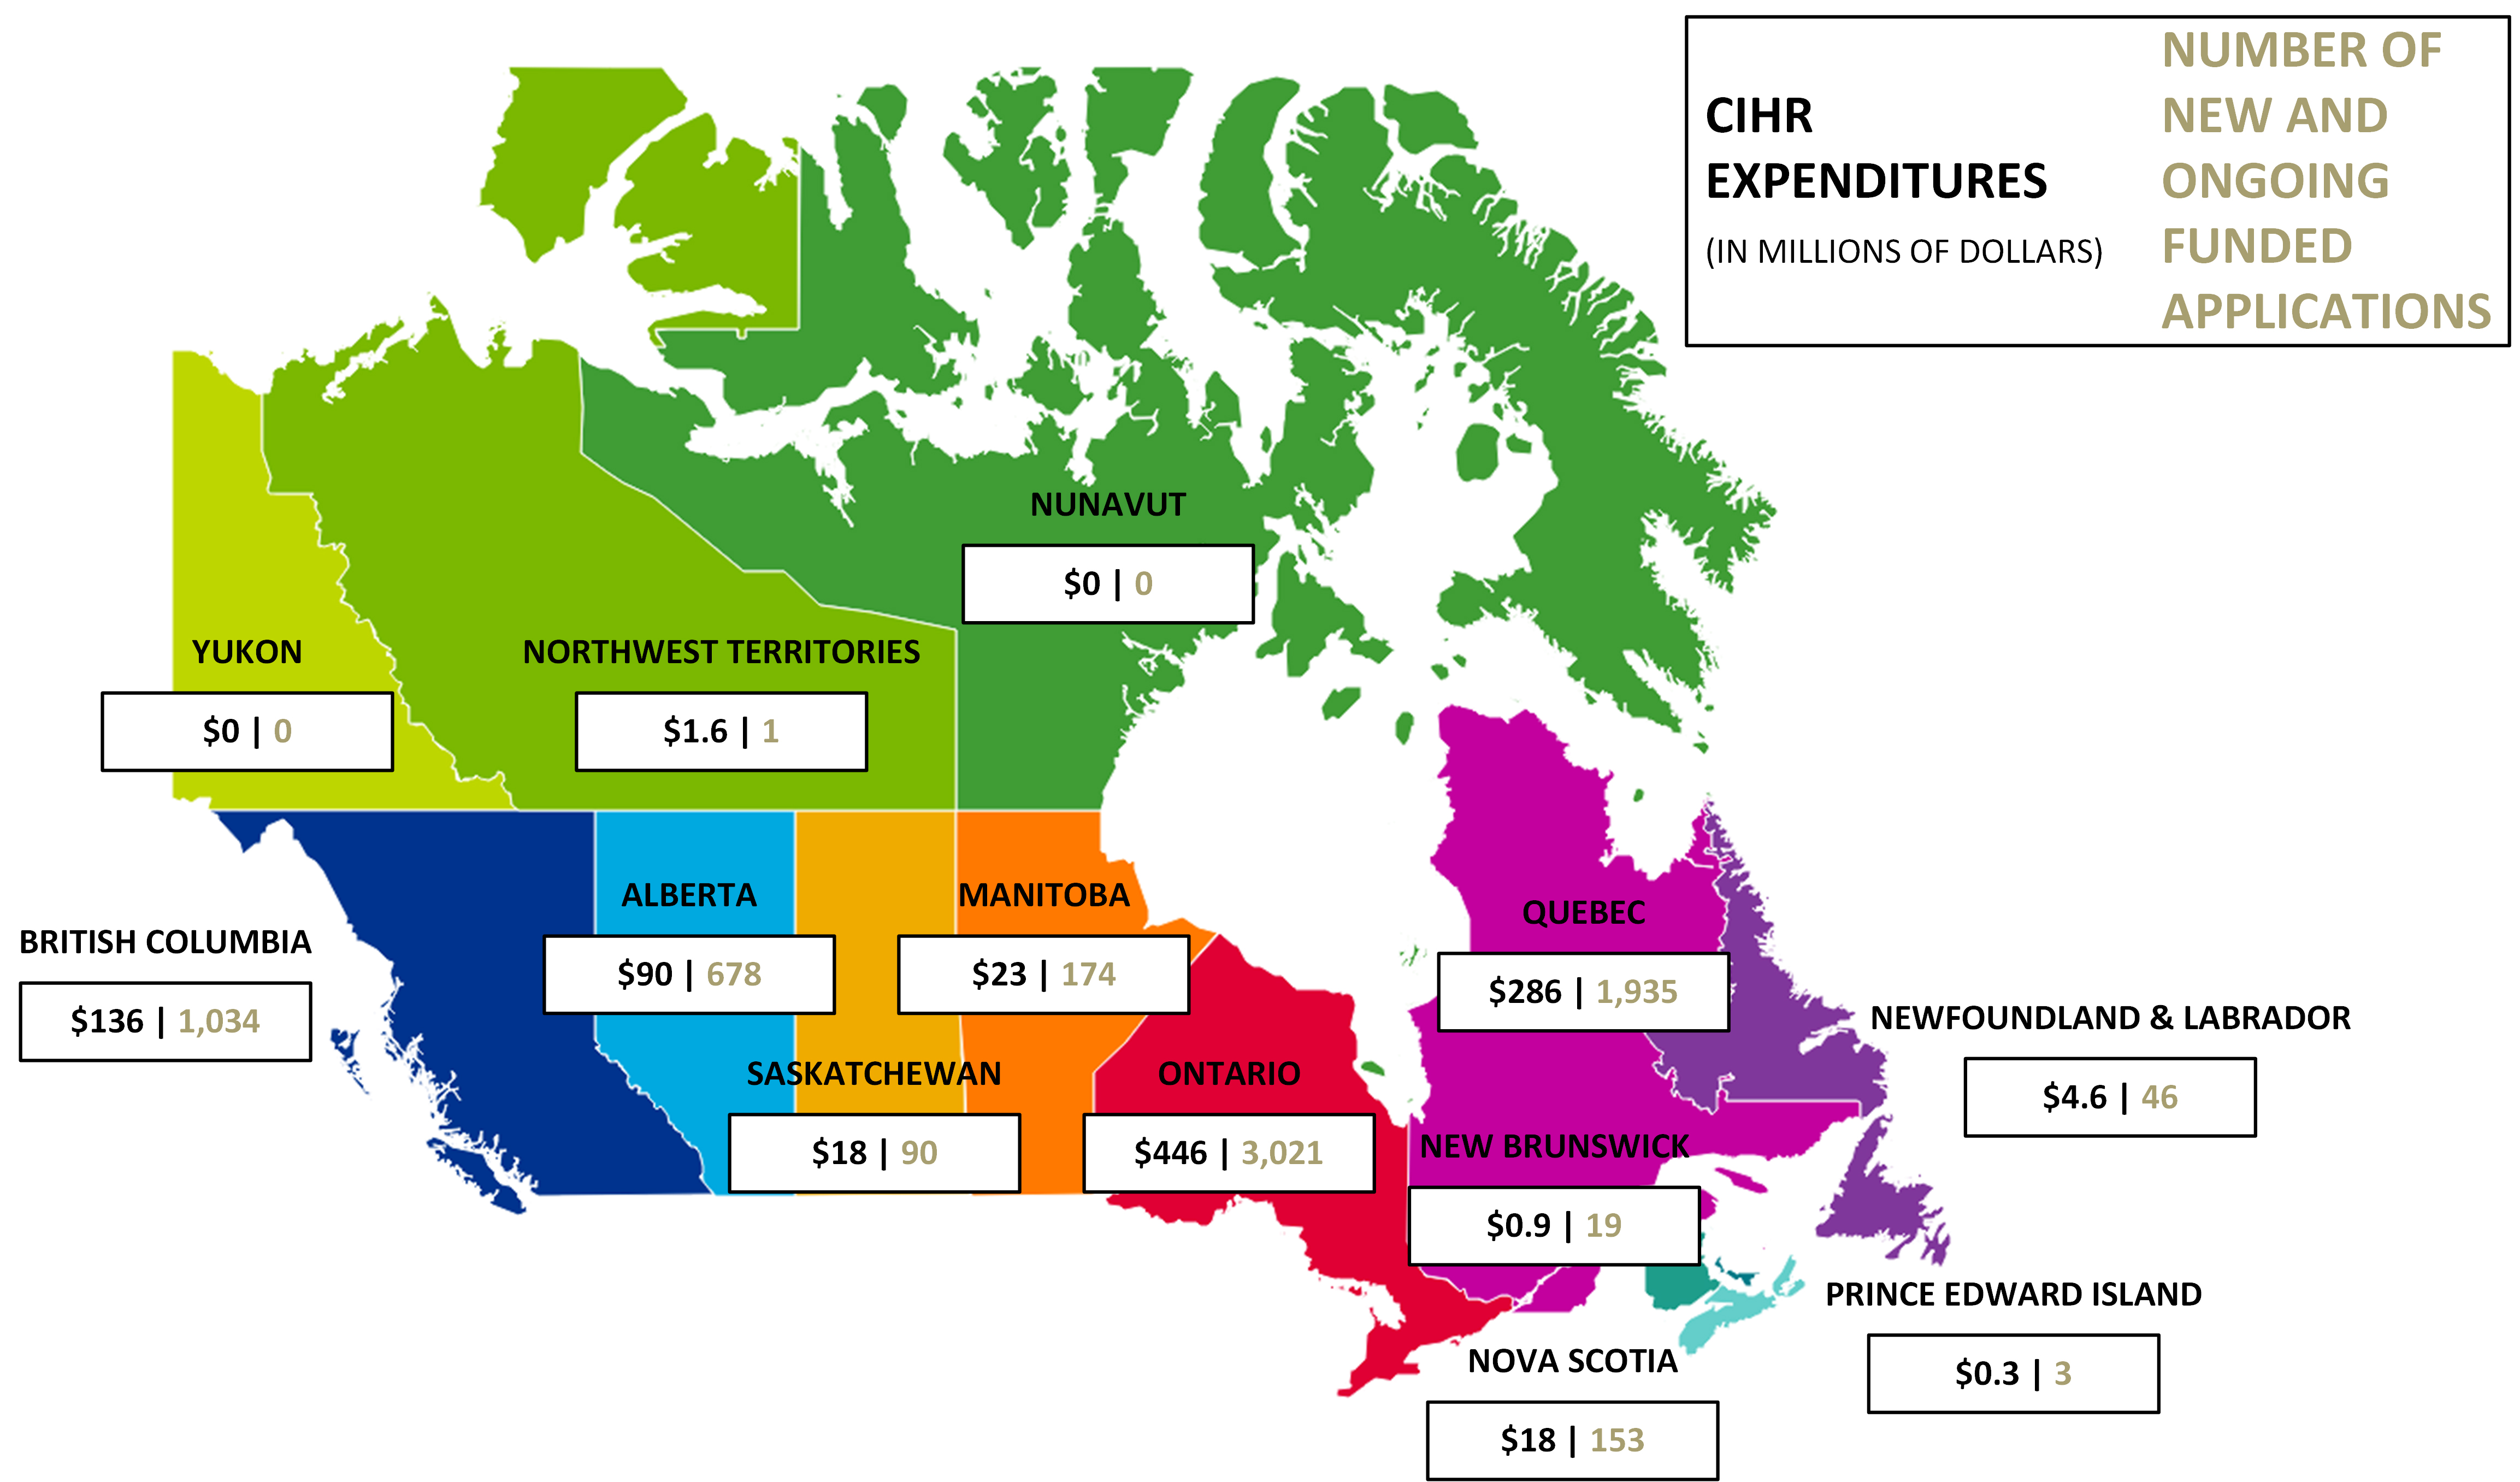
- Due to rounding, figures may not reconcile with other published information
- Excludes operating expenditures, partner contributions and direct payments
Figure 4 long description
| Region | CIHR Expenditures 2017-18 | Number of new and ongoing funded applications 2017-18 |
|---|---|---|
| Alberta | $90 | 678 |
| British Columbia | $136 | 1,034 |
| Manitoba | $23 | 174 |
| New Brunswick | $0.9 | 19 |
| Newfoundland & Labrador | $4.9 | 46 |
| North West Territories | $1.6 | 1 |
| Nova Scotia | $18 | 153 |
| Nunavut | $0 | 0 |
| Ontario | $446 | 3,021 |
| Prince Edward Island | $0.3 | 3 |
| Quebec | $286 | 1,935 |
| Saskatchewan | $18 | 90 |
| Yukon | $0 | 0 |
Figure 5a: Number of New and Ongoing Projects
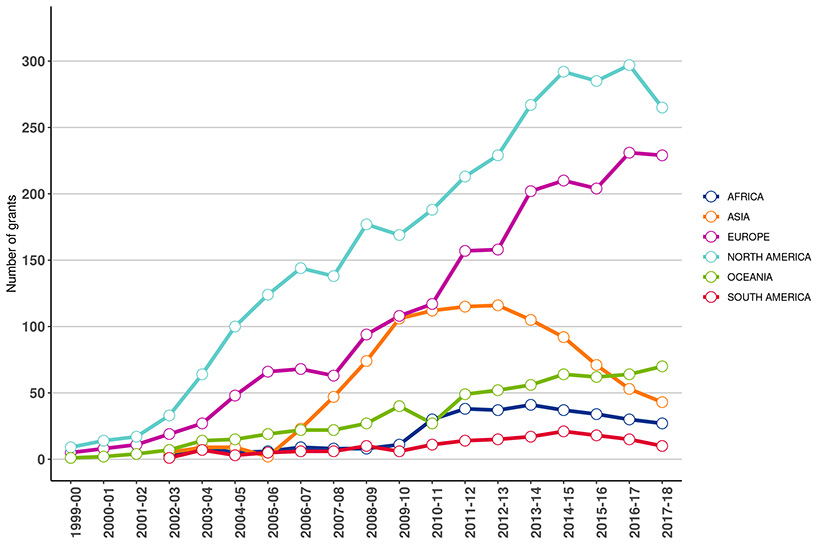
- Due to rounding as well as changes in methodology, figures may not reconcile with other published information
- Excludes operating expenditures and partner contributions
Figure 5a long description
| Continent | 1999-00 | 2000-01 | 2001-02 | 2002-03 | 2003-04 | 2004-05 | 2005-06 | 2006-07 | 2007-08 | 2008-09 | 2009-10 | 2010-11 | 2011-12 | 2012-13 | 2013-14 | 2014-15 | 2015-16 | 2016-17 | 2017-18 |
|---|---|---|---|---|---|---|---|---|---|---|---|---|---|---|---|---|---|---|---|
| Africa | 0 | 0 | 0 | 3 | 9 | 5 | 6 | 9 | 8 | 8 | 11 | 30 | 38 | 37 | 41 | 37 | 34 | 30 | 27 |
| Europe | 5 | 8 | 11 | 19 | 27 | 48 | 66 | 68 | 63 | 94 | 108 | 117 | 157 | 158 | 202 | 210 | 204 | 231 | 229 |
| North America | 9 | 14 | 17 | 33 | 64 | 100 | 124 | 144 | 138 | 177 | 169 | 188 | 213 | 229 | 267 | 292 | 285 | 297 | 265 |
| Oceania | 1 | 2 | 4 | 7 | 14 | 15 | 19 | 22 | 22 | 27 | 40 | 27 | 49 | 52 | 56 | 64 | 62 | 64 | 70 |
| Asia | 0 | 0 | 0 | 5 | 9 | 9 | 2 | 23 | 47 | 74 | 106 | 112 | 115 | 116 | 105 | 92 | 71 | 53 | 43 |
| South America | 0 | 0 | 0 | 1 | 7 | 3 | 5 | 6 | 6 | 10 | 6 | 11 | 14 | 15 | 17 | 21 | 18 | 15 | 10 |
Figure 5b: Proportion of CIHR Grants with International linkages since 1999-00
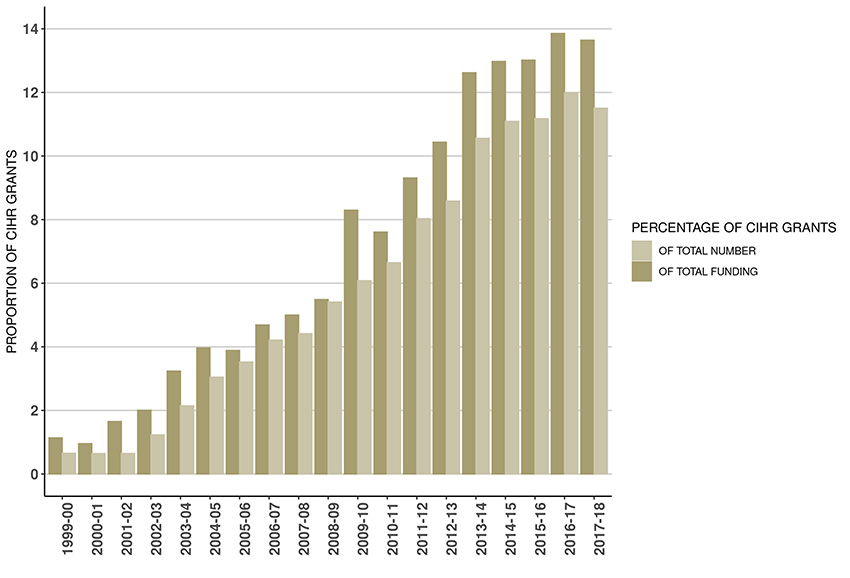
- Due to rounding as well as changes in methodology, figures may not reconcile with other published information
- Excludes operating expenditures and partner contributions
Figure 5b long description
| Proportion | 1999-00 | 2000-01 | 2001-02 | 2002-03 | 2003-04 | 2004-05 | 2005-06 | 2006-07 | 2007-08 | 2008-09 | 2009-10 | 2010-11 | 2011-12 | 2012-13 | 2013-14 | 2014-15 | 2015-16 | 2016-17 | 2017-18 |
|---|---|---|---|---|---|---|---|---|---|---|---|---|---|---|---|---|---|---|---|
| Percentage of total CIHR | 1.1% | 1.0% | 1.7% | 2.0% | 3.2% | 4.0% | 3.9% | 4.7% | 5.0% | 5.5% | 8.3% | 7.6% | 9.3% | 10.4% | 12.6% | 13.0% | 13.0% | 13.9% | 13.6% |
| Percentage of total # of CIHR grants | 0.7% | 0.6% | 0.6% | 1.2% | 2.1% | 3.0% | 3.5% | 4.2% | 4.4% | 5.4% | 6.1% | 6.6% | 8.0% | 8.6% | 10.6% | 11.1% | 11.2% | 12.0% | 11.5% |
Figure 6: Countries with an International Linkage to a CIHR grants since 1999-00
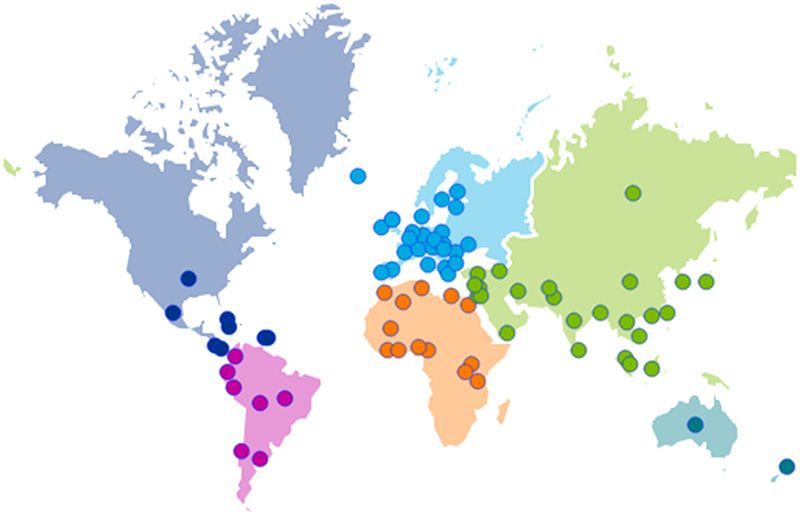
- Due to changes in methodology, figures may not reconcile with other published information
Figure 6 long description
| Countries |
|---|
| Afghanistan Argentina Australia Austria Bangladesh Barbados Belgium Benin Brazil Burkina Faso Cambodia Cameroon Chile China Colombia Costa Rica Croatia Cuba Cyprus Czech Republic Democratic Republic of the Congo Denmark Ecuador Egypt England Ethiopia Finland France Gabon Germany Ghana Greece Guatemala Guinea Haiti Hong Kong Hungary Iceland India Indonesia Iran Ireland Israel Italy Jamaica Japan Kenya Kuwait Lao People's Democratic Republic Latvia Lebanon Lithuania Luxembourg Malaysia Mali Mauritius Mexico Mongolia Netherlands New Zealand Niger Nigeria Norway Pakistan Peru Philippines Poland Portugal Puerto Rico Romania Russia Rwanda Saudi Arabia Scotland Senegal Singapore Slovakia South Africa South Korea Spain Sri Lanka Sudan Sweden Switzerland Taiwan Tanzania Thailand Turkey Uganda Ukraine United Kingdom United States Uruguay Vietnam Yugoslavia Zambia Zimbabwe |
Figure 7: Leveraged Partner Funding by Sector (in millions of dollars) – Cumulative totals from 1999-00 to 2017-18
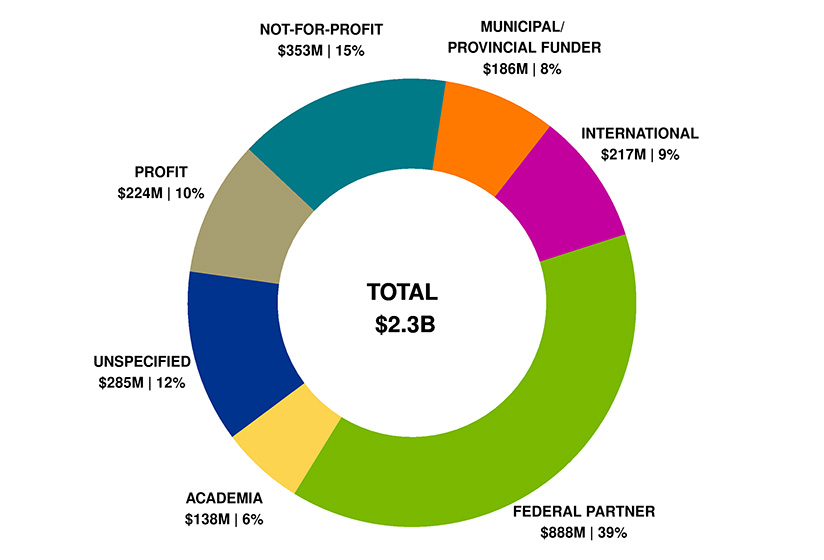
- Due to rounding, figures may not reconcile with other published information
- Includes partner contributions administered by CIHR, in kind and direct contributions from partner directly to the researcher
- Includes both competition and applicant partner contributions where there may or may not be a formal agreement with CIHR
Figure 7 long description
| Sector | Total | Percentage |
|---|---|---|
| Academia | $138 | 6% |
| Federal partners | $888 | 39% |
| International | $217 | 9% |
| Municipal/Provincial funder | $186 | 8% |
| Not-for-profit | $353 | 15% |
| Profit | $224 | 10% |
| Unspecified | $285 | 12% |
| Total | $2,291 | 100% |
Figure 8: Leveraged Partner Funding by Sector (in millions of dollars) – 2017-18
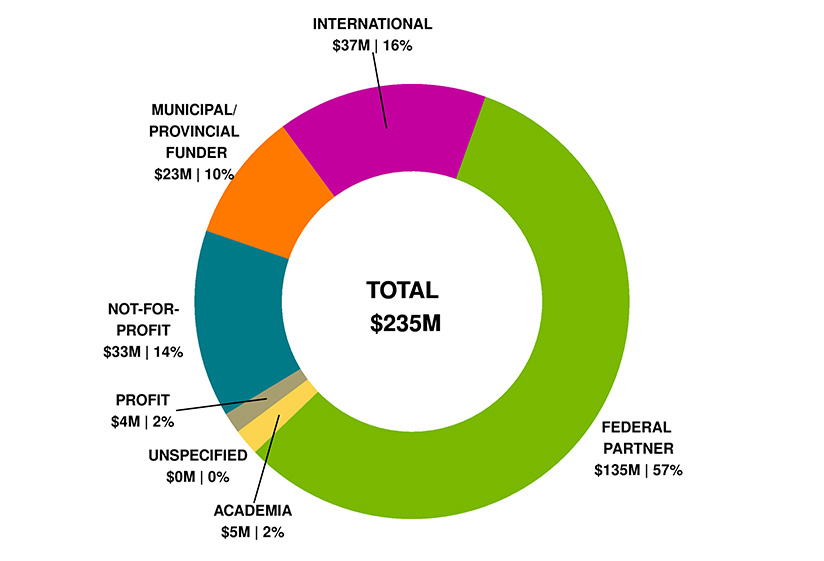
- Due to rounding, figures may not reconcile with other published information
- Includes partner contributions administered by CIHR, in kind and direct contributions from partner directly to the researcher
- Includes both competition and applicant partner contributions where there may or may not be a formal agreement with CIHR
Figure 8 long description
| Sector | Total | Percentage |
|---|---|---|
| Academia | $5 | 2% |
| Federal partner | $135 | 57% |
| International | $37 | 16% |
| Municipal/Provincial funder | $23 | 10% |
| Not-for-profit | $33 | 14% |
| Profit | $4 | 2% |
| Unspecified | <$1 | <1% |
| Total | $235 | 100% |
2016-2017
Figure 1: CIHR Fiscal Year Investments by Primary Theme since 1999-00 (in millions of dollars)
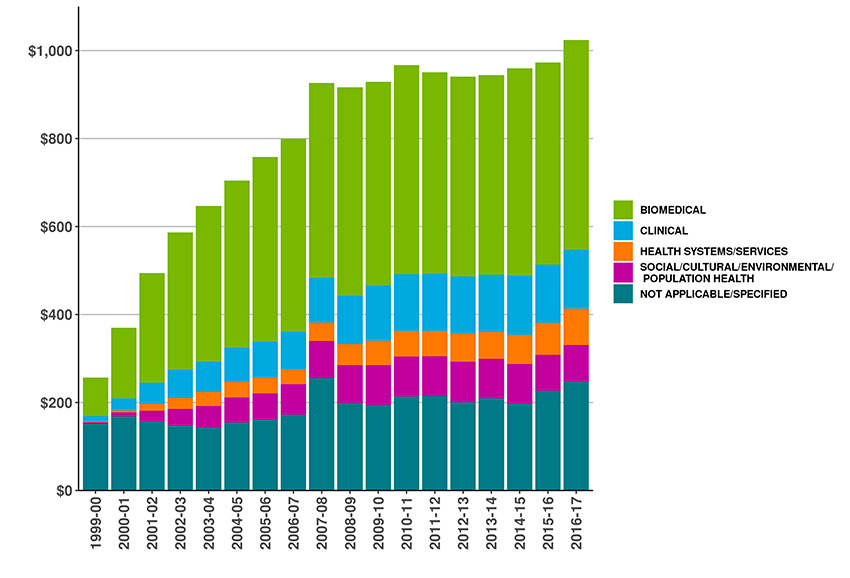
- Due to rounding, figures may not reconcile with other published information
- Excludes operating expenditures and partner contributions
- Primary theme designation is determined by the grantee at the time of application
Figure 1 long description
| Primary theme | 1999-00 | 2000-01 | 2001-02 | 2002-03 | 2003-04 | 2004-05 | 2005-06 | 2006-07 | 2007-08 | 2008-09 | 2009-10 | 2010-11 | 2011-12 | 2012-13 | 2013-14 | 2014-15 | 2015-16 | 2016-17 |
|---|---|---|---|---|---|---|---|---|---|---|---|---|---|---|---|---|---|---|
| Biomedical | 88∣88 | 88∣160 | 250∣250 | 250∣312 | 354∣354 | 354∣381 | 419∣419 | 419∣439 | 444∣444 | 444∣474 | 463∣463 | 463∣475 | 458∣458 | 458∣455 | 454∣454 | 454∣471 | 459∣459 | 459∣478 |
| Clinical | 13∣13 | 13∣27 | 47∣47 | 47∣64 | 69∣69 | 69∣77 | 82∣82 | 82∣85 | 101∣101 | 101∣110 | 126∣126 | 126∣129 | 130∣130 | 130∣129 | 130∣130 | 130∣134 | 132∣132 | 132∣133 |
| Health systems/services | 0.7∣0.7 | 0.7∣5 | 16∣16 | 16∣25 | 32∣32 | 32∣36 | 36∣36 | 36∣34 | 42∣42 | 42∣48 | 55∣55 | 55∣58 | 57∣57 | 57∣64 | 61∣61 | 61∣66 | 73∣73 | 73∣82 |
| Social/Cultural/Environmental/Population Health | 3∣3 | 3∣9 | 25∣25 | 25∣38 | 47∣47 | 47∣56 | 60∣60 | 60∣69 | 84∣84 | 84∣85 | 90∣90 | 90∣91 | 91∣91 | 91∣92 | 90∣90 | 90∣90 | 82∣82 | 82∣83 |
| Not applicable/Specified | 152∣152 | 152∣168 | 157∣157 | 157∣148 | 144∣144 | 144∣155 | 161∣161 | 161∣172 | 255∣255 | 255∣199 | 195∣195 | 195∣213 | 215∣215 | 215∣201 | 210∣210 | 210∣197 | 227∣227 | 227∣248 |
| Total | $257 | $370 | $494 | $587 | $647 | $705 | $758 | $800 | $927 | $917 | $929 | $967 | $951 | $941 | $944 | $960 | $973 | $1,024 |
Figure 2: CIHR Investments by Primary Theme 2016-17 (in millions of dollars)
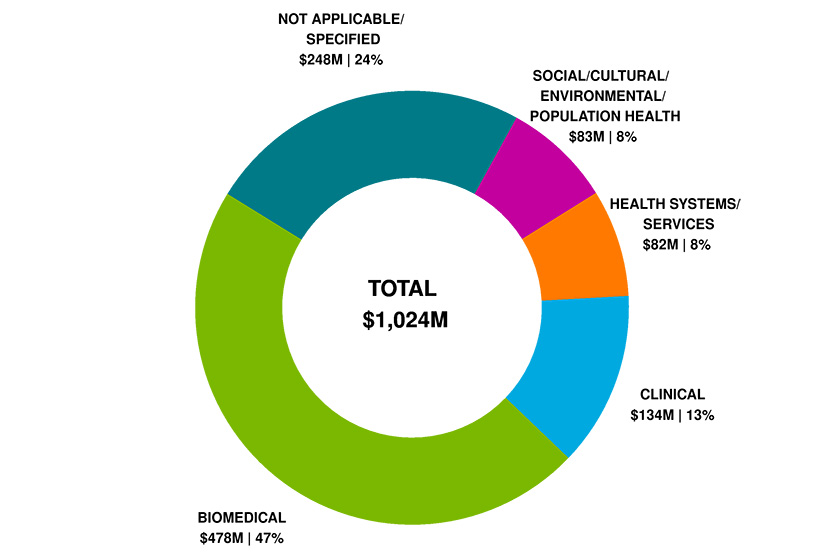
- Due to rounding, figures may not reconcile with other published information
- Excludes operating expenditures and partner contributions
- Primary theme designation is determined by the grantee at the time of the application
Figure 2 long description
| Primary Theme | 2016-17 | Percentage Breakdown |
|---|---|---|
| Biomedical | $478 | 47% |
| Clinical | $134 | 13% |
| Health systems/services | $82 | 8% |
| Social/Cultural/Environmental/Population Health | $83 | 8% |
| Not applicable/Specified | $248 | 24% |
| Total | $1,024 | 100% |
Figure 3: CIHR Fiscal Year Investments by Funding Type since 1999-00 (in millions of dollars)
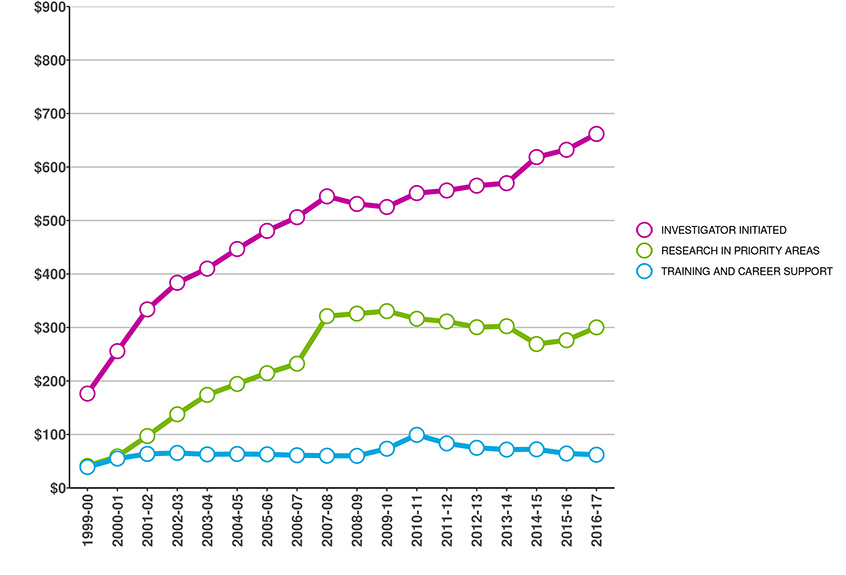
- Due to rounding, figures may not reconcile with other published information
- Excludes operating expenditures and partner contributions
Figure 3 long description
| Funding type | 1999-00 | 2000-01 | 2001-02 | 2002-03 | 2003-04 | 2004-05 | 2005-06 | 2006-07 | 2007-08 | 2008-09 | 2009-10 | 2010-11 | 2011-12 | 2012-13 | 2013-14 | 2014-15 | 2015-16 | 2016-17 |
|---|---|---|---|---|---|---|---|---|---|---|---|---|---|---|---|---|---|---|
| Investigator Initiated | 176∣176 | 176∣256 | 334∣334 | 334∣384 | 410∣410 | 410∣447 | 481∣481 | 481∣506 | 545∣545 | 545∣531 | 525∣525 | 525∣551 | 556∣556 | 556∣565 | 570∣570 | 570∣619 | 632∣632 | 632∣662 |
| Research in Priority Areas | 41∣41 | 41∣59 | 97∣97 | 97∣138 | 174∣174 | 174∣194 | 215∣215 | 215∣232 | 321∣321 | 321∣326 | 331∣331 | 331∣316 | 311∣311 | 311∣301 | 302∣302 | 302∣269 | 276∣276 | 276∣300 |
| Training and Career Support | 39∣39 | 39∣55 | 64∣64 | 64∣65 | 63∣63 | 63∣63 | 63∣63 | 63∣61 | 60∣60 | 60∣60 | 73∣73 | 73∣99 | 83∣83 | 83∣75 | 72∣72 | 72∣72 | 64∣64 | 64∣62 |
| Total | $257 | $370 | $494 | $587 | $647 | $705 | $758 | $800 | $927 | $917 | $929 | $967 | $951 | $941 | $944 | $960 | $973 | $1,024 |
Figure 4: CIHR Investments by Region in 2016-17 (in millions of dollars)
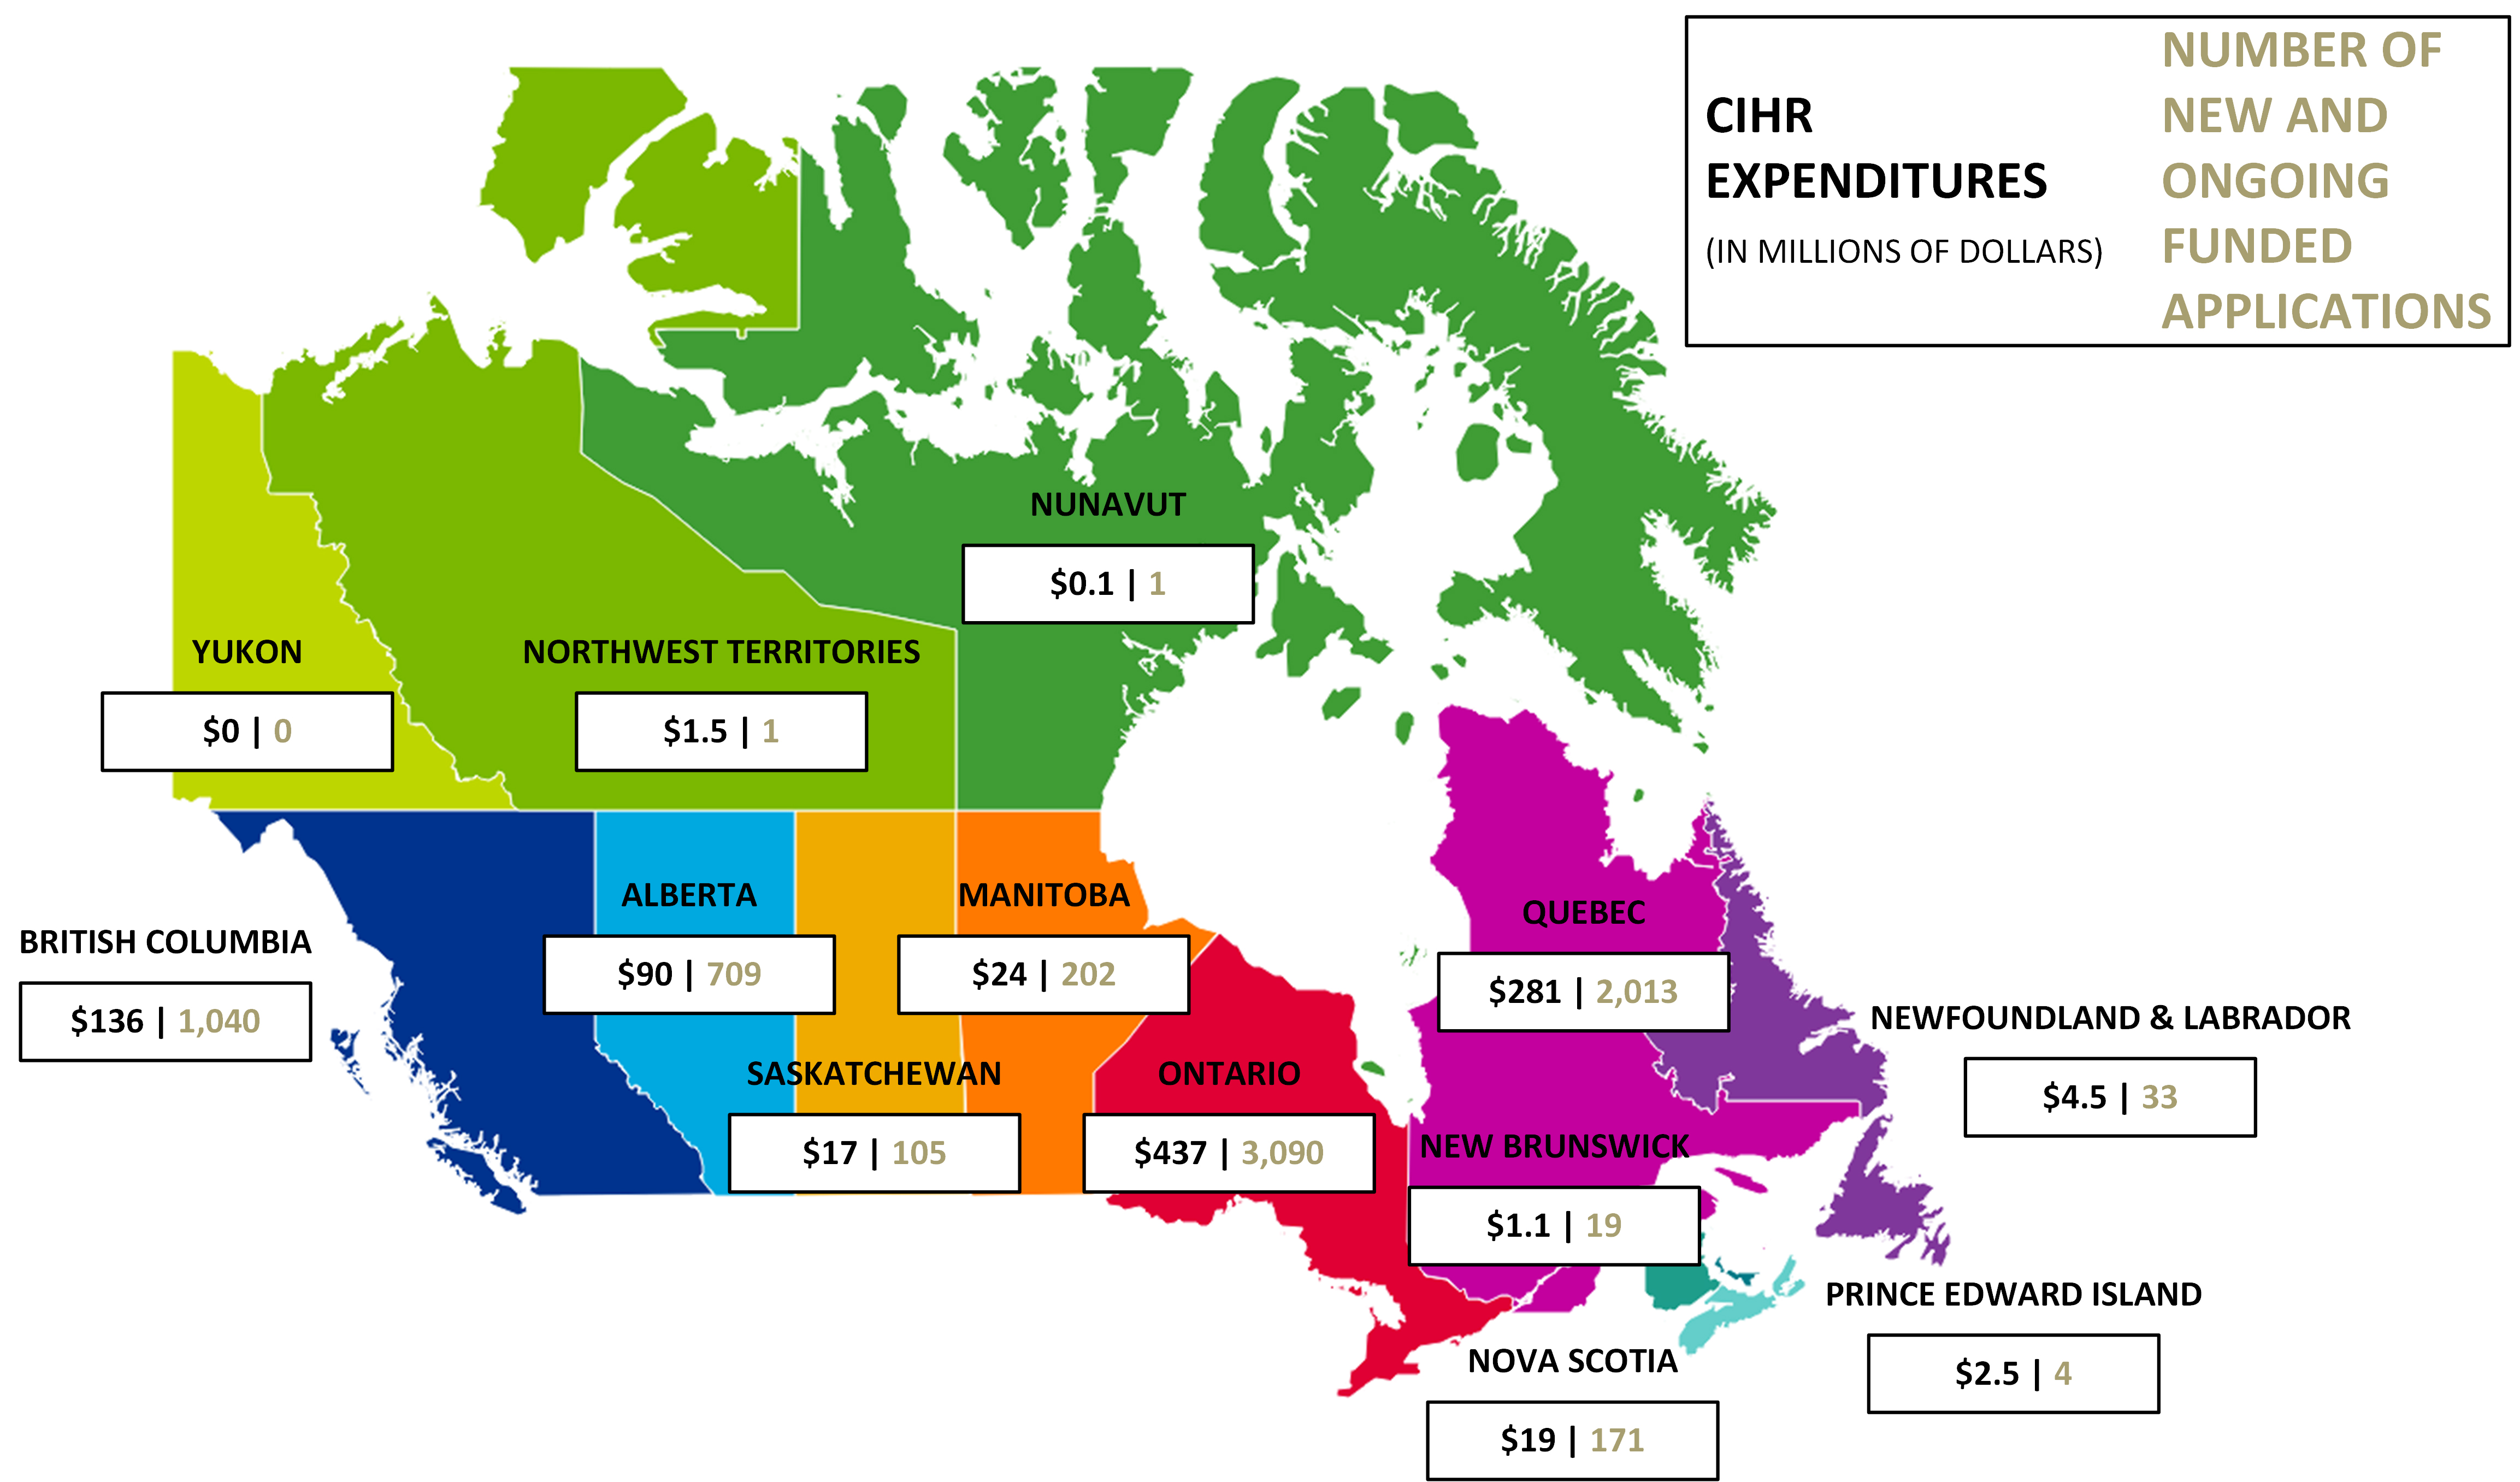
- Due to rounding, figures may not reconcile with other published information
- Excludes operating expenditures, partner contributions and direct payments
Figure 4 long description
| Region | CIHR Expenditures 2016-17 | Number of new and ongoing funded applications 2016-17 |
|---|---|---|
| Alberta | $90 | 709 |
| British Columbia | $136 | 1,040 |
| Manitoba | $24 | 202 |
| New Brunswick | $1.1 | 19 |
| Newfoundland & Labrador | $4.5 | 33 |
| North West Territories | $1.5 | 1 |
| Nova Scotia | $19 | 171 |
| Nunavut | $0.01 | 1 |
| Ontario | $437 | 3,090 |
| Prince Edward Island | $2.5 | 4 |
| Quebec | $281 | 2,013 |
| Saskatchewan | $17 | 105 |
| Yukon | $0 | 0 |
Figure 5a: Number of New and Ongoing Projects
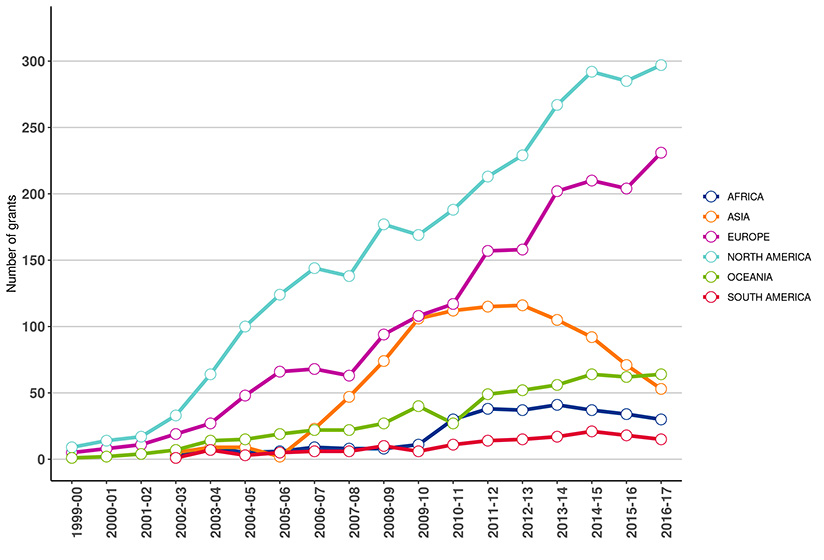
- Due to rounding as well as changes in methodology, figures may not reconcile with other published information
- Excludes operating expenditures and partner contributions
Figure 5a long description
| Continent | 1999-00 | 2000-01 | 2001-02 | 2002-03 | 2003-04 | 2004-05 | 2005-06 | 2006-07 | 2007-08 | 2008-09 | 2009-10 | 2010-11 | 2011-12 | 2012-13 | 2013-14 | 2014-15 | 2015-16 | 2016-17 |
|---|---|---|---|---|---|---|---|---|---|---|---|---|---|---|---|---|---|---|
| Africa | 0 | 0 | 0 | 3 | 9 | 5 | 6 | 9 | 8 | 8 | 11 | 30 | 38 | 37 | 41 | 37 | 34 | 30 |
| Europe | 5 | 8 | 11 | 19 | 27 | 48 | 66 | 68 | 63 | 94 | 108 | 117 | 157 | 158 | 202 | 210 | 204 | 231 |
| North America | 9 | 14 | 17 | 33 | 64 | 100 | 124 | 144 | 138 | 177 | 169 | 188 | 213 | 229 | 267 | 292 | 285 | 297 |
| Oceania | 1 | 2 | 4 | 7 | 14 | 15 | 19 | 22 | 22 | 27 | 40 | 27 | 49 | 52 | 56 | 64 | 62 | 64 |
| Asia | 0 | 0 | 0 | 5 | 9 | 9 | 2 | 23 | 47 | 74 | 106 | 112 | 115 | 116 | 105 | 92 | 71 | 53 |
| South America | 0 | 0 | 0 | 1 | 7 | 3 | 5 | 6 | 6 | 10 | 6 | 11 | 14 | 15 | 17 | 21 | 18 | 15 |
Figure 5b: Proportion of CIHR Grants with International linkages since 1999-00
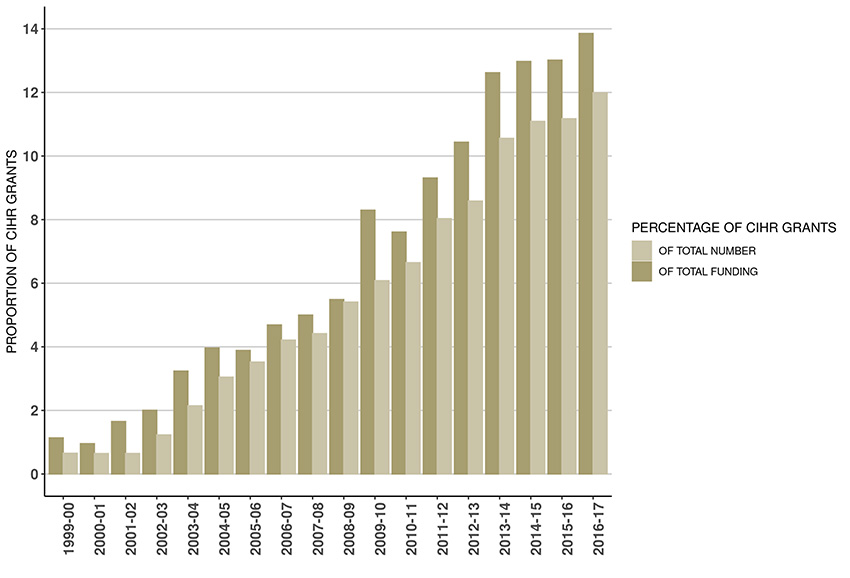
- Due to rounding as well as changes in methodology, figures may not reconcile with other published information
- Excludes operating expenditures and partner contributions
Figure 5b long description
| Proportion | 1999-00 | 2000-01 | 2001-02 | 2002-03 | 2003-04 | 2004-05 | 2005-06 | 2006-07 | 2007-08 | 2008-09 | 2009-10 | 2010-11 | 2011-12 | 2012-13 | 2013-14 | 2014-15 | 2015-16 | 2016-17 |
|---|---|---|---|---|---|---|---|---|---|---|---|---|---|---|---|---|---|---|
| Percentage of total CIHR | 1.1% | 1.0% | 1.7% | 2.0% | 3.2% | 4.0% | 3.9% | 4.7% | 5.0% | 5.5% | 8.3% | 7.6% | 9.3% | 10.4% | 12.6% | 13.0% | 13.0% | 13.9% |
| Percentage of total # of CIHR grants | 0.7% | 0.6% | 0.6% | 1.2% | 2.1% | 3.0% | 3.5% | 4.2% | 4.4% | 5.4% | 6.1% | 6.6% | 8.0% | 8.6% | 10.6% | 11.1% | 11.2% | 12.0% |
Figure 6: Countries with an International Linkage to a CIHR grants since 1999-00
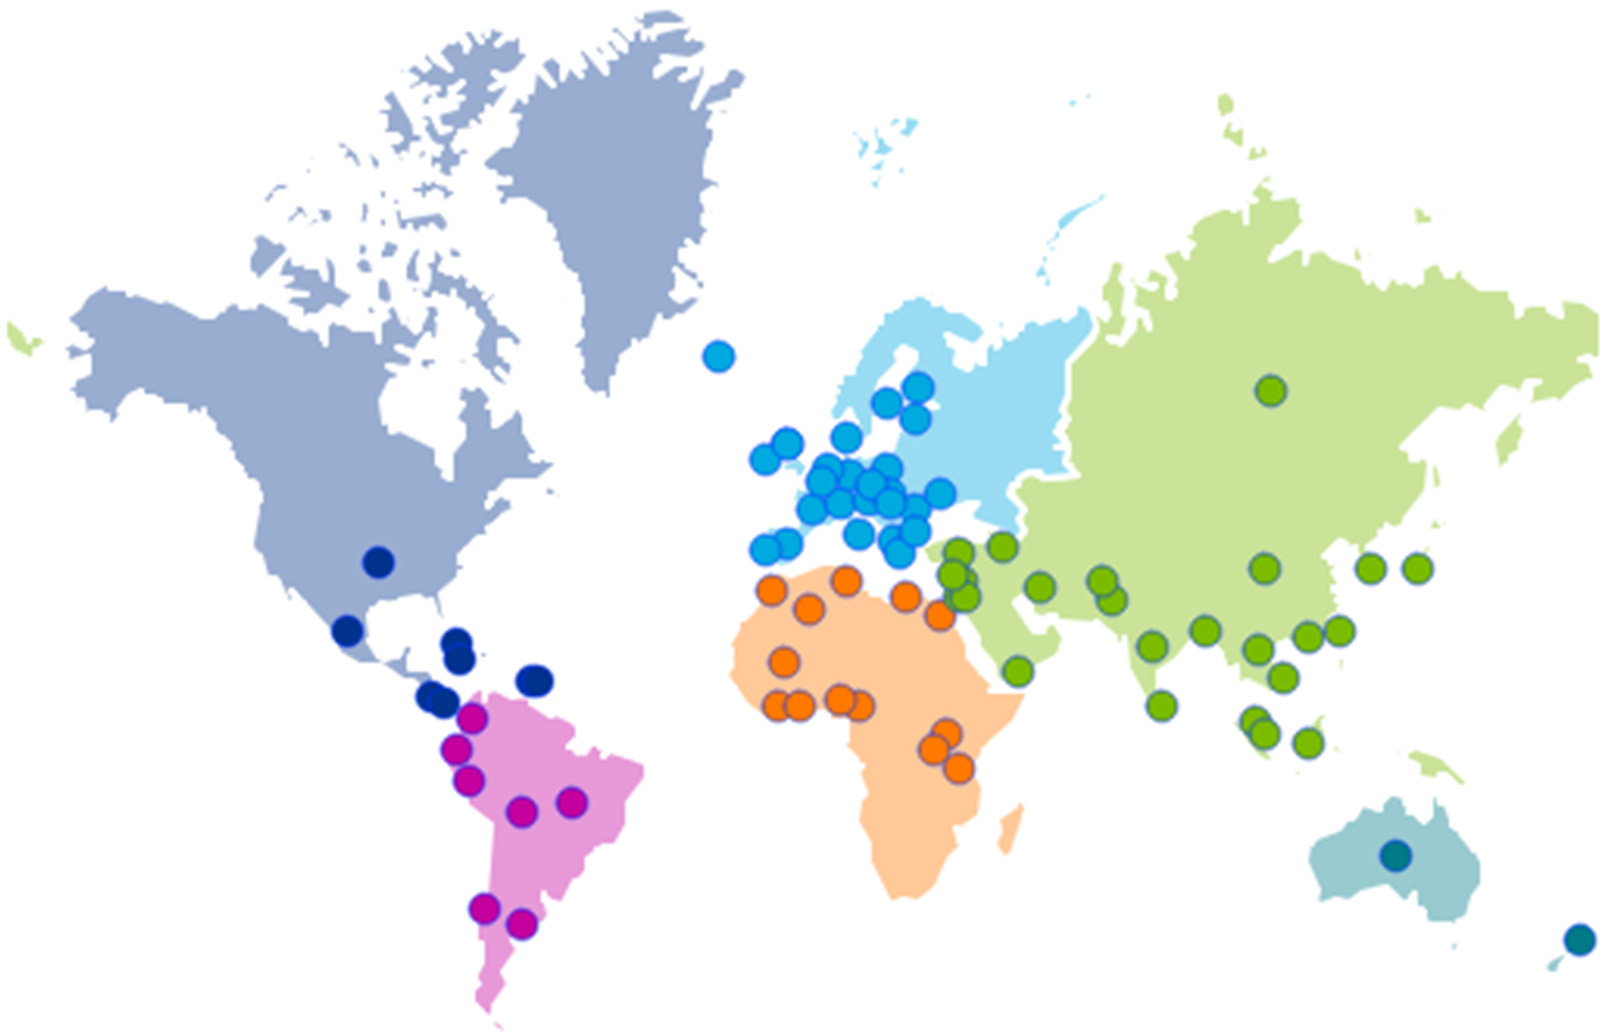
- Due to changes in methodology, figures may not reconcile with other published information
Figure 6 long description
| Countries |
|---|
| Afghanistan Argentina Australia Austria Bangladesh Barbados Belgium Benin Brazil Burkina Faso Cambodia Cameroon Chile China Colombia Costa Rica Croatia Cuba Cyprus Czech Republic Democratic Republic of the Congo Denmark Ecuador Egypt England Ethiopia Finland France Gabon Germany Ghana Greece Guatemala Guinea Haiti Hong Kong Hungary Iceland India Indonesia Iran Ireland Israel Italy Jamaica Japan Kenya Kuwait Lao People's Democratic Republic Latvia Lebanon Lithuania Luxembourg Malaysia Mali Mauritius Mexico Mongolia Netherlands New Zealand Niger Nigeria Norway Pakistan Peru Philippines Poland Portugal Puerto Rico Romania Russia Rwanda Saudi Arabia Scotland Senegal Singapore Slovakia South Africa South Korea Spain Sri Lanka Sudan Sweden Switzerland Taiwan Tanzania Thailand Turkey Uganda Ukraine United Kingdom United States Uruguay Vietnam Yugoslavia Zambia Zimbabwe |
Figure 7: Leveraged Partner Funding by Sector (in millions of dollars) – Cumulative totals from 1999-00 to 2016-17
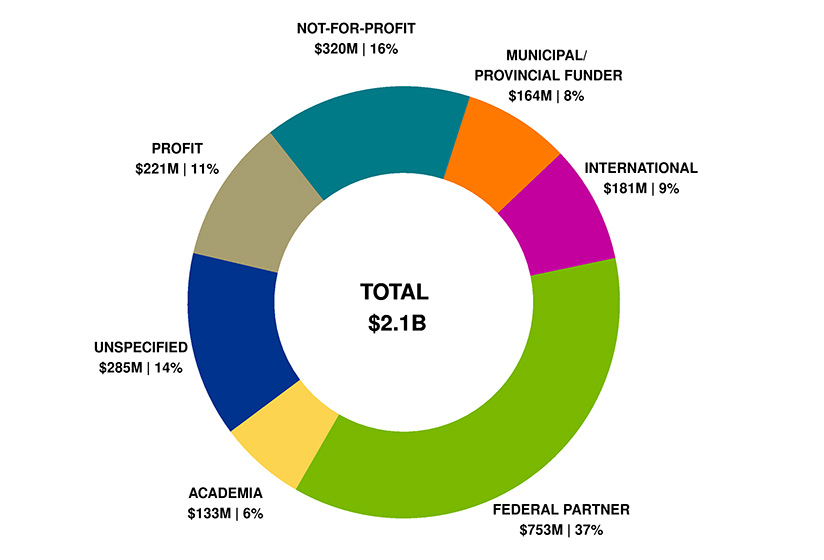
- Due to rounding, figures may not reconcile with other published information
- Includes partner contributions administered by CIHR, in kind and direct contributions from partner directly to the researcher
- Includes both competition and applicant partner contributions where there may or may not be a formal agreement with CIHR
Figure 7 long description
| Sector | Total | Percentage |
|---|---|---|
| Academia | $133 | 6% |
| Federal partners | $753 | 37% |
| International | $181 | 9% |
| Municipal/Provincial funder | $164 | 8% |
| Not-for-profit | $320 | 16% |
| Profit | $221 | 11% |
| Unspecified | $285 | 14% |
| Total | $2,056 | 100% |
Figure 8: Leveraged Partner Funding by Sector (in millions of dollars) – 2016-17
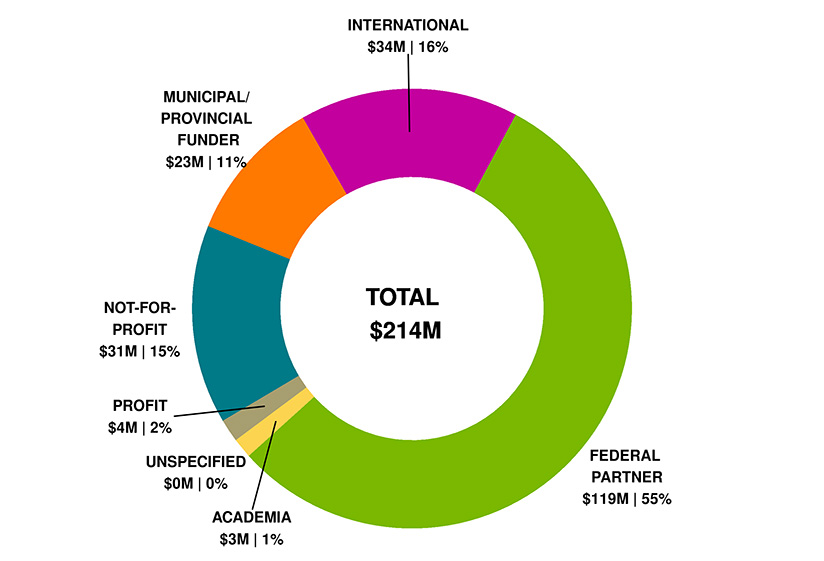
- Due to rounding, figures may not reconcile with other published information
- Includes partner contributions administered by CIHR, in kind and direct contributions from partner directly to the researcher
- Includes both competition and applicant partner contributions where there may or may not be a formal agreement with CIHR
Figure 8 long description
| Sector | Total | Percentage |
|---|---|---|
| Academia | $3 | 1% |
| Federal partner | $119 | 55% |
| International | $34 | 16% |
| Municipal/Provincial funder | $23 | 11% |
| Not-for-profit | $31 | 15% |
| Profit | $4 | 2% |
| Unspecified | <$1 | <1% |
| Total | $214 | 100% |
Date modified:
2024-09-27