population, maps, real estate, averages, homes, statistics, relocation, travel, jobs, hospitals, schools, crime, moving, houses, news, sex offenders (original) (raw)
Madison, Wisconsin
Submit your own pictures of this city and show them to the world
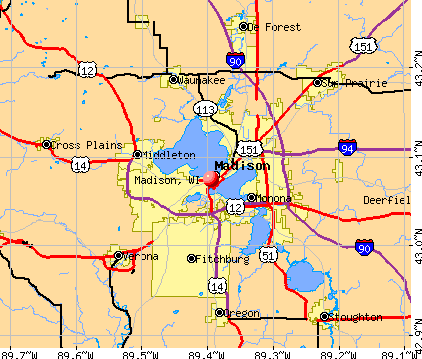
OSM Map
General Map
Google Map
MSN Map
OSM Map
General Map
Google Map
MSN Map
OSM Map
General Map
Google Map
MSN Map
OSM Map
General Map
Google Map
MSN Map
Please wait while loading the map...
Current weather forecast for Madison, WI
Population in 2022: 272,903 (100% urban, 0% rural).
Population change since 2000: +31.2%
| Median resident age: | 32.2 years |
|---|---|
| Wisconsin median age: | 40.4 years |
Zip codes: 53562, 53590, 53597, 53703, 53704, 53705, 53706, 53714, 53715, 53716, 53717, 53726, 53792.
Estimated median household income in 2022: 73,647(∗∗itwas∗∗73,647 (it was 73,647(∗∗itwas∗∗41,941 in 2000)
| Madison: | $73,647 |
|---|---|
| WI: | $70,996 |
Estimated per capita income in 2022: 46,834(∗∗itwas∗∗46,834 (it was 46,834(∗∗itwas∗∗23,498 in 2000)
Madison city income, earnings, and wages data
Estimated median house or condo value in 2022: 358,500(∗∗itwas∗∗358,500 (it was 358,500(∗∗itwas∗∗137,700 in 2000)
| Madison: | $358,500 |
|---|---|
| WI: | $252,800 |
Mean prices in 2022: all housing units: 379,998;∗∗detachedhouses:∗∗379,998; detached houses: 379,998;∗∗detachedhouses:∗∗403,546; townhouses or other attached units: 275,478;∗∗in2−unitstructures:∗∗275,478; in 2-unit structures: 275,478;∗∗in2−unitstructures:∗∗428,224; in 3-to-4-unit structures: 295,357;∗∗in5−or−more−unitstructures:∗∗295,357; in 5-or-more-unit structures: 295,357;∗∗in5−or−more−unitstructures:∗∗308,250; mobile homes: $24,586
Median gross rent in 2022: $1,260.
March 2022 cost of living index in Madison: 97.9 (near average, U.S. average is 100)
Madison, WI residents, houses, and apartments details
Percentage of residents living in poverty in 2022: 17.2%
(15.0% for White Non-Hispanic residents, 22.3% for Black residents, 18.6% for Hispanic or Latino residents, 21.0% for American Indian residents, 16.2% for other race residents, 20.5% for two or more races residents)
Detailed information about poverty and poor residents in Madison, WI

Profiles of local businesses
Business Search - 14 Million verified businesses
- 193,39270.9%White alone
- 22,5098.2%Hispanic
- 21,6637.9%Black alone
- 19,0787.0%Asian alone
- 15,3295.6%Two or more races
- 7720.3%Other race alone
- 870.03%American Indian alone
- 770.03%Native Hawaiian and Other
Pacific Islander alone
Races in Madison detailed stats: ancestries, foreign born residents, place of birth
According to our research of Wisconsin and other state lists, there were 561 registered sex offenders living in Madison, Wisconsin as of September 19, 2024.
The ratio of all residents to sex offenders in Madison is 450 to 1.
The ratio of registered sex offenders to all residents in this city is lower than the state average.
Crime rates in Madison by year
| Type | 2009 | 2010 | 2011 | 2012 | 2013 | 2014 | 2015 | 2016 | 2017 | 2018 | 2019 | 2020 | 2021 | 2022 |
|---|---|---|---|---|---|---|---|---|---|---|---|---|---|---|
| Murders(per 100,000) | 4(1.7) | 2(0.9) | 7(3.0) | 3(1.3) | 5(2.1) | 5(2.0) | 6(2.4) | 8(3.2) | 10(3.9) | 5(1.9) | 4(1.5) | 10(3.8) | 10(3.8) | 6(2.2) |
| Rapes(per 100,000) | 28(11.9) | 88(37.7) | 79(33.7) | 115(48.4) | 76(31.3) | 86(35.0) | 123(49.4) | 127(50.4) | 97(37.9) | 115(44.5) | 116(44.4) | 76(28.9) | 110(41.3) | 85(31.5) |
| Robberies(per 100,000) | 364(155.2) | 327(140.2) | 272(116.1) | 241(101.5) | 296(122.1) | 226(91.9) | 219(88.0) | 235(93.2) | 212(82.9) | 224(86.7) | 216(82.7) | 166(63.2) | 141(53.0) | 113(41.9) |
| Assaults(per 100,000) | 457(194.9) | 522(223.8) | 462(197.2) | 539(226.9) | 508(209.5) | 529(215.2) | 543(218.2) | 465(184.4) | 642(250.9) | 667(258.1) | 613(234.6) | 602(229.1) | 567(213.0) | 606(224.8) |
| Burglaries(per 100,000) | 1,523(649.6) | 1,647(706.2) | 1,440(614.8) | 1,601(674.1) | 1,382(569.8) | 1,132(460.6) | 1,198(481.4) | 1,014(402.2) | 927(362.3) | 1,053(407.4) | 1,049(401.5) | 1,306(497.1) | 973(365.5) | 921(341.7) |
| Thefts(per 100,000) | 6,015(2,565) | 6,027(2,584) | 6,157(2,629) | 5,910(2,488) | 6,096(2,514) | 5,611(2,283) | 5,468(2,197) | 5,549(2,201) | 5,457(2,133) | 5,112(1,978) | 4,877(1,867) | 5,367(2,043) | 5,038(1,893) | 4,866(1,805) |
| Auto thefts(per 100,000) | 346(147.6) | 368(157.8) | 345(147.3) | 254(106.9) | 254(104.7) | 246(100.1) | 249(100.1) | 373(147.9) | 432(168.8) | 526(203.5) | 546(209.0) | 649(247.0) | 711(267.1) | 672(249.3) |
| Arson(per 100,000) | 87(37.1) | 75(32.2) | 57(24.3) | 45(18.9) | 50(20.6) | 10(4.1) | 7(2.8) | 19(7.5) | 10(3.9) | 16(6.2) | 9(3.4) | 15(5.7) | 14(5.3) | 21(7.8) |
| City-Data.com crime index | 258.4 | 284.2 | 267.2 | 272.4 | 256.5 | 234.3 | 244.0 | 239.5 | 237.4 | 241.0 | 229.8 | 231.8 | 221.7 | 203.3 |
The City-Data.com crime index weighs serious crimes and violent crimes more heavily. Higher means more crime, U.S. average is 246.1. It adjusts for the number of visitors and daily workers commuting into cities.
- means the value is smaller than the state average.
- means the value is about the same as the state average.
- means the value is bigger than the state average.
- means the value is much bigger than the state average.
Click on a table row to update graph
Crime rate in Madison detailed stats: murders, rapes, robberies, assaults, burglaries, thefts, arson
Full-time law enforcement employees in 2021, including police officers: 9 (8 officers - 8 male; 0 female).
| Officers per 1,000 residents here: | 1.19 |
|---|---|
| Wisconsin average: | 2.07 |
Latest news from Madison, WI collected exclusively by city-data.com from local newspapers, TV, and radio stations
Madison, WI City Guides:
Ancestries: German (19.2%), Irish (5.5%), African (3.9%), Norwegian (3.6%), English (3.6%), European (3.5%).
Current Local Time: CST time zone
Incorporated in 1856
Elevation: 863 feet
Land area: 68.7 square miles.
Population density: 3,974 people per square mile (average).
30,380 residents are foreign born (5.7% Asia, 2.9% Latin America, 1.5% Europe).
| This city: | 11.1% |
|---|---|
| Wisconsin: | 5.0% |
Median real estate property taxes paid for housing units with mortgages in 2022: $6,207 (1.7%)
Median real estate property taxes paid for housing units with no mortgage in 2022: $6,203 (1.8%)
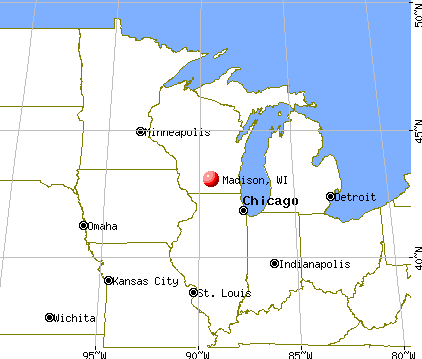
Nearest city with pop. 1,000,000+: Chicago, IL (122.3 miles , pop. 2,896,016).
Nearest cities:
Latitude: 43.07 N**, Longitude:** 89.39 W
Daytime population change due to commuting: +42,127 (+15.4%)
Workers who live and work in this city: 115,209 (74.5%)
Area code: 608

Detailed articles:
- Madison: Introduction
- Madison Basic Facts
- Madison: Communications
- Madison: Convention Facilities
- Madison: Economy
- Madison: Education and Research
- Madison: Geography and Climate
- Madison: Health Care
- Madison: History
- Madison: Municipal Government
- Madison: Population Profile
- Madison: Recreation
- Madison: Transportation
Madison tourist attractions:
- Outdoor Destination for Garden Enthusiasts
- Alliant Energy Center Hosts Numerous Events
- Art and Culture
- Convenient Destination in State Capital
- Hotel with Class in Madison
- Henry Vilas Zoo in Madison, Wisconsin
- A Place to Stay in Madison
- Home of the Wisconsin Badgers
- Relaxing Site for Outdoor Recreation
- Wisconsin's State Capital
- Education and Fun in the State Capital
- Unique Luxury Accommodations in Madison
- Madison's Market Offers Food and Crafts
- Meeting and Event Center on the Lake
- Enjoyable Nature Environment
- New Art Center in Madison
- Exciting Street in Madison
- History and Learning in Wisconsin
- Nature Learning in the State Capital
- Explore Your History
- A Madison Gem
- Visiting Politics in Action
Madison, Wisconsin accommodation & food services, waste management - Economy and Business Data
Single-family new house construction building permits:
- 2022: 314 buildings , average cost: $337,300
- 2021: 327 buildings , average cost: $354,000
- 2020: 406 buildings , average cost: $336,500
- 2019: 426 buildings , average cost: $304,400
- 2018: 334 buildings , average cost: $342,500
- 2017: 379 buildings , average cost: $274,300
- 2016: 340 buildings , average cost: $260,700
- 2015: 300 buildings , average cost: $287,400
- 2014: 235 buildings , average cost: $207,000
- 2013: 217 buildings , average cost: $198,700
- 2012: 161 buildings , average cost: $190,500
- 2011: 177 buildings , average cost: $194,900
- 2010: 186 buildings , average cost: $195,600
- 2009: 191 buildings , average cost: $191,500
- 2008: 148 buildings , average cost: $243,800
- 2007: 374 buildings , average cost: $201,500
- 2006: 429 buildings , average cost: $193,300
- 2005: 628 buildings , average cost: $183,100
- 2004: 829 buildings , average cost: $180,300
- 2003: 961 buildings , average cost: $165,300
- 2002: 998 buildings , average cost: $158,700
- 2001: 843 buildings , average cost: $153,100
- 2000: 638 buildings , average cost: $135,500
- 1999: 552 buildings , average cost: $125,800
- 1998: 410 buildings , average cost: $137,400
- 1997: 362 buildings , average cost: $137,000
Unemployment in December 2023:
Population change in the 1990s: +16,504 (+8.6%).
Most common industries in Madison, WI (%)
- Educational services (17.9%)
- Professional, scientific, technical services (11.4%)
- Health care (11.1%)
- Accommodation & food services (8.0%)
- Finance & insurance (6.1%)
- Public administration (4.6%)
- Administrative & support & waste management services (3.0%)
Most common occupations in Madison, WI (%)
- Computer specialists (7.2%)
- Other management occupations, except farmers and farm managers (5.9%)
- Cooks and food preparation workers (5.0%)
- Postsecondary teachers (3.9%)
- Laborers and material movers, hand (3.3%)
- Life and physical scientists (2.8%)
- Customer service representatives (2.6%)
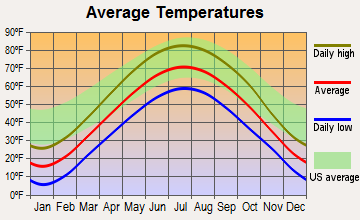
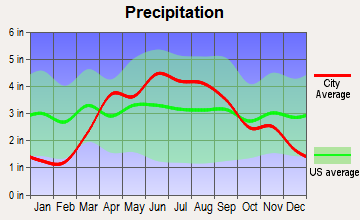
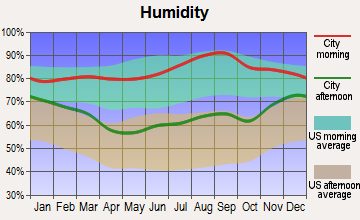
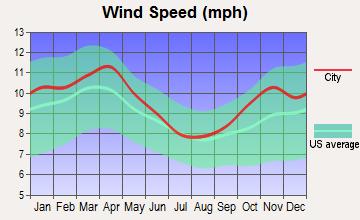
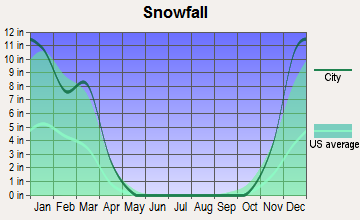
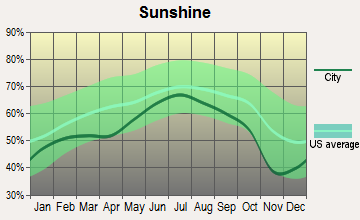
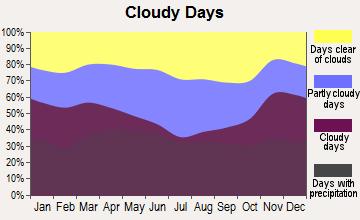
Average climate in Madison, Wisconsin
Based on data reported by over 4,000 weather stations

Air pollution and air quality trends (lower is better)
Air Quality Index (AQI) level in 2022 was 67.3**. This is about average.**
Tornado activity:
Madison-area historical tornado activity is above Wisconsin state average. It is 72% greater than the overall U.S. average.
On 6/7/1984**, a** category F5 (max. wind speeds 261-318 mph) tornado 15.5 miles away from the Madison city center killed 9 people and injured 200 people and caused between 50,000∗∗and∗∗50,000 and 50,000∗∗and∗∗500,000 in damages.
On 9/26/1951**, a** category F4 (max. wind speeds 207-260 mph) tornado 28.3 miles away from the city center killed one person and injured 9 people and caused between 50,000∗∗and∗∗50,000 and 50,000∗∗and∗∗500,000 in damages.
Earthquake activity:
Madison-area historical earthquake activity is significantly above Wisconsin state average. It is 37% greater than the overall U.S. average.
On 4/18/2008 at 09:36:59**, a magnitude** 5.4 (5.1 MB**,** 4.8 MS**,** 5.4 MW**,** 5.2 MW**, Class:** Moderate**, Intensity:** VI - VII) earthquake occurred 329.3 miles away from the city center
On 6/28/2004 at 06:10:52**, a magnitude** 4.2 (4.2 MW**, Depth:** 6.2 mi**, Class:** Light**, Intensity:** IV - V) earthquake occurred 114.5 miles away from Madison center
On 6/10/1987 at 23:48:54**, a magnitude** 5.1 (4.9 MB**,** 4.4 MS**,** 4.6 MS**,** 5.1 LG) earthquake occurred 304.6 miles away from Madison center
On 4/18/2008 at 09:36:59**, a magnitude** 5.2 (5.2 MW**, Depth:** 8.9 mi) earthquake occurred 329.4 miles away from Madison center
On 2/10/2010 at 09:59:35**, a magnitude** 3.8 (3.8 MW**, Depth:** 6.2 mi**, Class:** Light**, Intensity:** II - III) earthquake occurred 89.1 miles away from the city center
On 5/2/2015 at 16:23:07**, a magnitude** 4.2 (4.2 MW**, Depth:** 2.8 mi) earthquake occurred 209.9 miles away from Madison center
Magnitude types: regional Lg-wave magnitude (LG), body-wave magnitude (MB), surface-wave magnitude (MS), moment magnitude (MW)
Natural disasters:
The number of natural disasters in Dane County (18) is near the US average (15).
Major Disasters (Presidential) Declared: 13
Emergencies Declared: 4
Causes of natural disasters: Storms: 12**, Floods:** 9**, Tornadoes:** 8**, Winds:** 2**, Winter Storms:** 2**, Drought:** 1**, Hurricane:** 1**, Landslide:** 1**, Snow:** 1**, Snowstorm:** 1**, Other:** 1 (Note: some incidents may be assigned to more than one category).

Main business address for: ANCHOR BANCORP WISCONSIN INC (SAVINGS INSTITUTIONS, NOT FEDERALLY CHARTERED), SONIC FOUNDRY INC (RADIO & TV BROADCASTING & COMMUNICATIONS EQUIPMENT), ALLIANT ENERGY CORP (ELECTRIC & OTHER SERVICES COMBINED), Great Wolf Resorts, Inc. (HOTELS & MOTELS), THIRD WAVE TECHNOLOGIES INC /WI (BIOLOGICAL PRODUCTS (NO DIAGNOSTIC SUBSTANCES)), MGE ENERGY INC (ELECTRIC, GAS & SANITARY SERVICES), MADISON GAS & ELECTRIC CO (ELECTRIC & OTHER SERVICES COMBINED).
Hospitals in Madison:
- CENTRAL WI CTR FDD (317 KNUTSON DR)
- HCA PARKWAY HOSPITAL (6001 RESEARCH PARK BLVD)
- HOSPICECARE (5395 E CHERYL PKWY)
- MADISON VA MEDICAL CENTER (Government Federal, provides emergency services, 2500 OVERLOOK TERRACE)
- MENDOTA MENTAL HLTH INSTITUTE (301 TROY DR)
- MERITER HSPTL (Voluntary non-profit - Private, 202 S PARK ST)
- METHODIST HOSPITAL (309 WEST WASHINGTON AVENUE)
- SOUTHERNCARE MADISON (402 GAMMON PLACE STE 110)
- ST MARY'S HOSPITAL (Voluntary non-profit - Other, 700 SOUTH PARK ST)
- UNIVERSITY OF WI HOSPITALS & CLINICS AUTHORITY (Government - Hospital District or Authority, 600 HIGHLAND AVENUE)
Airports and heliports located in Madison:
- Dane County Regional-Truax Field Airport (MSN) (Runways: 3, Commercial Ops:** 15,479**, Air Taxi Ops:** 21,074**, Itinerant Ops:** 21,571**, Local Ops:** 25,262**, Military Ops:** 7,124)
- Blackhawk Airfield Airport (87Y) (Runways: 2, Itinerant Ops:** 1,000**, Local Ops:** 1,000)
- Army Guard Heliport (WI94)
- Meriter/Park Heliport (WI93)
- St Marys Hospital Heliport (WS52)
- Uw Hospital & Clinics Heliport (WS27) See details about Airports and heliports located in Madison**,** WI
Amtrak station:
MADISON (800 LANGDON ST.) - Bus Station . Services: enclosed waiting area, public payphones, public transit connection.
Colleges/Universities in Madison:
- University of Wisconsin-Madison (Full-time enrollment: 34,621; Location: 500 Lincoln Dr; Public; Website: www.wisc.edu; Offers Doctor's degree)
- University of Wisconsin Colleges (Full-time enrollment: 10,019; Location: 780 Regent St; Public; Website: www.uwc.edu)
- Madison Area Technical College (Full-time enrollment: 9,603; Location: 1701 Wright St; Public; Website: madisoncollege.edu)
- Herzing University-Madison (Full-time enrollment: 3,160; Location: 5218 E. Terrace Dr.; Private, for-profit; Website: www.Herzing.edu; Offers Master's degree)
- Edgewood College (Full-time enrollment: 2,455; Location: 1000 Edgewood College Drive; Private, not-for-profit; Website: www.edgewood.edu; Offers Doctor's degree)
- Madison Media Institute (Full-time enrollment: 602; Location: 2702 Agriculture Drive; Private, for-profit; Website: www.mediainstitute.edu/madison)
- Globe University-Madison East (Full-time enrollment: 274; Location: 4901 Eastpark Blvd; Private, for-profit; Website: www.globeuniversity.edu/)
- ITT Technical Institute-Madison (Full-time enrollment: 194; Location: 2450 Rimrock Road, Ste 100; Private, for-profit; Website: www.itt-tech.edu)
- Advanced Institute of Hair Design-Madison (Full-time enrollment: 135; Location: 353 E. Campus Mall; Private, for-profit; Website: www.vicibeautyschool.com)
- University of Phoenix-Madison Campus (Full-time enrollment: 122; Location: 2310 Crossroads Dr; Private, for-profit; Website: www.phoenix.edu; Offers Master's degree)
- Empire Beauty School-Madison (Full-time enrollment: 117; Location: 6414 Odana Road; Private, for-profit; Website: www.empire.edu)
- Regency Beauty Institute-Madison (Full-time enrollment: 74; Location: 2358 East Springs Drive, Suite 300; Private, for-profit; Website: www.regency.edu)
- University of Wisconsin-System Administration (Location: 1220 Linden Dr; Public; Website: www.wisconsin.edu; Offers Doctor's degree)
- University of Wisconsin Extension (Location: 432 N Lake St; Public; Website: uwex.edu/; Offers Doctor's degree)
- Herzing University (Location: 3 Point Place; Private, for-profit; Offers Master's degree)
Public high schools in Madison:
- MEMORIAL HIGH (Students: 1,922, Location: 201 S GAMMON RD, Grades: 9-12)
- LAFOLLETTE HIGH (Students: 1,541, Location: 702 PFLAUM RD, Grades: 9-12)
- SHABAZZ-CITY HIGH (Students: 116, Location: 1601 N SHERMAN AVE, Grades: 9-12)
- METRO SCHOOL (Students: 26, Location: 115 W DOTY ST, Grades: 4-12)
- CENTRAL WISCONSIN CENTER (Location: 317 KNUTSON DR, Grades: PK-12)
- MENDOTA MENTAL HEALTH INSTITUTION (Location: 301 TROY DR, Grades: PK-12)
- EAST HIGH (Location: 2222 E WASHINGTON AVE, Grades: 9-12)
- WEST HIGH (Location: 30 ASH ST, Grades: 9-12)
- INNOVATIVE & ALTERNATIVE HIGH (Location: 1045 E DAYTON ST, Grades: 9-12)
Private high schools in Madison:
- EDGEWOOD HIGH SCHOOL OF THE SCARED HEART (Students: 622, Location: 2219 MONROE ST, Grades: 9-12)
- ABUNDANT LIFE CHRISTIAN SCHOOL (Students: 258, Location: 4901 E BUCKEYE RD, Grades: PK-12)
- ST AMBROSE ACADEMY (Students: 69, Location: 602 EVERGLADE DR, Grades: 6-12)
- WALBRIDGE SCHOOL (Students: 20, Location: 7035 OLD SAUK RD, Grades: 3-9)
- MADISON BAPTIST ACADEMY (Students: 11, Location: 2323 PORTAGE RD, Grades: UG-11)
- HORIZON HIGH SCHOOL (Students: 8, Location: 29 S MILLS ST, Grades: 9-11)
Biggest public elementary/middle schools in Madison:
- HAMILTON MIDDLE (Students: 717, Location: 4801 WAUKESHA ST, Grades: 6-8)
- CESAR CHAVEZ ELEMENTARY (Students: 690, Location: 3502 MAPLE GROVE DR, Grades: PK-5)
- LEOPOLD ELEMENTARY (Students: 667, Location: 2602 POST RD, Grades: PK-5)
- STEPHENS ELEMENTARY (Students: 597, Location: 120 S ROSA RD, Grades: PK-5)
- SHOREWOOD HILLS ELEMENTARY (Students: 591, Location: 1105 SHOREWOOD BLVD, Grades: PK-5)
- SENNETT MIDDLE (Students: 588, Location: 502 PFLAUM RD, Grades: 6-8)
- JEFFERSON MIDDLE (Students: 554, Location: 101 S GAMMON RD, Grades: 6-8)
- CHEROKEE HEIGHTS MIDDLE (Students: 537, Location: 4301 CHEROKEE DR, Grades: 6-8)
- GLENDALE ELEMENTARY (Students: 506, Location: 1201 TOMPKINS DR, Grades: PK-5)
- SCHENK ELEMENTARY (Students: 504, Location: 230 SCHENK ST, Grades: PK-5)
Biggest private elementary/middle schools in Madison:
- OUR LADY QUEEN OF PEACE SCHOOL (Students: 497, Location: 418 HOLLY AVE, Grades: PK-8)
- ST MARIA GORETTI ELEMENTARY SCHOOL (Students: 466, Location: 5405 FLAD AVE, Grades: PK-8)
- HIGH POINT CHRISTIAN SCHOOL (Students: 315, Location: 7702 OLD SAUK RD, Grades: PK-8)
- BLESSED SACRAMENT SCHOOL (Students: 307, Location: 2112 HOLLISTER AVE, Grades: PK-8)
- EDGEWOOD CAMPUS SCHOOL (Students: 290, Location: 829 EDGEWOOD COLLEGE DR, Grades: PK-8)
- ST JAMES CATHOLIC SCHOOL (Students: 198, Location: 1204 SAINT JAMES CT, Grades: PK-8)
- EASTSIDE LUTHERAN SCHOOL (Students: 139, Location: 2310 INDEPENDENCE LN, Grades: PK-8)
- WINGRA SCHOOL (Students: 132, Location: 718 GILMORE ST, Grades: KG-8)
- OUR REDEEMER EVANGELICAL LUTHERAN SCHOOL (Students: 120, Location: 1701 MCKENNA BLVD, Grades: PK-8)
- MADISON CENTRAL MONTESSORI (Students: 107, Location: 4337 W BELTLINE HWY, Grades: PK-8)
See full list of schools located in Madison
Library in Madison:
- MADISON PUBLIC LIBRARY (Operating income: $13,076,960; Location: 201 W. MIFFLIN ST.; 785,574 books; 8,370 e-books; 71,220 audio materials; 74,450 video materials; 4 local licensed databases; 28 state licensed databases; 10 other licensed databases; 1,835 print serial subscriptions; 2 electronic serial subscriptions)
User-submitted facts and corrections:
- Wcjz 96.3 is now wmad
Points of interest:
Click to draw/clear city borders
Notable locations in Madison: Camp Randall Stadium (A), Annie C Stewart Memorial Fountain (B), Allen Centennial Gardens (C), Blackhawk Country Club (D), Glenway Golf Course (E), Nakoma Country Club (F), Odana Hills Golf Course (G), Oakwood Home (H), Madison Prairie Landfill (I), Franklin Field (J), Fitchburg Field (K), Yahara Hills Golf Course (L), Washburn Observatory (M), Spaghetti Corners (N), Nielsen Tennis Stadium (O), Wisconsin State Capitol (P), White Hall (Q), Wisconsin Veterans Museum (R), Wisconsin State Historical Society and Library (S), Wisconsin Center (T). Display/hide their locations on the map
Shopping Centers: Fiore Shopping Center (1), Essex Square Shopping Center (2), East Towne Mall Shopping Center (3), Camelot Square Shopping Center (4), Brookwood Village Shopping Center (5), Hilldale Shopping Center (6), Heritage Square Shopping Center (7), University Square Shopping Center (8), Whitney Square Shopping Center (9). Display/hide their locations on the map
Main business address in Madison include: ANCHOR BANCORP WISCONSIN INC (A), SONIC FOUNDRY INC (B), ALLIANT ENERGY CORP (C), Great Wolf Resorts, Inc. (D), THIRD WAVE TECHNOLOGIES INC /WI (E), MGE ENERGY INC (F), MADISON GAS & ELECTRIC CO (G). Display/hide their locations on the map
Churches in Madison include: Abundant Life Church (A), Beth Israel Center (B), Bethel Lutheran Church (C), Faith Bible Church (D), First Baptist Church (E), First Unitarian Church (F), First United Church of Christ (G), Gates of Heaven Synagogue (H), Grace Episcopal Church (I). Display/hide their locations on the map
Cemeteries: Resurrection Cemetery (1), Hoepker Cemetery (2), Holy Cross Cemetery (3), Sunset Memory Gardens (4), Blooming Grove Cemetery (5), Forest Hill Cemetery (6), Calvary Cemetery (7). Display/hide their locations on the map
Lakes: Cherokee Lake (A), Lake Mendota (B), Lake Monona (C). Display/hide their locations on the map
Creeks: Wingra Creek (A), Starkweather Creek (B). Display/hide their locations on the map
Parks in Madison include: Brittingham Park (1), Burrows Park (2), Clarke Park (3), Garner Park (4), Hoyt Park (5), Law Park (6), Olbrich Park (7), Olin Park (8), Orton Park (9). Display/hide their locations on the map
Tourist attractions: Madison Children's Museum (100 State Street) (1), Elvehjem Museum of Art - Museum Shop (800 University Avenue) (2), Barr Productions Museum (4510 Monona Drive) (3), Elvehjem Museum of Art - Office (800 University Avenue) (4), Geology Museum (1215 West Dayton Street) (5), Madison Museum of Contemporary Art Office (222 West Washington Avenue) (6), High Point Church (Cultural Attractions- Events- & Facilities; 7702 Old Sauk Road) (7), Cooperative Children's Book Center (Cultural Attractions- Events- & Facilities; 600 North Park Street) (8), Henry Vilas Park Zoological Society (Cultural Attractions- Events- & Facilities; 702 South Randall Avenue) (9). Display/hide their approximate locations on the map
Hotels: Comfort Inn Madison (4822 East Washington Avenue) (1), Howard Johnson-Plaza Hotel (525 West Johnson Street) (2), Country Inn Sts Madison (400 River Place) (3), Best Western East Towne Stes (4801 Annamark Drive) (4), Highlander Motor Inn (4353 West Beltline Highway) (5), Annie's Garden Bed and Breakfast (2117 Sheridan Drive) (6), Collins House Bed & Breakfast (704 East Gorham Street) (7), Econo Lodge Madison (4726 East Washington Avenue) (8), Hotel Ruby Marie (524 East Wilson Street) (9). Display/hide their approximate locations on the map
Courts: Wisconsin State - Supreme Court- Director Of State Courts' Office- Legislative Lia (16 East State Capitol) (1), Courts - Federal - Bankruptcy Court- Clerk's Office (120 North Henry Street Suite 340) (2), Wisconsin State - Supreme Court- Director Of State Courts' Office- Judicial Educa (110 East Main Street) (3), Wisconsin State - Supreme Court- Director Of State Courts' Office- Fiscal Off (110 East Main Street) (4), Wisconsin State - Supreme Court- Director Of State Courts' Office (16 East State Capitol) (5), Wisconsin State - Supreme Court- Deputy Marshal (110 East Main Street) (6), Wisconsin State - Supreme Court- Board Of Bar Examiners (110 East Main Street) (7), Wisconsin State - Court Of Appeals-District Iv- Supreme Court- Clerk (110 East Main Street) (8), Wisconsin State - Court Of Appeals-District Iv- Judges Office (10 East Doty Street) (9). Display/hide their approximate locations on the map
Birthplace of: Rick Neuheisel - College football player**,** Tammy Baldwin - Politician**,** Kris Kobach - Legal scholar**,** Phil Kessel - Ice hockey player**,** Phil Hellmuth - Professional poker player**,** Elizabeth Cheney - Political pundit**,** John A. List - Economist**,** Wayne Morse - Politician**,** Hendrik Wade Bode - Scientist**,** Kevin Barrett - Writer.
Dane County has a predicted average indoor radon screening level greater than 4 pCi/L (pico curies per liter) - Highest Potential
Drinking water stations with addresses in Madison and their reported violations in the past:
WI DOT REST AREA 12 DEKORRA WEST BOUND (Population served: 3,905**,** Groundwater):
Past health violations:
- MCL, Monthly (TCR) - In OCT-2012**, Contaminant:** Coliform**. Follow-up actions:** St Public Notif requested (OCT-12-2012), St Boil Water Order (OCT-12-2012), St Violation/Reminder Notice (OCT-12-2012), St Public Notif received (OCT-15-2012), St Compliance achieved (OCT-22-2012)
- MCL, Monthly (TCR) - In JUN-2008**, Contaminant:** Coliform**. Follow-up actions:** St Public Notif requested (JUN-12-2008), St Violation/Reminder Notice (JUN-12-2008), St Boil Water Order (JUN-12-2008), St Public Notif received (JUN-17-2008), St Compliance achieved (JUN-23-2008)
- MCL, Monthly (TCR) - In OCT-2007**, Contaminant:** Coliform**. Follow-up actions:** St Public Notif requested (OCT-03-2007), St Violation/Reminder Notice (OCT-03-2007), St Boil Water Order (OCT-03-2007), St Public Notif received (OCT-10-2007), St Compliance achieved (OCT-17-2007)
- MCL, Monthly (TCR) - In AUG-2007**, Contaminant:** Coliform**. Follow-up actions:** St Public Notif requested (SEP-05-2007), St Violation/Reminder Notice (SEP-05-2007), St Boil Water Order (SEP-05-2007), St Public Notif received (SEP-06-2007), St Compliance achieved (SEP-14-2007)
- MCL, Average - Between JAN-01-2006 and APR-03-2009**, Contaminant:** Nitrate-Nitrite**. Follow-up actions:** St Violation/Reminder Notice (JUN-27-2006), St Public Notif requested (JUN-27-2006), St Public Notif received (JUL-24-2006), St Public Notif requested (MAY-21-2007), St Violation/Reminder Notice (MAY-21-2007), St Public Notif received (MAR-26-2008), St Public Notif requested (MAR-28-2008), St Violation/Reminder Notice (MAR-28-2008), St Compliance achieved (APR-03-2009)
WI DOT REST AREA 22 TURTLE (Population served: 3,705**,** Groundwater):
Past health violations:
- MCL, Monthly (TCR) - In OCT-2012**, Contaminant:** Coliform**. Follow-up actions:** St Public Notif requested (OCT-31-2012), St Boil Water Order (OCT-31-2012), St Violation/Reminder Notice (OCT-31-2012), St Public Notif received (NOV-02-2012), St Compliance achieved (NOV-16-2012) Past monitoring violations:
- 2 minor monitoring violations
WI DOT REST AREA 11 DEKORRA EAST BOUND (Population served: 3,555**,** Groundwater):
Past health violations:
- MCL, Monthly (TCR) - In SEP-2012**, Contaminant:** Coliform**. Follow-up actions:** St Public Notif requested (SEP-19-2012), St Boil Water Order (SEP-19-2012), St Violation/Reminder Notice (SEP-19-2012), St Public Notif received (SEP-20-2012), St Compliance achieved (OCT-01-2012)
- MCL, Monthly (TCR) - In AUG-2012**, Contaminant:** Coliform**. Follow-up actions:** St Public Notif requested (AUG-13-2012), St Boil Water Order (AUG-13-2012), St Violation/Reminder Notice (AUG-13-2012), St Public Notif received (AUG-15-2012), St Compliance achieved (AUG-31-2012)
- MCL, Monthly (TCR) - In JUL-2011**, Contaminant:** Coliform**. Follow-up actions:** St Public Notif requested (JUL-20-2011), St Boil Water Order (JUL-20-2011), St Violation/Reminder Notice (JUL-20-2011), St Public Notif received (JUL-26-2011), St Compliance achieved (AUG-04-2011)
- MCL, Monthly (TCR) - In SEP-2005**, Contaminant:** Coliform**. Follow-up actions:** St Public Notif requested (SEP-21-2005), St Violation/Reminder Notice (SEP-21-2005), St Public Notif received (SEP-21-2005), St Boil Water Order (SEP-21-2005), St Compliance achieved (SEP-28-2005)
WI DOT REST AREA 17 MILTON (Population served: 3,300**,** Groundwater):
Past monitoring violations:
- 2 minor monitoring violations
WI DOT REST AREA 13 AZTALAN (Population served: 3,004**,** Groundwater):
Past health violations:
- MCL, Monthly (TCR) - In NOV-2012**, Contaminant:** Coliform**. Follow-up actions:** St Public Notif requested (NOV-09-2012), St Boil Water Order (NOV-09-2012), St Violation/Reminder Notice (NOV-09-2012), St Public Notif received (NOV-12-2012), St Site Visit (enforcement) (NOV-30-2012), St Compliance achieved (DEC-19-2012)
- MCL, Monthly (TCR) - In AUG-2012**, Contaminant:** Coliform**. Follow-up actions:** St Public Notif requested (AUG-13-2012), St Boil Water Order (AUG-13-2012), St Public Notif received (AUG-13-2012), St Violation/Reminder Notice (AUG-13-2012), St Compliance achieved (NOV-01-2012)
- MCL, Monthly (TCR) - In OCT-2011**, Contaminant:** Coliform**. Follow-up actions:** St Public Notif requested (OCT-10-2011), St Boil Water Order (OCT-10-2011), St Public Notif received (OCT-10-2011), St Violation/Reminder Notice (OCT-10-2011), St Compliance achieved (OCT-20-2011)
- MCL, Monthly (TCR) - In JUN-2010**, Contaminant:** Coliform**. Follow-up actions:** St Public Notif received (JUN-18-2010), St Violation/Reminder Notice (JUN-18-2010), St Boil Water Order (JUN-18-2010), St Public Notif requested (JUN-18-2010), St Compliance achieved (JUL-01-2010)
WI DOT REST AREA 106 JAMESTOWN (Population served: 2,005**,** Groundwater):
Past monitoring violations:
- 2 minor monitoring violations
WI DOT REST AREA 54 WESTBOUND (Population served: 2,000**,** Groundwater):
Past monitoring violations:
- 2 minor monitoring violations
WI DOT REST AREA 53 EASTBOUND (Population served: 2,000**,** Groundwater):
Past health violations:
- MCL, Monthly (TCR) - In JUN-2010**, Contaminant:** Coliform**. Follow-up actions:** St Public Notif requested (JUN-15-2010), St Boil Water Order (JUN-15-2010), St Violation/Reminder Notice (JUN-15-2010), St Public Notif received (JUN-16-2010), St Compliance achieved (JUN-22-2010) Past monitoring violations:
- 2 minor monitoring violations
Drinking water stations with addresses in Madison that have no violations reported:
- WI DOT REST AREA 14 AZTALAN (Population served: 3,204**,** Primary Water Source Type: Groundwater)
- KETTLE MORAINE CORRECTIONAL INSTITUTION (Population served: 1,544**,** Primary Water Source Type: Groundwater)
- WI DOT REST AREA 36 LAFAYETTE (Population served: 800**,** Primary Water Source Type: Groundwater)
- WI DOT REST AREA 35 LAFAYETTE (Population served: 800**,** Primary Water Source Type: Groundwater)
- WI DNR WILLOW RIVER CMPGD - 300 (Population served: 800**,** Primary Water Source Type: Groundwater)
- WI DNR LAKE WISSOTA LT LOOP (Population served: 665**,** Primary Water Source Type: Groundwater)
- WI DNR LAKE WISSOTA B BLDG (Population served: 665**,** Primary Water Source Type: Groundwater)
- WI DNR DEVILS LAKE - QUARTZITE CMPGRD (Population served: 615**,** Primary Water Source Type: Groundwater)
- WI DOT WAYSIDE 4 PRESTON (Population served: 500**,** Primary Water Source Type: Groundwater)
- WI DNR HARRINGTON BEACH SHOWER BLDG (Population served: 400**,** Primary Water Source Type: Groundwater)
Average household size:
| This city: | 2.2 people |
|---|---|
| Wisconsin: | 2.4 people |
Percentage of family households:
| This city: | 46.7% |
|---|---|
| Whole state: | 64.4% |
Percentage of households with unmarried partners:
| This city: | 8.7% |
|---|---|
| Whole state: | 7.3% |
Likely homosexual households (counted as self-reported same-sex unmarried-partner households)
- Lesbian couples: 0.8% of all households
- Gay men: 0.5% of all households
People in group quarters in Madison in 2010:
- 7,606 people in college/university student housing
- 1,173 people in nursing facilities/skilled-nursing facilities
- 855 people in local jails and other municipal confinement facilities
- 344 people in emergency and transitional shelters (with sleeping facilities) for people experiencing homelessness
- 302 people in group homes intended for adults
- 175 people in residential treatment centers for adults
- 122 people in other noninstitutional facilities
- 90 people in correctional residential facilities
- 37 people in group homes for juveniles (non-correctional)
- 20 people in workers' group living quarters and job corps centers
- 16 people in correctional facilities intended for juveniles
People in group quarters in Madison in 2000:
- 9,110 people in college dormitories (includes college quarters off campus)
- 978 people in nursing homes
- 712 people in local jails and other confinement facilities (including police lockups)
- 533 people in other noninstitutional group quarters
- 448 people in other nonhousehold living situations
- 390 people in schools, hospitals, or wards for the intellectually disabled
- 261 people in mental (psychiatric) hospitals or wards
- 104 people in homes or halfway houses for drug/alcohol abuse
- 82 people in homes for the mentally ill
- 51 people in training schools for juvenile delinquents
- 34 people in halfway houses
- 30 people in homes for the mentally retarded
- 29 people in other group homes
- 23 people in short-term care, detention or diagnostic centers for delinquent children
- 23 people in homes for the physically handicapped
- 18 people in religious group quarters
- 6 people in orthopedic wards and institutions for the physically handicapped
Arenas or stadiums:
- Camp Randall Stadium. Capacity: 80,321. Wisconsin Badgers football.
- Kohl Center. University of Wisconsin.
Banks with most branches in Madison (2011 data):
- BMO Harris Bank National Association: 14 branches**. Info updated** 2011/07/14: Bank assets: 97,264.0mil∗∗,Deposits:∗∗97,264.0 mil**, Deposits:** 97,264.0mil∗∗,Deposits:∗∗75,624.6 mil**, headquarters in** Chicago, IL**, positive income** , 717 total offices , Holding Company: Bank Of Montreal
- Associated Bank, National Association: 14 branches**. Info updated** 2008/09/12: Bank assets: 21,715.0mil∗∗,Deposits:∗∗21,715.0 mil**, Deposits:** 21,715.0mil∗∗,Deposits:∗∗15,244.4 mil**, headquarters in** Green Bay, WI**, positive income**, Commercial Lending Specialization**,** 282 total offices , Holding Company: Associated Banc-Corp
- U.S. Bank National Association: 9 branches**. Info updated** 2012/01/30: Bank assets: 330,470.8mil∗∗,Deposits:∗∗330,470.8 mil**, Deposits:** 330,470.8mil∗∗,Deposits:∗∗236,091.5 mil**, headquarters in** Cincinnati, OH**, positive income** , 3121 total offices , Holding Company: U.S. Bancorp
- AnchorBank, fsb: 8 branches**. Info updated** 2011/07/21: Bank assets: 3,067.4mil∗∗,Deposits:∗∗3,067.4 mil**, Deposits:** 3,067.4mil∗∗,Deposits:∗∗2,481.9 mil**, local headquarters** , negative income in the last year, Commercial Lending Specialization**,** 56 total offices
- The Park Bank: 7 branches**. Info updated** 2012/01/13: Bank assets: 769.4mil∗∗,Deposits:∗∗769.4 mil**, Deposits:** 769.4mil∗∗,Deposits:∗∗604.8 mil**, local headquarters** , positive income, Commercial Lending Specialization**,** 12 total offices , Holding Company: Park Bancorporation, Inc.
- JPMorgan Chase Bank, National Association: East Towne Branch, Milwaukee Street Branch, Sauk Creek Branch, Capitol Branch, Atwood Branch, Monona Branch**. Info updated** 2011/11/10: Bank assets: 1,811,678.0mil∗∗,Deposits:∗∗1,811,678.0 mil**, Deposits:** 1,811,678.0mil∗∗,Deposits:∗∗1,190,738.0 mil**, headquarters in** Columbus, OH**, positive income**, International Specialization**,** 5577 total offices , Holding Company: Jpmorgan Chase & Co.
- Capitol Bank: Sebring Branch, Prairie Park Branch, Rosewood Villas Branch, Coventry Village Branch, at 710 North High Point Road**. Info updated** 2006/11/03: Bank assets: 275.3mil∗∗,Deposits:∗∗275.3 mil**, Deposits:** 275.3mil∗∗,Deposits:∗∗234.9 mil**, local headquarters** , positive income, Commercial Lending Specialization**,** 14 total offices , Holding Company: Capitol Bankshares, Inc.
- Johnson Bank: Downtown Madison Branch 67000, Madison All Saints Branch, Terrace Drive Madison Branch, Madison West Branch 66000**. Info updated** 2006/07/05: Bank assets: 4,144.5mil∗∗,Deposits:∗∗4,144.5 mil**, Deposits:** 4,144.5mil∗∗,Deposits:∗∗3,567.4 mil**, headquarters in** Racine, WI**, negative income in the last year**, Commercial Lending Specialization**,** 55 total offices , Holding Company: Johnson Financial Group, Inc.
- Wells Fargo Bank, National Association: Madison Business Banking Branch, Madison East Towne Branch, Madison West Towne Branch**. Info updated** 2011/04/05: Bank assets: 1,161,490.0mil∗∗,Deposits:∗∗1,161,490.0 mil**, Deposits:** 1,161,490.0mil∗∗,Deposits:∗∗905,653.0 mil**, headquarters in** Sioux Falls, SD**, positive income** , 6395 total offices , Holding Company: Wells Fargo & Company
- 14 other banks with 20 local branches
For population 15 years and over in Madison:
- Never married: 50.0%
- Now married: 38.3%
- Separated: 0.8%
- Widowed: 2.7%
- Divorced: 8.3%
For population 25 years and over in Madison:
- High school or higher: 97.5%
- Bachelor's degree or higher: 60.1%
- Graduate or professional degree: 26.5%
- Unemployed: 4.8%
- Mean travel time to work (commute): 15.4 minutes
Education Gini index (Inequality in education)
| Here: | 9.9 |
|---|---|
| Wisconsin average: | 10.4 |
Graphs represent county-level data. Detailed 2008 Election Results
Political contributions by individuals in Madison, WI
Religion statistics for Madison, WI (based on Dane County data)
| Religion | Adherents | Congregations |
|---|---|---|
| Catholic | 106,036 | 34 |
| Mainline Protestant | 73,128 | 113 |
| Evangelical Protestant | 30,727 | 146 |
| Other | 12,968 | 49 |
| Black Protestant | 779 | 5 |
| Orthodox | 445 | 4 |
| None | 263,990 | - |
Source: Clifford Grammich, Kirk Hadaway, Richard Houseal, Dale E.Jones, Alexei Krindatch, Richie Stanley and Richard H.Taylor. 2012. 2010 U.S.Religion Census: Religious Congregations & Membership Study. Association of Statisticians of American Religious Bodies. Jones, Dale E., et al. 2002. Congregations and Membership in the United States 2000. Nashville, TN: Glenmary Research Center. Graphs represent county-level data
Food Environment Statistics:
**Number of grocery stores: 73
| Dane County: | 1.53 / 10,000 pop. |
|---|---|
| State: | 1.86 / 10,000 pop. |
**Number of supercenters and club stores: 2
| Here: | 0.04 / 10,000 pop. |
|---|---|
| Wisconsin: | 0.11 / 10,000 pop. |
**Number of convenience stores (no gas): 5
| Dane County: | 0.11 / 10,000 pop. |
|---|---|
| Wisconsin: | 0.38 / 10,000 pop. |
**Number of convenience stores (with gas): 154
| This county: | 3.24 / 10,000 pop. |
|---|---|
| Wisconsin: | 4.12 / 10,000 pop. |
**Number of full-service restaurants: 382
| Dane County: | 8.03 / 10,000 pop. |
|---|---|
| State: | 8.64 / 10,000 pop. |
**Adult diabetes rate:
| This county: | 6.0% |
|---|---|
| State: | 7.6% |
**Adult obesity rate:
| This county: | 23.9% |
|---|---|
| State: | 27.5% |
**Low-income preschool obesity rate:
| This county: | 11.1% |
|---|---|
| State: | 13.0% |
Health and Nutrition:
**Healthy diet rate:
| This city: | 51.6% |
|---|---|
| Wisconsin: | 49.5% |
**Average overall health of teeth and gums:
| Madison: | 52.1% |
|---|---|
| Wisconsin: | 46.6% |
**People feeling badly about themselves:
**People not drinking alcohol at all:
**Average hours sleeping at night:
**General health condition:
| Madison: | 60.8% |
|---|---|
| Wisconsin: | 56.3% |
**Average condition of hearing:
| Madison: | 82.2% |
|---|---|
| Wisconsin: | 78.5% |
More about Health and Nutrition of Madison, WI Residents
| Local government employment and payroll (March 2022) | |||||
|---|---|---|---|---|---|
| Function | Full-time employees | Monthly full-time payroll | Average yearly full-time wage | Part-time employees | Monthly part-time payroll |
| Police Protection - Officers | 474 | 3,723,506∣3,723,506 | 3,723,506∣94,266 | 0 | $0 |
| Transit | 441 | 2,140,585∣2,140,585 | 2,140,585∣58,247 | 43 | $72,541 |
| Firefighters | 362 | 2,100,246∣2,100,246 | 2,100,246∣69,621 | 0 | $0 |
| Other and Unallocable | 255 | 1,236,944∣1,236,944 | 1,236,944∣58,209 | 69 | $132,780 |
| Streets and Highways | 235 | 1,063,046∣1,063,046 | 1,063,046∣54,283 | 6 | $6,778 |
| Parks and Recreation | 196 | 778,103∣778,103 | 778,103∣47,639 | 95 | $92,386 |
| Water Supply | 122 | 624,875∣624,875 | 624,875∣61,463 | 2 | $3,404 |
| Police - Other | 113 | 604,179∣604,179 | 604,179∣64,161 | 7 | $12,086 |
| Financial Administration | 108 | 644,275∣644,275 | 644,275∣71,586 | 14 | $32,703 |
| Local Libraries | 80 | 361,492∣361,492 | 361,492∣54,224 | 178 | $238,932 |
| Other Government Administration | 73 | 449,359∣449,359 | 449,359∣73,867 | 27 | $17,122 |
| Fire - Other | 40 | 239,535∣239,535 | 239,535∣71,861 | 0 | $0 |
| Welfare | 35 | 163,608∣163,608 | 163,608∣56,094 | 9 | $11,824 |
| Housing and Community Development (Local) | 34 | 109,957∣109,957 | 109,957∣38,808 | 4 | $2,114 |
| Sewerage | 32 | 168,156∣168,156 | 168,156∣63,059 | 0 | $0 |
| Judicial and Legal | 30 | 166,901∣166,901 | 166,901∣66,760 | 5 | $7,402 |
| Totals for Government | 2,630 | 14,574,767∣14,574,767 | 14,574,767∣66,501 | 459 | $630,072 |
Madison government finances - Expenditure in 2021 (per resident):
- Construction - Regular Highways: 25,555,000(25,555,000 (25,555,000(93.64)
Parks and Recreation: 6,183,000(6,183,000 (6,183,000(22.66)
Sewerage: 3,499,000(3,499,000 (3,499,000(12.82)
General - Other: 3,142,000(3,142,000 (3,142,000(11.51)
Libraries: 2,047,000(2,047,000 (2,047,000(7.50)
General Public Buildings: 1,138,000(1,138,000 (1,138,000(4.17)
Local Fire Protection: 698,000(698,000 (698,000(2.56)
Parking Facilities: 575,000(575,000 (575,000(2.11)
Police Protection: 529,000(529,000 (529,000(1.94) - Current Operations - Police Protection: 87,202,000(87,202,000 (87,202,000(319.53)
Transit Utilities: 61,528,000(61,528,000 (61,528,000(225.46)
Local Fire Protection: 59,096,000(59,096,000 (59,096,000(216.55)
Regular Highways: 45,729,000(45,729,000 (45,729,000(167.57)
Housing and Community Development: 36,288,000(36,288,000 (36,288,000(132.97)
Sewerage: 36,218,000(36,218,000 (36,218,000(132.71)
Parks and Recreation: 34,949,000(34,949,000 (34,949,000(128.06)
General - Other: 26,619,000(26,619,000 (26,619,000(97.54)
Water Utilities: 25,182,000(25,182,000 (25,182,000(92.27)
Central Staff Services: 20,053,000(20,053,000 (20,053,000(73.48)
Libraries: 18,021,000(18,021,000 (18,021,000(66.03)
Solid Waste Management: 15,600,000(15,600,000 (15,600,000(57.16)
Parking Facilities: 14,866,000(14,866,000 (14,866,000(54.47)
Financial Administration: 6,998,000(6,998,000 (6,998,000(25.64)
Natural Resources - Other: 6,987,000(6,987,000 (6,987,000(25.60)
Health - Other: 6,685,000(6,685,000 (6,685,000(24.50)
Protective Inspection and Regulation - Other: 4,418,000(4,418,000 (4,418,000(16.19)
Judicial and Legal Services: 3,490,000(3,490,000 (3,490,000(12.79)
General Public Buildings: 1,400,000(1,400,000 (1,400,000(5.13)
Miscellaneous Commercial Activities - Other: 3,000(3,000 (3,000(0.01) - General - Interest on Debt: 34,001,000(34,001,000 (34,001,000(124.59)
- Other Capital Outlay - Housing and Community Development: 2,940,000(2,940,000 (2,940,000(10.77)
Regular Highways: 416,000(416,000 (416,000(1.52)
Solid Waste Management: 246,000(246,000 (246,000(0.90)
General - Other: 224,000(224,000 (224,000(0.82)
Madison government finances - Revenue in 2021 (per resident):
- Charges - Sewerage: 42,740,000(42,740,000 (42,740,000(156.61)
Regular Highways: 18,141,000(18,141,000 (18,141,000(66.47)
Parks and Recreation: 12,184,000(12,184,000 (12,184,000(44.65)
Other: 11,700,000(11,700,000 (11,700,000(42.87)
Housing and Community Development: 8,336,000(8,336,000 (8,336,000(30.55)
Parking Facilities: 6,849,000(6,849,000 (6,849,000(25.10)
Natural Resources - Other: 4,997,000(4,997,000 (4,997,000(18.31)
Solid Waste Management: 889,000(889,000 (889,000(3.26)
Miscellaneous Commercial Activities: 382,000(382,000 (382,000(1.40) - Federal Intergovernmental - Housing and Community Development: 23,293,000(23,293,000 (23,293,000(85.35)
Other: 21,799,000(21,799,000 (21,799,000(79.88)
General Local Government Support: 2,545,000(2,545,000 (2,545,000(9.33)
Transit Utilities: 1,003,000(1,003,000 (1,003,000(3.68) - Local Intergovernmental - Other: 9,891,000(9,891,000 (9,891,000(36.24)
Highways: 7,452,000(7,452,000 (7,452,000(27.31)
Sewerage: 403,000(403,000 (403,000(1.48) - Miscellaneous - Interest Earnings: 15,130,000(15,130,000 (15,130,000(55.44)
Special Assessments: 7,035,000(7,035,000 (7,035,000(25.78)
Sale of Property: 6,448,000(6,448,000 (6,448,000(23.63)
Fines and Forfeits: 3,902,000(3,902,000 (3,902,000(14.30)
General Revenue - Other: 3,235,000(3,235,000 (3,235,000(11.85)
Donations From Private Sources: 1,185,000(1,185,000 (1,185,000(4.34)
Rents: 464,000(464,000 (464,000(1.70) - Revenue - Water Utilities: 38,773,000(38,773,000 (38,773,000(142.08)
Transit Utilities: 9,430,000(9,430,000 (9,430,000(34.55)
- State Intergovernmental - Other: 35,007,000(35,007,000 (35,007,000(128.28)
General Local Government Support: 20,253,000(20,253,000 (20,253,000(74.21)
Highways: 12,382,000(12,382,000 (12,382,000(45.37)
Education: 5,593,000(5,593,000 (5,593,000(20.49)
Housing and Community Development: 1,320,000(1,320,000 (1,320,000(4.84)
Transit Utilities: 383,000(383,000 (383,000(1.40) - Tax - Property: 269,622,000(269,622,000 (269,622,000(987.98)
Other: 6,024,000(6,024,000 (6,024,000(22.07)
Other Selective Sales: 5,862,000(5,862,000 (5,862,000(21.48)
Other License: 5,576,000(5,576,000 (5,576,000(20.43)
Occupation and Business License - Other: 3,530,000(3,530,000 (3,530,000(12.93)
Madison government finances - Debt in 2021 (per resident):
- Long Term Debt - Outstanding Unspecified Public Purpose: 840,493,000(840,493,000 (840,493,000(3079.82)
Beginning Outstanding - Unspecified Public Purpose: 785,555,000(785,555,000 (785,555,000(2878.51)
Beginning Outstanding - Public Debt for Private Purpose: 237,779,000(237,779,000 (237,779,000(871.29)
Issue, Unspecified Public Purpose: 165,048,000(165,048,000 (165,048,000(604.79)
Retired Nonguaranteed - Public Debt for Private Purpose: 152,778,000(152,778,000 (152,778,000(559.83)
Retired Unspecified Public Purpose: 110,110,000(110,110,000 (110,110,000(403.48)
Outstanding Nonguaranteed - Industrial Revenue: 85,001,000(85,001,000 (85,001,000(311.47)
Madison government finances - Cash and Securities in 2021 (per resident):
- Bond Funds - Cash and Securities: 119,181,000(119,181,000 (119,181,000(436.72)
- Other Funds - Cash and Securities: 272,765,000(272,765,000 (272,765,000(999.49)
- Sinking Funds - Cash and Securities: 170,210,000(170,210,000 (170,210,000(623.70)
5.62% of this county's 2021 resident taxpayers lived in other counties in 2020 ($67,560 average adjusted gross income)
| Here: | 5.62% |
|---|---|
| Wisconsin average: | 6.07% |
0.01% of residents moved from foreign countries ($96 average AGI)
Dane County: 0.01% Wisconsin average: 0.00%
Top counties from which taxpayers relocated into this county between 2020 and 2021:
6.55% of this county's 2020 resident taxpayers moved to other counties in 2021 ($75,791 average adjusted gross income)
| Here: | 6.55% |
|---|---|
| Wisconsin average: | 6.10% |
0.01% of residents moved to foreign countries ($41 average AGI)
Dane County: 0.01% Wisconsin average: 0.00%
Top counties to which taxpayers relocated from this county between 2020 and 2021:
| Businesses in Madison, WI | |||
|---|---|---|---|
| Name | Count | Name | Count |
| ALDI | 2 | Justice | 2 |
| ALDO | 1 | KFC | 7 |
| AT&T | 3 | Kincaid | 1 |
| Abercrombie & Fitch | 1 | Kohl's | 2 |
| Ace Hardware | 4 | Kroger | 1 |
| Advance Auto Parts | 1 | La Quinta | 1 |
| Aeropostale | 2 | La-Z-Boy | 4 |
| AmericInn | 1 | Lane Bryant | 2 |
| American Eagle Outfitters | 2 | Lane Furniture | 3 |
| Ann Taylor | 1 | LensCrafters | 2 |
| Apple Store | 1 | Little Caesars Pizza | 2 |
| Applebee's | 2 | Macy's | 1 |
| Arby's | 6 | Marriott | 3 |
| Ashley Furniture | 1 | Marshalls | 1 |
| Audi | 1 | MasterBrand Cabinets | 15 |
| AutoZone | 2 | Maurices | 2 |
| BMW | 1 | Mazda | 2 |
| Banana Republic | 1 | McDonald's | 13 |
| Barnes & Noble | 2 | Men's Wearhouse | 2 |
| Bath & Body Works | 3 | Menards | 2 |
| Baymont Inn | 2 | Microtel | 1 |
| Bed Bath & Beyond | 2 | Motel 6 | 1 |
| Ben & Jerry's | 1 | Motherhood Maternity | 5 |
| Best Western | 4 | New Balance | 6 |
| Blockbuster | 2 | New York & Co | 2 |
| Budget Car Rental | 3 | Nike | 37 |
| Buffalo Wild Wings | 2 | Nissan | 2 |
| Burger King | 3 | Office Depot | 2 |
| Burlington Coat Factory | 2 | OfficeMax | 2 |
| CVS | 1 | Old Navy | 2 |
| Cache | 1 | Olive Garden | 2 |
| Cambria | 1 | Outback | 2 |
| Caribou Coffee | 1 | Outback Steakhouse | 2 |
| Carson Pirie Scott | 2 | Pac Sun | 2 |
| Casual Male XL | 1 | Panera Bread | 5 |
| Catherines | 1 | Papa John's Pizza | 3 |
| Charlotte Russe | 1 | Payless | 2 |
| Chipotle | 3 | Penske | 4 |
| Chuck E. Cheese's | 1 | PetSmart | 2 |
| Clarion | 1 | Pier 1 Imports | 3 |
| Cold Stone Creamery | 1 | Pizza Hut | 7 |
| Comfort Inn | 1 | Plato's Closet | 2 |
| Comfort Suites | 1 | Pottery Barn | 1 |
| Cracker Barrel | 1 | Qdoba Mexican Grill | 5 |
| Cricket Wireless | 7 | Quality | 1 |
| Curves | 3 | Quiznos | 5 |
| DHL | 8 | RadioShack | 5 |
| Dairy Queen | 4 | Red Lobster | 1 |
| Days Inn | 1 | Red Robin | 1 |
| Deb | 1 | Red Roof Inn | 1 |
| Decora Cabinetry | 4 | Rodeway Inn | 1 |
| Dennys | 2 | Rue21 | 1 |
| Discount Tire | 1 | Ryder Rental & Truck Leasing | 1 |
| Domino's Pizza | 2 | SAS Shoes | 2 |
| DressBarn | 1 | Sam's Club | 1 |
| Dressbarn | 1 | Sears | 4 |
| Econo Lodge | 1 | Sephora | 1 |
| Eddie Bauer | 1 | Sheraton | 1 |
| Express | 1 | Sleep Inn | 1 |
| Extended Stay America | 1 | Slumberland | 2 |
| Extended Stay Deluxe | 1 | Spencer Gifts | 1 |
| Famous Footwear | 2 | Sprint Nextel | 3 |
| Fashion Bug | 1 | Staples | 1 |
| FedEx | 45 | Starbucks | 6 |
| Finish Line | 2 | Subaru | 2 |
| Firestone Complete Auto Care | 2 | Subway | 24 |
| Foot Locker | 1 | Super 8 | 2 |
| Ford | 2 | T-Mobile | 3 |
| Forever 21 | 1 | T.G.I. Driday's | 1 |
| GNC | 4 | T.J.Maxx | 1 |
| GameStop | 4 | Taco Bell | 7 |
| Gap | 4 | Talbots | 1 |
| Goodwill | 1 | Target | 2 |
| Gymboree | 2 | The Limited | 1 |
| H&M | 1 | The Room Place | 1 |
| H&R Block | 7 | Toyota | 2 |
| Hardee's | 1 | Toys"R"Us | 3 |
| Hilton | 4 | Trader Joe's | 1 |
| Holiday Inn | 6 | True Value | 5 |
| Hollister Co. | 2 | U-Haul | 10 |
| Home Depot | 2 | U.S. Cellular | 2 |
| HomeTown Buffet | 1 | UPS | 74 |
| Honda | 3 | Urban Outfitters | 1 |
| Hot Topic | 2 | Vans | 6 |
| Howard Johnson | 1 | Verizon Wireless | 3 |
| Hyatt | 1 | Victoria's Secret | 2 |
| Hyundai | 2 | Volkswagen | 1 |
| IHOP | 2 | Walgreens | 14 |
| J.Crew | 1 | Walmart | 2 |
| JCPenney | 2 | Wendy's | 3 |
| Jamba Juice | 1 | Wet Seal | 1 |
| Jimmy John's | 5 | Whole Foods Market | 1 |
| Jones New York | 4 | YMCA | 3 |
| Journeys | 2 |
Browse common businesses in Madison, WI
Strongest AM radio stations in Madison:
- WHA (970 AM; 5 kW; MADISON, WI; Owner: BOARD REGENTS OF UNIV OF WI SYSTEM)
- WLMV (1480 AM; 10 kW; MADISON, WI; Owner: MID-WEST MANAGEMENT, INC.)
- WTDY (1670 AM; 10 kW; MADISON, WI; Owner: MID-WEST MANAGEMENT, INC.)
- WTSO (1070 AM; 10 kW; MADISON, WI; Owner: CAPSTAR TX LIMITED PARTNERSHIP)
- WTUX (1550 AM; daytime; 5 kW; MADISON, WI)
- WIBA (1310 AM; 5 kW; MADISON, WI; Owner: CAPSTAR TX LIMITED PARTNERSHIP)
- WNWC (1190 AM; daytime; 5 kW; SUN PRAIRIE, WI; Owner: NORTHWESTERN COLLEGE)
- WTMJ (620 AM; 50 kW; MILWAUKEE, WI; Owner: JOURNAL BROADCAST CORPORATION)
- WISN (1130 AM; 50 kW; MILWAUKEE, WI; Owner: CAPSTAR TX LIMITED PARTNERSHIP)
- WSCR (670 AM; 50 kW; CHICAGO, IL; Owner: INFINITY BROADCASTING OPERATIONS, INC.)
- WGN (720 AM; 50 kW; CHICAGO, IL; Owner: WGN CONTINENTAL BROADCASTING CO.)
- WBBM (780 AM; 50 kW; CHICAGO, IL; Owner: INFINITY BROADCASTING OPERATIONS, INC.)
- WNAM (1280 AM; 50 kW; NEENAH-MENASHA, WI; Owner: CUMULUS LICENSING CORP.)
Strongest FM radio stations in Madison:
- WZEE (104.1 FM; MADISON, WI; Owner: CAPSTAR TX LIMITED PARTNERSHIP)
- WORT (89.9 FM; MADISON, WI; Owner: BACK PORCH RADIO BROADCASTING, INC.)
- WERN (88.7 FM; MADISON, WI; Owner: STATE OF WISCONSIN - EDUCATIONAL COMMUNICATIONS BOARD)
- WIBA-FM (101.5 FM; MADISON, WI; Owner: CAPSTAR TX LIMITED PARTNERSHIP)
- WWQM-FM (106.3 FM; MIDDLETON, WI; Owner: MID-WEST MANAGEMENT INC.)
- W215AQ (90.9 FM; MADISON, WI; Owner: STATE OF WISCONSIN - EDUCATIONAL COMMUNICATIONS BOARD)
- WNWC-FM (102.5 FM; MADISON, WI; Owner: NORTHWESTERN COLLEGE)
- WMGN (98.1 FM; MADISON, WI; Owner: MID-WEST MANAGEMENT, INC.)
- WMMM-FM (105.5 FM; VERONA, WI; Owner: ENTERCOM MADISON LICENSE, LLC.)
- WCJZ (96.3 FM; SAUK CITY, WI; Owner: CAPSTAR TX LIMITED PARTNERSHIP)
- WMAD-FM (92.1 FM; SUN PRAIRIE, WI; Owner: CAPSTAR TX LIMITED PARTNERSHIP)
- W277AE (103.3 FM; MADISON, WI; Owner: FAITH ACADEMY DBA WFEN)
- WOLX-FM (94.9 FM; BARABOO, WI; Owner: ENTERCOM MADISON LICENSE, LLC.)
- WHIT-FM (93.1 FM; DE FOREST, WI; Owner: MID-WEST MANAGEMENT, INC.)
- WBZU (105.1 FM; WAUNAKEE, WI; Owner: ENTERCOM MADISON LICENSE, LLC.)
- WJJO (94.1 FM; WATERTOWN, WI; Owner: MID-WEST MANAGMENT, INC.)
- WSUM (91.7 FM; MADISON, WI; Owner: BD. OF REGENTS OF UNIVERSITY OF WISCONSIN SYSTEM)
- W216BL (91.1 FM; MCFARLAND, WI; Owner: VCY AMERICA, INC.)
- WSJY (107.3 FM; FORT ATKINSON, WI; Owner: NEWRADIO GROUP, LLC)
- WKPO (105.9 FM; EVANSVILLE, WI; Owner: GOOD KARMA BROADCASTING, L.L.C.)
TV broadcast stations around Madison:
- W23BW (Channel 23; MADISON, WI; Owner: THREE ANGELS BROADCASTING NETWORK)
- W08CK (Channel 8; MADISON-MIDDLETON, WI; Owner: HEALTHY'S, INC.)
- WISC-TV (Channel 3; MADISON, WI; Owner: TELEVISION WISCONSIN, INC.)
- WMTV (Channel 15; MADISON, WI; Owner: GRAY MIDAMERICA TV LICENSEE CORP.)
- WMSN-TV (Channel 47; MADISON, WI; Owner: WMSN LICENSEE, LLC)
- WKOW-TV (Channel 27; MADISON, WI; Owner: WKOW TELEVISION, INC.)
- WHA-TV (Channel 21; MADISON, WI; Owner: BOARD OF REGENTS OF THE UNIV. OF WISCONSIN SYSTEM)
- W38CT (Channel 38; MADISON, WI; Owner: TRINITY BROADCASTING NETWORK)
- W58CO (Channel 58; SAULT STE. MARIE, MI; Owner: MS COMMUNICATIONS, LLC)
- National Bridge Inventory (NBI) Statistics
- 231Number of bridges
- 2,064ft / 629mTotal length
- $30,973,000Total costs
- 6,687,246Total average daily traffic
- 206,683Total average daily truck traffic
- New bridges - historical statistics
- 1Before 1900
- 11900-1909
- 41920-1929
- 101930-1939
- 31940-1949
- 101950-1959
- 621960-1969
- 91970-1979
- 171980-1989
- 501990-1999
- 242000-2009
- 382010-2019
- 22020-2022
See full National Bridge Inventory statistics for Madison, WI
| Home Mortgage Disclosure Act Aggregated Statistics For Year 2009_(Based on 35 full and 19 partial tracts)_ | ||||||||||||||
|---|---|---|---|---|---|---|---|---|---|---|---|---|---|---|
| A) FHA, FSA/RHS & VAHome Purchase Loans | B) ConventionalHome Purchase Loans | C) Refinancings | D) Home Improvement Loans | E) Loans on Dwellings For 5+ Families | F) Non-occupant Loans on < 5 Family Dwellings (A B C & D) | G) Loans On ManufacturedHome Dwelling (A B C & D) | ||||||||
| Number | Average Value | Number | Average Value | Number | Average Value | Number | Average Value | Number | Average Value | Number | Average Value | Number | Average Value | |
| LOANS ORIGINATED | 505 | 169,039∣1,756∣169,039 | 1,756 | 169,039∣1,756∣166,440 | 8,709 | 172,726∣490∣172,726 | 490 | 172,726∣490∣102,077 | 80 | 1,132,169∣577∣1,132,169 | 577 | 1,132,169∣577∣173,946 | 1 | $50,290 |
| APPLICATIONS APPROVED, NOT ACCEPTED | 24 | 178,159∣83∣178,159 | 83 | 178,159∣83∣189,845 | 714 | 182,401∣83∣182,401 | 83 | 182,401∣83∣114,087 | 1 | 130,000∣40∣130,000 | 40 | 130,000∣40∣176,313 | 3 | $23,483 |
| APPLICATIONS DENIED | 75 | 159,849∣160∣159,849 | 160 | 159,849∣160∣160,066 | 1,200 | 183,709∣95∣183,709 | 95 | 183,709∣95∣58,595 | 2 | 3,840,950∣99∣3,840,950 | 99 | 3,840,950∣99∣199,038 | 4 | $106,435 |
| APPLICATIONS WITHDRAWN | 46 | 148,217∣181∣148,217 | 181 | 148,217∣181∣178,880 | 1,164 | 178,235∣62∣178,235 | 62 | 178,235∣62∣123,028 | 4 | 821,968∣73∣821,968 | 73 | 821,968∣73∣181,433 | 0 | $0 |
| FILES CLOSED FOR INCOMPLETENESS | 6 | 185,783∣15∣185,783 | 15 | 185,783∣15∣177,931 | 187 | 183,733∣9∣183,733 | 9 | 183,733∣9∣114,388 | 0 | 0∣7∣0 | 7 | 0∣7∣190,320 | 0 | $0 |
| Aggregated Statistics For Year 2008_(Based on 35 full and 19 partial tracts)_ | ||||||||||||||
|---|---|---|---|---|---|---|---|---|---|---|---|---|---|---|
| A) FHA, FSA/RHS & VAHome Purchase Loans | B) ConventionalHome Purchase Loans | C) Refinancings | D) Home Improvement Loans | E) Loans on Dwellings For 5+ Families | F) Non-occupant Loans on < 5 Family Dwellings (A B C & D) | G) Loans On ManufacturedHome Dwelling (A B C & D) | ||||||||
| Number | Average Value | Number | Average Value | Number | Average Value | Number | Average Value | Number | Average Value | Number | Average Value | Number | Average Value | |
| LOANS ORIGINATED | 160 | 177,547∣1,910∣177,547 | 1,910 | 177,547∣1,910∣180,257 | 3,885 | 174,002∣572∣174,002 | 572 | 174,002∣572∣73,157 | 134 | 1,089,309∣619∣1,089,309 | 619 | 1,089,309∣619∣226,326 | 7 | $38,403 |
| APPLICATIONS APPROVED, NOT ACCEPTED | 9 | 167,354∣151∣167,354 | 151 | 167,354∣151∣188,516 | 379 | 157,504∣78∣157,504 | 78 | 157,504∣78∣50,281 | 3 | 1,440,500∣57∣1,440,500 | 57 | 1,440,500∣57∣171,631 | 2 | $17,640 |
| APPLICATIONS DENIED | 34 | 159,034∣196∣159,034 | 196 | 159,034∣196∣161,019 | 1,049 | 170,928∣173∣170,928 | 173 | 170,928∣173∣73,638 | 3 | 810,150∣89∣810,150 | 89 | 810,150∣89∣196,614 | 9 | $25,809 |
| APPLICATIONS WITHDRAWN | 20 | 160,685∣204∣160,685 | 204 | 160,685∣204∣187,463 | 724 | 181,079∣45∣181,079 | 45 | 181,079∣45∣135,498 | 1 | 1,917,080∣64∣1,917,080 | 64 | 1,917,080∣64∣178,255 | 0 | $0 |
| FILES CLOSED FOR INCOMPLETENESS | 1 | 219,390∣25∣219,390 | 25 | 219,390∣25∣189,672 | 118 | 172,150∣17∣172,150 | 17 | 172,150∣17∣90,741 | 0 | 0∣14∣0 | 14 | 0∣14∣160,387 | 0 | $0 |
| Aggregated Statistics For Year 2007_(Based on 35 full and 19 partial tracts)_ | ||||||||||||||
|---|---|---|---|---|---|---|---|---|---|---|---|---|---|---|
| A) FHA, FSA/RHS & VAHome Purchase Loans | B) ConventionalHome Purchase Loans | C) Refinancings | D) Home Improvement Loans | E) Loans on Dwellings For 5+ Families | F) Non-occupant Loans on < 5 Family Dwellings (A B C & D) | G) Loans On ManufacturedHome Dwelling (A B C & D) | ||||||||
| Number | Average Value | Number | Average Value | Number | Average Value | Number | Average Value | Number | Average Value | Number | Average Value | Number | Average Value | |
| LOANS ORIGINATED | 50 | 173,873∣3,094∣173,873 | 3,094 | 173,873∣3,094∣165,602 | 3,392 | 140,044∣842∣140,044 | 842 | 140,044∣842∣52,095 | 90 | 1,316,659∣744∣1,316,659 | 744 | 1,316,659∣744∣177,801 | 6 | $30,153 |
| APPLICATIONS APPROVED, NOT ACCEPTED | 6 | 185,198∣223∣185,198 | 223 | 185,198∣223∣158,621 | 495 | 128,281∣149∣128,281 | 149 | 128,281∣149∣47,512 | 3 | 3,518,613∣66∣3,518,613 | 66 | 3,518,613∣66∣173,636 | 4 | $31,745 |
| APPLICATIONS DENIED | 6 | 181,493∣354∣181,493 | 354 | 181,493∣354∣136,764 | 1,193 | 153,448∣212∣153,448 | 212 | 153,448∣212∣40,169 | 5 | 561,844∣184∣561,844 | 184 | 561,844∣184∣172,324 | 14 | $24,495 |
| APPLICATIONS WITHDRAWN | 2 | 300,280∣224∣300,280 | 224 | 300,280∣224∣166,256 | 691 | 153,978∣73∣153,978 | 73 | 153,978∣73∣93,450 | 1 | 480,000∣57∣480,000 | 57 | 480,000∣57∣166,791 | 1 | $99,920 |
| FILES CLOSED FOR INCOMPLETENESS | 0 | 0∣64∣0 | 64 | 0∣64∣169,953 | 186 | 161,362∣20∣161,362 | 20 | 161,362∣20∣95,844 | 0 | 0∣16∣0 | 16 | 0∣16∣139,561 | 0 | $0 |
| Aggregated Statistics For Year 2006_(Based on 35 full and 19 partial tracts)_ | ||||||||||||||
|---|---|---|---|---|---|---|---|---|---|---|---|---|---|---|
| A) FHA, FSA/RHS & VAHome Purchase Loans | B) ConventionalHome Purchase Loans | C) Refinancings | D) Home Improvement Loans | E) Loans on Dwellings For 5+ Families | F) Non-occupant Loans on < 5 Family Dwellings (A B C & D) | G) Loans On ManufacturedHome Dwelling (A B C & D) | ||||||||
| Number | Average Value | Number | Average Value | Number | Average Value | Number | Average Value | Number | Average Value | Number | Average Value | Number | Average Value | |
| LOANS ORIGINATED | 62 | 174,153∣3,791∣174,153 | 3,791 | 174,153∣3,791∣156,843 | 3,664 | 128,191∣921∣128,191 | 921 | 128,191∣921∣41,307 | 92 | 1,731,001∣760∣1,731,001 | 760 | 1,731,001∣760∣169,367 | 8 | $19,610 |
| APPLICATIONS APPROVED, NOT ACCEPTED | 1 | 155,050∣296∣155,050 | 296 | 155,050∣296∣151,521 | 458 | 120,461∣117∣120,461 | 117 | 120,461∣117∣36,165 | 3 | 2,608,537∣56∣2,608,537 | 56 | 2,608,537∣56∣185,846 | 8 | $21,752 |
| APPLICATIONS DENIED | 9 | 136,198∣453∣136,198 | 453 | 136,198∣453∣141,938 | 1,225 | 144,288∣223∣144,288 | 223 | 144,288∣223∣53,099 | 4 | 3,444,825∣141∣3,444,825 | 141 | 3,444,825∣141∣196,019 | 15 | $41,573 |
| APPLICATIONS WITHDRAWN | 8 | 187,852∣313∣187,852 | 313 | 187,852∣313∣150,401 | 925 | 145,583∣68∣145,583 | 68 | 145,583∣68∣78,189 | 3 | 180,183∣99∣180,183 | 99 | 180,183∣99∣157,837 | 1 | $152,480 |
| FILES CLOSED FOR INCOMPLETENESS | 1 | 65,320∣63∣65,320 | 63 | 65,320∣63∣172,907 | 343 | 164,818∣18∣164,818 | 18 | 164,818∣18∣69,776 | 0 | 0∣23∣0 | 23 | 0∣23∣188,743 | 1 | $160,620 |
| Aggregated Statistics For Year 2005_(Based on 35 full and 19 partial tracts)_ | ||||||||||||||
|---|---|---|---|---|---|---|---|---|---|---|---|---|---|---|
| A) FHA, FSA/RHS & VAHome Purchase Loans | B) ConventionalHome Purchase Loans | C) Refinancings | D) Home Improvement Loans | E) Loans on Dwellings For 5+ Families | F) Non-occupant Loans on < 5 Family Dwellings (A B C & D) | G) Loans On ManufacturedHome Dwelling (A B C & D) | ||||||||
| Number | Average Value | Number | Average Value | Number | Average Value | Number | Average Value | Number | Average Value | Number | Average Value | Number | Average Value | |
| LOANS ORIGINATED | 45 | 164,565∣4,161∣164,565 | 4,161 | 164,565∣4,161∣155,470 | 4,498 | 139,195∣810∣139,195 | 810 | 139,195∣810∣54,754 | 111 | 2,228,132∣875∣2,228,132 | 875 | 2,228,132∣875∣175,115 | 12 | $20,742 |
| APPLICATIONS APPROVED, NOT ACCEPTED | 1 | 192,830∣288∣192,830 | 288 | 192,830∣288∣148,496 | 487 | 137,220∣79∣137,220 | 79 | 137,220∣79∣46,799 | 5 | 2,692,000∣41∣2,692,000 | 41 | 2,692,000∣41∣159,956 | 4 | $26,432 |
| APPLICATIONS DENIED | 13 | 125,330∣532∣125,330 | 532 | 125,330∣532∣144,611 | 1,227 | 151,276∣172∣151,276 | 172 | 151,276∣172∣68,291 | 5 | 651,020∣114∣651,020 | 114 | 651,020∣114∣182,736 | 38 | $34,737 |
| APPLICATIONS WITHDRAWN | 4 | 163,658∣365∣163,658 | 365 | 163,658∣365∣159,509 | 893 | 148,228∣103∣148,228 | 103 | 148,228∣103∣121,714 | 4 | 4,375,880∣75∣4,375,880 | 75 | 4,375,880∣75∣175,271 | 2 | $46,685 |
| FILES CLOSED FOR INCOMPLETENESS | 2 | 188,770∣163∣188,770 | 163 | 188,770∣163∣136,608 | 557 | 163,821∣12∣163,821 | 12 | 163,821∣12∣61,194 | 1 | 4,900,000∣18∣4,900,000 | 18 | 4,900,000∣18∣177,808 | 0 | $0 |
| Aggregated Statistics For Year 2004_(Based on 35 full and 20 partial tracts)_ | ||||||||||||||
|---|---|---|---|---|---|---|---|---|---|---|---|---|---|---|
| A) FHA, FSA/RHS & VAHome Purchase Loans | B) ConventionalHome Purchase Loans | C) Refinancings | D) Home Improvement Loans | E) Loans on Dwellings For 5+ Families | F) Non-occupant Loans on < 5 Family Dwellings (A B C & D) | G) Loans On ManufacturedHome Dwelling (A B C & D) | ||||||||
| Number | Average Value | Number | Average Value | Number | Average Value | Number | Average Value | Number | Average Value | Number | Average Value | Number | Average Value | |
| LOANS ORIGINATED | 78 | 158,466∣3,785∣158,466 | 3,785 | 158,466∣3,785∣156,358 | 5,137 | 140,283∣780∣140,283 | 780 | 140,283∣780∣49,602 | 141 | 1,335,837∣1,003∣1,335,837 | 1,003 | 1,335,837∣1,003∣174,280 | 17 | $70,941 |
| APPLICATIONS APPROVED, NOT ACCEPTED | 5 | 165,048∣292∣165,048 | 292 | 165,048∣292∣146,724 | 394 | 134,293∣69∣134,293 | 69 | 134,293∣69∣46,931 | 2 | 6,070,260∣47∣6,070,260 | 47 | 6,070,260∣47∣167,608 | 9 | $31,098 |
| APPLICATIONS DENIED | 14 | 129,385∣398∣129,385 | 398 | 129,385∣398∣130,710 | 960 | 133,295∣193∣133,295 | 193 | 133,295∣193∣54,869 | 2 | 514,405∣73∣514,405 | 73 | 514,405∣73∣158,697 | 27 | $40,377 |
| APPLICATIONS WITHDRAWN | 15 | 150,259∣307∣150,259 | 307 | 150,259∣307∣155,703 | 834 | 145,324∣56∣145,324 | 56 | 145,324∣56∣59,509 | 1 | 449,260∣83∣449,260 | 83 | 449,260∣83∣160,698 | 1 | $6,010 |
| FILES CLOSED FOR INCOMPLETENESS | 6 | 143,637∣78∣143,637 | 78 | 143,637∣78∣134,864 | 428 | 151,875∣9∣151,875 | 9 | 151,875∣9∣71,296 | 0 | 0∣15∣0 | 15 | 0∣15∣206,663 | 0 | $0 |
| Aggregated Statistics For Year 2003_(Based on 34 full and 20 partial tracts)_ | ||||||||||||
|---|---|---|---|---|---|---|---|---|---|---|---|---|
| A) FHA, FSA/RHS & VAHome Purchase Loans | B) ConventionalHome Purchase Loans | C) Refinancings | D) Home Improvement Loans | E) Loans on Dwellings For 5+ Families | F) Non-occupant Loans on < 5 Family Dwellings (A B C & D) | |||||||
| Number | Average Value | Number | Average Value | Number | Average Value | Number | Average Value | Number | Average Value | Number | Average Value | |
| LOANS ORIGINATED | 109 | 147,662∣3,603∣147,662 | 3,603 | 147,662∣3,603∣150,681 | 14,418 | 131,653∣534∣131,653 | 534 | 131,653∣534∣32,878 | 147 | 1,509,020∣1,479∣1,509,020 | 1,479 | 1,509,020∣1,479∣157,601 |
| APPLICATIONS APPROVED, NOT ACCEPTED | 2 | 146,430∣267∣146,430 | 267 | 146,430∣267∣144,280 | 645 | 131,744∣46∣131,744 | 46 | 131,744∣46∣25,458 | 8 | 3,269,199∣67∣3,269,199 | 67 | 3,269,199∣67∣156,992 |
| APPLICATIONS DENIED | 11 | 141,617∣305∣141,617 | 305 | 141,617∣305∣115,497 | 1,568 | 128,905∣117∣128,905 | 117 | 128,905∣117∣31,149 | 6 | 8,765,418∣104∣8,765,418 | 104 | 8,765,418∣104∣145,218 |
| APPLICATIONS WITHDRAWN | 12 | 143,555∣268∣143,555 | 268 | 143,555∣268∣149,792 | 1,036 | 136,273∣35∣136,273 | 35 | 136,273∣35∣39,973 | 9 | 2,388,332∣99∣2,388,332 | 99 | 2,388,332∣99∣158,273 |
| FILES CLOSED FOR INCOMPLETENESS | 9 | 132,811∣59∣132,811 | 59 | 132,811∣59∣163,816 | 273 | 150,361∣11∣150,361 | 11 | 150,361∣11∣31,697 | 0 | 0∣27∣0 | 27 | 0∣27∣176,003 |
| Aggregated Statistics For Year 2002_(Based on 26 full and 12 partial tracts)_ | ||||||||||||
|---|---|---|---|---|---|---|---|---|---|---|---|---|
| A) FHA, FSA/RHS & VAHome Purchase Loans | B) ConventionalHome Purchase Loans | C) Refinancings | D) Home Improvement Loans | E) Loans on Dwellings For 5+ Families | F) Non-occupant Loans on < 5 Family Dwellings (A B C & D) | |||||||
| Number | Average Value | Number | Average Value | Number | Average Value | Number | Average Value | Number | Average Value | Number | Average Value | |
| LOANS ORIGINATED | 113 | 133,359∣2,370∣133,359 | 2,370 | 133,359∣2,370∣133,090 | 8,976 | 125,474∣433∣125,474 | 433 | 125,474∣433∣27,054 | 90 | 1,470,934∣839∣1,470,934 | 839 | 1,470,934∣839∣146,159 |
| APPLICATIONS APPROVED, NOT ACCEPTED | 5 | 114,732∣160∣114,732 | 160 | 114,732∣160∣139,206 | 435 | 126,871∣44∣126,871 | 44 | 126,871∣44∣18,369 | 3 | 1,070,667∣40∣1,070,667 | 40 | 1,070,667∣40∣149,650 |
| APPLICATIONS DENIED | 7 | 140,296∣167∣140,296 | 167 | 140,296∣167∣116,754 | 724 | 109,428∣87∣109,428 | 87 | 109,428∣87∣15,361 | 3 | 307,497∣46∣307,497 | 46 | 307,497∣46∣157,503 |
| APPLICATIONS WITHDRAWN | 9 | 120,378∣162∣120,378 | 162 | 120,378∣162∣158,759 | 565 | 126,448∣23∣126,448 | 23 | 126,448∣23∣34,876 | 1 | 3,400,000∣53∣3,400,000 | 53 | 3,400,000∣53∣186,779 |
| FILES CLOSED FOR INCOMPLETENESS | 4 | 151,298∣45∣151,298 | 45 | 151,298∣45∣128,732 | 221 | 126,056∣8∣126,056 | 8 | 126,056∣8∣21,606 | 0 | 0∣11∣0 | 11 | 0∣11∣121,770 |
| Aggregated Statistics For Year 2001_(Based on 26 full and 12 partial tracts)_ | ||||||||||||
|---|---|---|---|---|---|---|---|---|---|---|---|---|
| A) FHA, FSA/RHS & VAHome Purchase Loans | B) ConventionalHome Purchase Loans | C) Refinancings | D) Home Improvement Loans | E) Loans on Dwellings For 5+ Families | F) Non-occupant Loans on < 5 Family Dwellings (A B C & D) | |||||||
| Number | Average Value | Number | Average Value | Number | Average Value | Number | Average Value | Number | Average Value | Number | Average Value | |
| LOANS ORIGINATED | 153 | 123,759∣2,121∣123,759 | 2,121 | 123,759∣2,121∣128,592 | 5,637 | 119,008∣535∣119,008 | 535 | 119,008∣535∣21,668 | 82 | 1,187,260∣654∣1,187,260 | 654 | 1,187,260∣654∣137,252 |
| APPLICATIONS APPROVED, NOT ACCEPTED | 10 | 105,841∣152∣105,841 | 152 | 105,841∣152∣116,432 | 340 | 102,812∣46∣102,812 | 46 | 102,812∣46∣16,889 | 2 | 232,185∣25∣232,185 | 25 | 232,185∣25∣135,800 |
| APPLICATIONS DENIED | 13 | 109,710∣157∣109,710 | 157 | 109,710∣157∣95,624 | 646 | 94,805∣98∣94,805 | 98 | 94,805∣98∣22,669 | 6 | 382,717∣36∣382,717 | 36 | 382,717∣36∣119,304 |
| APPLICATIONS WITHDRAWN | 6 | 121,077∣141∣121,077 | 141 | 121,077∣141∣122,763 | 453 | 112,895∣39∣112,895 | 39 | 112,895∣39∣26,185 | 2 | 802,850∣32∣802,850 | 32 | 802,850∣32∣114,566 |
| FILES CLOSED FOR INCOMPLETENESS | 3 | 111,347∣32∣111,347 | 32 | 111,347∣32∣110,510 | 111 | 117,908∣11∣117,908 | 11 | 117,908∣11∣29,495 | 0 | 0∣0∣0 | 0 | 0∣0∣0 |
| Aggregated Statistics For Year 2000_(Based on 26 full and 12 partial tracts)_ | ||||||||||||
|---|---|---|---|---|---|---|---|---|---|---|---|---|
| A) FHA, FSA/RHS & VAHome Purchase Loans | B) ConventionalHome Purchase Loans | C) Refinancings | D) Home Improvement Loans | E) Loans on Dwellings For 5+ Families | F) Non-occupant Loans on < 5 Family Dwellings (A B C & D) | |||||||
| Number | Average Value | Number | Average Value | Number | Average Value | Number | Average Value | Number | Average Value | Number | Average Value | |
| LOANS ORIGINATED | 111 | 119,330∣2,013∣119,330 | 2,013 | 119,330∣2,013∣120,191 | 1,029 | 94,195∣564∣94,195 | 564 | 94,195∣564∣20,099 | 59 | 890,095∣326∣890,095 | 326 | 890,095∣326∣121,913 |
| APPLICATIONS APPROVED, NOT ACCEPTED | 3 | 101,767∣136∣101,767 | 136 | 101,767∣136∣120,246 | 118 | 75,401∣40∣75,401 | 40 | 75,401∣40∣29,631 | 1 | 503,850∣12∣503,850 | 12 | 503,850∣12∣102,048 |
| APPLICATIONS DENIED | 12 | 116,442∣210∣116,442 | 210 | 116,442∣210∣84,856 | 397 | 79,348∣81∣79,348 | 81 | 79,348∣81∣26,341 | 4 | 569,132∣23∣569,132 | 23 | 569,132∣23∣111,041 |
| APPLICATIONS WITHDRAWN | 9 | 135,888∣157∣135,888 | 157 | 135,888∣157∣103,895 | 233 | 83,268∣27∣83,268 | 27 | 83,268∣27∣37,425 | 2 | 213,500∣12∣213,500 | 12 | 213,500∣12∣74,679 |
| FILES CLOSED FOR INCOMPLETENESS | 7 | 112,814∣34∣112,814 | 34 | 112,814∣34∣106,030 | 109 | 93,309∣6∣93,309 | 6 | 93,309∣6∣27,722 | 0 | 0∣5∣0 | 5 | 0∣5∣125,382 |
| Aggregated Statistics For Year 1999_(Based on 38 full and 19 partial tracts)_ | ||||||||||||
|---|---|---|---|---|---|---|---|---|---|---|---|---|
| A) FHA, FSA/RHS & VAHome Purchase Loans | B) ConventionalHome Purchase Loans | C) Refinancings | D) Home Improvement Loans | E) Loans on Dwellings For 5+ Families | F) Non-occupant Loans on < 5 Family Dwellings (A B C & D) | |||||||
| Number | Average Value | Number | Average Value | Number | Average Value | Number | Average Value | Number | Average Value | Number | Average Value | |
| LOANS ORIGINATED | 190 | 110,003∣2,841∣110,003 | 2,841 | 110,003∣2,841∣118,045 | 3,136 | 98,945∣865∣98,945 | 865 | 98,945∣865∣19,603 | 130 | 842,017∣618∣842,017 | 618 | 842,017∣618∣122,217 |
| APPLICATIONS APPROVED, NOT ACCEPTED | 4 | 114,250∣181∣114,250 | 181 | 114,250∣181∣112,123 | 275 | 88,297∣49∣88,297 | 49 | 88,297∣49∣18,975 | 8 | 2,858,442∣29∣2,858,442 | 29 | 2,858,442∣29∣121,806 |
| APPLICATIONS DENIED | 26 | 96,299∣218∣96,299 | 218 | 96,299∣218∣85,886 | 592 | 87,962∣109∣87,962 | 109 | 87,962∣109∣20,533 | 5 | 1,330,824∣32∣1,330,824 | 32 | 1,330,824∣32∣88,686 |
| APPLICATIONS WITHDRAWN | 8 | 93,415∣204∣93,415 | 204 | 93,415∣204∣115,834 | 440 | 90,280∣84∣90,280 | 84 | 90,280∣84∣55,026 | 2 | 909,955∣45∣909,955 | 45 | 909,955∣45∣117,595 |
| FILES CLOSED FOR INCOMPLETENESS | 5 | 107,602∣54∣107,602 | 54 | 107,602∣54∣115,401 | 210 | 92,462∣6∣92,462 | 6 | 92,462∣6∣20,735 | 0 | 0∣12∣0 | 12 | 0∣12∣100,693 |
Detailed mortgage data for all 55 tracts in Madison, WI
| Private Mortgage Insurance Companies Aggregated Statistics For Year 2009_(Based on 31 full and 19 partial tracts)_ | ||||||
|---|---|---|---|---|---|---|
| A) ConventionalHome Purchase Loans | B) Refinancings | C) Non-occupant Loans on < 5 Family Dwellings (A & B) | ||||
| Number | Average Value | Number | Average Value | Number | Average Value | |
| LOANS ORIGINATED | 440 | 184,776∣432∣184,776 | 432 | 184,776∣432∣189,919 | 2 | $94,340 |
| APPLICATIONS APPROVED, NOT ACCEPTED | 53 | 193,156∣82∣193,156 | 82 | 193,156∣82∣183,854 | 2 | $151,125 |
| APPLICATIONS DENIED | 32 | 182,023∣39∣182,023 | 39 | 182,023∣39∣186,459 | 1 | $155,000 |
| APPLICATIONS WITHDRAWN | 22 | 166,861∣30∣166,861 | 30 | 166,861∣30∣207,167 | 0 | $0 |
| FILES CLOSED FOR INCOMPLETENESS | 4 | 213,658∣3∣213,658 | 3 | 213,658∣3∣167,250 | 1 | $241,000 |
| Aggregated Statistics For Year 2008_(Based on 31 full and 19 partial tracts)_ | ||||||
|---|---|---|---|---|---|---|
| A) ConventionalHome Purchase Loans | B) Refinancings | C) Non-occupant Loans on < 5 Family Dwellings (A & B) | ||||
| Number | Average Value | Number | Average Value | Number | Average Value | |
| LOANS ORIGINATED | 591 | 176,036∣243∣176,036 | 243 | 176,036∣243∣190,242 | 18 | $173,917 |
| APPLICATIONS APPROVED, NOT ACCEPTED | 106 | 164,997∣79∣164,997 | 79 | 164,997∣79∣190,397 | 12 | $146,771 |
| APPLICATIONS DENIED | 23 | 171,109∣12∣171,109 | 12 | 171,109∣12∣188,801 | 4 | $156,905 |
| APPLICATIONS WITHDRAWN | 16 | 176,964∣20∣176,964 | 20 | 176,964∣20∣184,536 | 3 | $133,000 |
| FILES CLOSED FOR INCOMPLETENESS | 6 | 171,293∣5∣171,293 | 5 | 171,293∣5∣143,812 | 3 | $216,467 |
| Aggregated Statistics For Year 2007_(Based on 31 full and 19 partial tracts)_ | ||||||
|---|---|---|---|---|---|---|
| A) ConventionalHome Purchase Loans | B) Refinancings | C) Non-occupant Loans on < 5 Family Dwellings (A & B) | ||||
| Number | Average Value | Number | Average Value | Number | Average Value | |
| LOANS ORIGINATED | 821 | 173,415∣184∣173,415 | 184 | 173,415∣184∣188,671 | 54 | $146,959 |
| APPLICATIONS APPROVED, NOT ACCEPTED | 106 | 182,557∣42∣182,557 | 42 | 182,557∣42∣180,280 | 8 | $171,691 |
| APPLICATIONS DENIED | 7 | 243,361∣6∣243,361 | 6 | 243,361∣6∣205,388 | 3 | $170,993 |
| APPLICATIONS WITHDRAWN | 35 | 170,737∣15∣170,737 | 15 | 170,737∣15∣175,715 | 6 | $170,693 |
| FILES CLOSED FOR INCOMPLETENESS | 4 | 140,368∣0∣140,368 | 0 | 140,368∣0∣0 | 0 | $0 |
| Aggregated Statistics For Year 2006_(Based on 30 full and 19 partial tracts)_ | ||||||
|---|---|---|---|---|---|---|
| A) ConventionalHome Purchase Loans | B) Refinancings | C) Non-occupant Loans on < 5 Family Dwellings (A & B) | ||||
| Number | Average Value | Number | Average Value | Number | Average Value | |
| LOANS ORIGINATED | 615 | 163,238∣97∣163,238 | 97 | 163,238∣97∣183,228 | 23 | $196,573 |
| APPLICATIONS APPROVED, NOT ACCEPTED | 76 | 160,799∣34∣160,799 | 34 | 160,799∣34∣184,133 | 5 | $160,814 |
| APPLICATIONS DENIED | 3 | 116,283∣2∣116,283 | 2 | 116,283∣2∣164,720 | 2 | $105,415 |
| APPLICATIONS WITHDRAWN | 21 | 170,284∣11∣170,284 | 11 | 170,284∣11∣186,335 | 2 | $225,630 |
| FILES CLOSED FOR INCOMPLETENESS | 3 | 161,750∣2∣161,750 | 2 | 161,750∣2∣150,670 | 0 | $0 |
| Aggregated Statistics For Year 2005_(Based on 30 full and 19 partial tracts)_ | ||||||
|---|---|---|---|---|---|---|
| A) ConventionalHome Purchase Loans | B) Refinancings | C) Non-occupant Loans on < 5 Family Dwellings (A & B) | ||||
| Number | Average Value | Number | Average Value | Number | Average Value | |
| LOANS ORIGINATED | 624 | 161,951∣157∣161,951 | 157 | 161,951∣157∣171,951 | 33 | $166,799 |
| APPLICATIONS APPROVED, NOT ACCEPTED | 59 | 172,234∣29∣172,234 | 29 | 172,234∣29∣170,900 | 4 | $212,798 |
| APPLICATIONS DENIED | 3 | 156,557∣2∣156,557 | 2 | 156,557∣2∣241,835 | 1 | $189,500 |
| APPLICATIONS WITHDRAWN | 18 | 183,571∣21∣183,571 | 21 | 183,571∣21∣181,386 | 1 | $38,410 |
| FILES CLOSED FOR INCOMPLETENESS | 5 | 155,936∣1∣155,936 | 1 | 155,936∣1∣243,840 | 0 | $0 |
| Aggregated Statistics For Year 2004_(Based on 31 full and 19 partial tracts)_ | ||||||
|---|---|---|---|---|---|---|
| A) ConventionalHome Purchase Loans | B) Refinancings | C) Non-occupant Loans on < 5 Family Dwellings (A & B) | ||||
| Number | Average Value | Number | Average Value | Number | Average Value | |
| LOANS ORIGINATED | 644 | 159,796∣196∣159,796 | 196 | 159,796∣196∣160,972 | 39 | $178,232 |
| APPLICATIONS APPROVED, NOT ACCEPTED | 112 | 166,950∣54∣166,950 | 54 | 166,950∣54∣149,371 | 4 | $113,690 |
| APPLICATIONS DENIED | 10 | 176,501∣2∣176,501 | 2 | 176,501∣2∣111,375 | 2 | $137,085 |
| APPLICATIONS WITHDRAWN | 31 | 175,910∣29∣175,910 | 29 | 175,910∣29∣158,427 | 8 | $195,366 |
| FILES CLOSED FOR INCOMPLETENESS | 2 | 140,020∣1∣140,020 | 1 | 140,020∣1∣112,000 | 0 | $0 |
| Aggregated Statistics For Year 2003_(Based on 31 full and 19 partial tracts)_ | ||||||
|---|---|---|---|---|---|---|
| A) ConventionalHome Purchase Loans | B) Refinancings | C) Non-occupant Loans on < 5 Family Dwellings (A & B) | ||||
| Number | Average Value | Number | Average Value | Number | Average Value | |
| LOANS ORIGINATED | 835 | 152,526∣822∣152,526 | 822 | 152,526∣822∣148,014 | 52 | $147,127 |
| APPLICATIONS APPROVED, NOT ACCEPTED | 106 | 148,440∣151∣148,440 | 151 | 148,440∣151∣146,601 | 8 | $152,991 |
| APPLICATIONS DENIED | 9 | 174,736∣5∣174,736 | 5 | 174,736∣5∣135,932 | 2 | $117,935 |
| APPLICATIONS WITHDRAWN | 40 | 158,275∣49∣158,275 | 49 | 158,275∣49∣137,400 | 9 | $142,441 |
| FILES CLOSED FOR INCOMPLETENESS | 0 | 0∣0∣0 | 0 | 0∣0∣0 | 0 | $0 |
| Aggregated Statistics For Year 2002_(Based on 23 full and 12 partial tracts)_ | ||||||
|---|---|---|---|---|---|---|
| A) ConventionalHome Purchase Loans | B) Refinancings | C) Non-occupant Loans on < 5 Family Dwellings (A & B) | ||||
| Number | Average Value | Number | Average Value | Number | Average Value | |
| LOANS ORIGINATED | 623 | 141,124∣531∣141,124 | 531 | 141,124∣531∣139,983 | 36 | $155,769 |
| APPLICATIONS APPROVED, NOT ACCEPTED | 76 | 150,827∣79∣150,827 | 79 | 150,827∣79∣143,117 | 5 | $175,124 |
| APPLICATIONS DENIED | 4 | 136,000∣5∣136,000 | 5 | 136,000∣5∣162,490 | 1 | $215,460 |
| APPLICATIONS WITHDRAWN | 29 | 128,550∣28∣128,550 | 28 | 128,550∣28∣149,209 | 5 | $143,900 |
| FILES CLOSED FOR INCOMPLETENESS | 1 | 148,000∣0∣148,000 | 0 | 148,000∣0∣0 | 0 | $0 |
| Aggregated Statistics For Year 2001_(Based on 24 full and 12 partial tracts)_ | ||||||
|---|---|---|---|---|---|---|
| A) ConventionalHome Purchase Loans | B) Refinancings | C) Non-occupant Loans on < 5 Family Dwellings (A & B) | ||||
| Number | Average Value | Number | Average Value | Number | Average Value | |
| LOANS ORIGINATED | 692 | 129,284∣519∣129,284 | 519 | 129,284∣519∣131,933 | 22 | $110,774 |
| APPLICATIONS APPROVED, NOT ACCEPTED | 70 | 137,129∣76∣137,129 | 76 | 137,129∣76∣130,669 | 4 | $117,572 |
| APPLICATIONS DENIED | 5 | 123,026∣12∣123,026 | 12 | 123,026∣12∣139,724 | 4 | $156,312 |
| APPLICATIONS WITHDRAWN | 18 | 127,838∣17∣127,838 | 17 | 127,838∣17∣139,175 | 1 | $120,000 |
| FILES CLOSED FOR INCOMPLETENESS | 3 | 97,040∣5∣97,040 | 5 | 97,040∣5∣133,104 | 0 | $0 |
| Aggregated Statistics For Year 2000_(Based on 23 full and 12 partial tracts)_ | ||||||
|---|---|---|---|---|---|---|
| A) ConventionalHome Purchase Loans | B) Refinancings | C) Non-occupant Loans on < 5 Family Dwellings (A & B) | ||||
| Number | Average Value | Number | Average Value | Number | Average Value | |
| LOANS ORIGINATED | 530 | 124,766∣66∣124,766 | 66 | 124,766∣66∣119,345 | 14 | $135,613 |
| APPLICATIONS APPROVED, NOT ACCEPTED | 51 | 125,283∣8∣125,283 | 8 | 125,283∣8∣123,459 | 1 | $138,000 |
| APPLICATIONS DENIED | 11 | 100,342∣6∣100,342 | 6 | 100,342∣6∣153,962 | 2 | $91,550 |
| APPLICATIONS WITHDRAWN | 21 | 118,074∣7∣118,074 | 7 | 118,074∣7∣131,140 | 2 | $127,500 |
| FILES CLOSED FOR INCOMPLETENESS | 1 | 117,540∣0∣117,540 | 0 | 117,540∣0∣0 | 0 | $0 |
| Aggregated Statistics For Year 1999_(Based on 33 full and 17 partial tracts)_ | ||||||
|---|---|---|---|---|---|---|
| A) ConventionalHome Purchase Loans | B) Refinancings | C) Non-occupant Loans on < 5 Family Dwellings (A & B) | ||||
| Number | Average Value | Number | Average Value | Number | Average Value | |
| LOANS ORIGINATED | 843 | 118,591∣233∣118,591 | 233 | 118,591∣233∣114,345 | 30 | $112,413 |
| APPLICATIONS APPROVED, NOT ACCEPTED | 60 | 116,938∣32∣116,938 | 32 | 116,938∣32∣114,035 | 2 | $95,660 |
| APPLICATIONS DENIED | 14 | 142,649∣2∣142,649 | 2 | 142,649∣2∣91,030 | 1 | $141,340 |
| APPLICATIONS WITHDRAWN | 10 | 92,718∣10∣92,718 | 10 | 92,718∣10∣113,426 | 1 | $104,000 |
| FILES CLOSED FOR INCOMPLETENESS | 1 | 147,780∣0∣147,780 | 0 | 147,780∣0∣0 | 0 | $0 |
2002 - 2018 National Fire Incident Reporting System (NFIRS) incidents
See full National Fire Incident Reporting System statistics for Madison, WI
Fire-safe hotels and motels in Madison, Wisconsin:
- Best Western East Towne Suites, 4801 Annamark Dr, Madison, Wisconsin 53704 , Phone: (608) 244-2020, Fax: (608) 244-3434
- Americinn Madison West, 516 Grand Cyn Dr, Madison, Wisconsin 53719 , Phone: (608) 662-1990, Fax: (608) 833-7140
- Super 8 Madison South, 1602 W Beltline Hwy, Madison, Wisconsin 53713 , Phone: (608) 258-8882, Fax: (608) 258-9575
- Super 8 Madison East, 4765 Hayes Rd, Madison, Wisconsin 53704 , Phone: (608) 249-5300
- Crowne Plaza Madison, 4402 E Washington Ave, Madison, Wisconsin 53704 , Phone: (608) 244-4703, Fax: (608) 244-7829
- Madison Concourse Hotel, 1 W Dayton St, Madison, Wisconsin 53703 , Phone: (608) 257-6000, Fax: (608) 257-5280
- Residence Inn By Marriott Madison East, 4862 Hayes Rd, Madison, Wisconsin 53704 , Phone: (608) 244-5047, Fax: (608) 244-5047
- Best Western West Towne Suites, 650 Grand Canyon Dr, Madison, Wisconsin 53719 , Phone: (608) 833-4200, Fax: (608) 833-5614
- 48 other hotels and motels All 56 fire-safe hotels and motels in Madison, Wisconsin
| Most common first names in Madison, WI among deceased individuals | ||
|---|---|---|
| Name | Count | Lived (average) |
| John | 1,133 | 74.2 years |
| Mary | 1,011 | 79.5 years |
| Robert | 916 | 71.5 years |
| William | 808 | 74.4 years |
| James | 571 | 69.6 years |
| Margaret | 567 | 81.4 years |
| Helen | 552 | 81.6 years |
| George | 507 | 76.3 years |
| Dorothy | 497 | 79.1 years |
| Ruth | 476 | 80.5 years |
| Most common last names in Madison, WI among deceased individuals | ||
|---|---|---|
| Last name | Count | Lived (average) |
| Johnson | 453 | 74.8 years |
| Anderson | 353 | 76.5 years |
| Smith | 312 | 75.8 years |
| Olson | 246 | 76.2 years |
| Miller | 227 | 74.2 years |
| Nelson | 212 | 78.4 years |
| Peterson | 186 | 76.4 years |
| Brown | 158 | 73.1 years |
| Thompson | 150 | 77.9 years |
| Hanson | 149 | 78.8 years |
- 86.5%Utility gas
- 10.3%Electricity
- 1.6%Bottled, tank, or LP gas
- 0.5%Fuel oil, kerosene, etc.
- 0.4%Wood
- 0.3%No fuel used
- 0.2%Other fuel
- 0.2%Solar energy
Madison compared to Wisconsin state average:
- Unemployed percentage below state average.
- Black race population percentage above state average.
- Median age significantly below state average.
- Foreign-born population percentage significantly above state average.
- Renting percentage above state average.
- Number of college students significantly above state average.
- Percentage of population with a bachelor's degree or higher significantly above state average.
Madison, WI compared to other similar cities:
Madison on our top lists:
- #14 on the list of "Top 101 cities with the largest percentage of likely lesbian couples (counted as self-reported female-female unmarried-partner households) (population 50,000+)"
- #19 on the list of "Top 101 cities with largest percentage of males in occupations: life, physical, and social science occupations (population 50,000+)"
- #21 on the list of "Top 101 cities with the lowest percentage of family households, population 100,000+"
- #25 on the list of "Top 101 cities with the lowest daily low temperatures (population 50,000+)"
- #27 on the list of "Top 101 cities with largest percentage of females in occupations: life, physical, and social science occupations (population 50,000+)"
- #30 on the list of "Top 101 cities with the coldest winters (population 50,000+)"
- #33 on the list of "Top 101 cities with the largest percentage of likely homosexual households (counted as self-reported same-sex unmarried-partner households) (population 50,000+)"
- #33 on the list of "Top 101 cities with largest percentage of males in occupations: education, training, and library occupations (population 50,000+)"
- #36 on the list of "Top 101 cities with the lowest average temperatures (population 50,000+)"
- #36 on the list of "Top 101 cities with largest percentage of males in industries: educational services (population 50,000+)"
- #38 on the list of "Top 101 cities with the most people having Doctorate degrees (population 50,000+)"
- #40 on the list of "Top 101 cities with the largest temperature differences during a year (population 50,000+)"
- #57 on the list of "Top 101 cities with largest percentage of females in industries: educational services (population 50,000+)"
- #60 on the list of "Top 101 cities with the most people having Master's or Doctorate degrees (population 50,000+)"
- #69 on the list of "Top 101 cities with largest percentage of females in industries: information (population 50,000+)"
- #74 on the list of "Top 101 cities with largest percentage of males in occupations: computer and mathematical occupations (population 50,000+)"
- #75 on the list of "Top 101 cities with largest percentage of males in occupations: arts, design, entertainment, sports, and media occupations (population 50,000+)"
- #82 on the list of "Top 101 cities with largest percentage of females in occupations: health diagnosing and treating practitioners and other technical occupations (population 50,000+)"
- #84 on the list of "Top 101 cities with the most local government spending on current operations of parking facilities per resident (population 10,000+)"
- #84 on the list of "Top 100 best educated cities (highest percentage of bachelor degree holding residents) (pop. 50,000+)"
- #1 (53706) on the list of "Top 101 zip codes with the largest percentage of returns reporting salary or wage in 2012 (pop 1,000+)"
- #6 (53706) on the list of "Top 101 zip codes with the lowest average reported salary/wage in 2012 (pop 5,000+)"
- #14 (53706) on the list of "Top 101 zip codes with the lowest 2012 average Adjusted Gross Income (AGI) for individuals (pop 5,000+)"
- #25 (53703) on the list of "Top 101 zip codes with the smallest percentage of taxpayers using paid preparers for 2012 taxes (pop 5,000+)"
- #27 (53706) on the list of "Top 101 zip codes with the lowest 2012 average taxable interest for individuals (pop 5,000+)"
- #36 (53703) on the list of "Top 101 zip codes with the most alcohol drinking places in 2005"
- #93 (53703) on the list of "Top 101 zip codes with the most full service restaurants in 2005"
- #4 on the list of "Top 101 counties with the largest increase in the number of infant deaths per 1000 residents 2000-2006 to 2007-2013 (pop. 50,000+)"
- #39 on the list of "Top 101 counties with the most Mainline Protestant adherents"
- #45 on the list of "Top 101 counties with highest percentage of residents voting for Obama (Democrat) in the 2012 Presidential Election (pop. 50,000+)"
- #48 on the list of "Top 101 counties with the highest ground withdrawal of fresh water for public supply"
- #64 on the list of "Top 101 counties with the lowest percentage of residents relocating from foreign countries between 2010 and 2011"
There are 323 pilots and 88 other airmen in this city.
State forum archive:

Top Patent Applicants
| Nathaniel J. Page (72) Goetz Graefe (51) James A. Thomson (40) Randy D. Cortright (34) Ronald T. Raines (32) | Mark C. Shults (30) Christopher E. Holm (30) Cheemen Yu (27) Graham P. Lidgard (27) Rathbun K. Rhodes (26) |
|---|
Total of 4785 patent applications in 2008-2024.