Acid and Base pH Indicators (original) (raw)
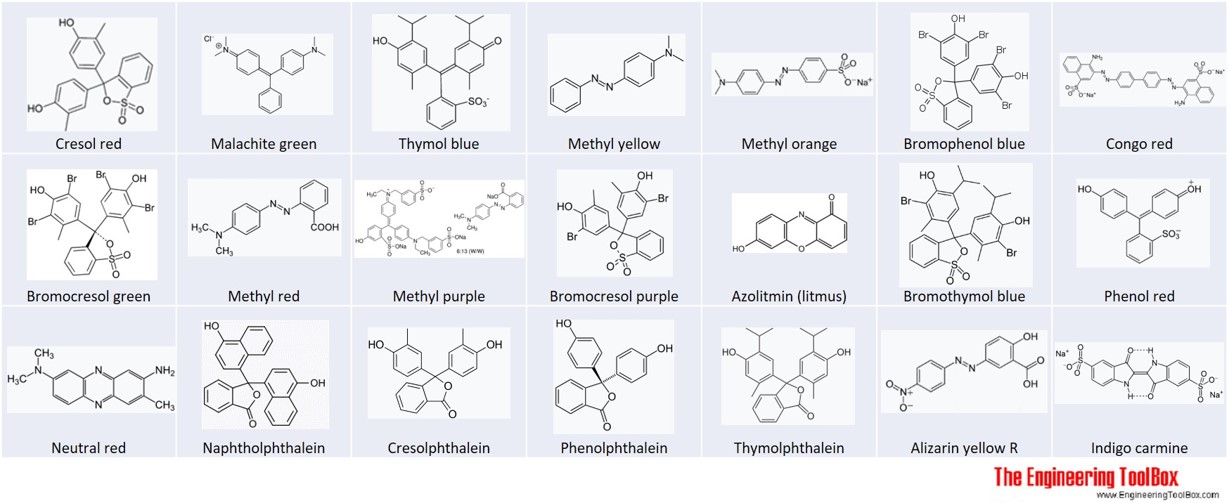
pH range vs. color change for acid and base indicators - together with pKa and structures of the indicators.
The ranges for the color changes are given in the table below the figure, together with the corresponding pKa value of the indicators.
Acid and Base pH Indicators
| Trade name | pH start | pH end | pKa | low pH color | high pH color |
|---|---|---|---|---|---|
| Cresol red - step 1 | 0.2 | 1.8 | 1.0 | red | yellow |
| Malachite green -step 1 | 0.2 | 1.8 | 1.3 | yellow | green |
| Thymol blue - step 1 | 1.2 | 2.8 | 1.7 | red | yellow |
| Methyl yellow | 2.9 | 4.0 | 3.3 | red | yellow |
| Methyl orange | 3.1 | 4.4 | 3.5 | red | yellow |
| Bromophenol blue | 3.0 | 4.6 | 4.1 | yellow | blue |
| Congo red | 3.0 | 5.0 | blue-violet | red | |
| Methyl orange in xylene cyanol (screened) | 3.2 | 4.2 | grey-violet | green | |
| Bromocresol green | 3.8 | 5.4 | 4.7 | yellow | blue |
| Methyl red | 4.4 | 6.2 | 5.1 | red | yellow |
| Methyl purple | 4.8 | 5.4 | purple | green | |
| Bromocresol purple | 5.2 | 6.8 | 6.4 | yellow | purple |
| Azolitmin (litmus) | 4.5 | 8.3 | red | blue | |
| Bromothymol blue | 6.0 | 7.6 | 7.3 | yellow | blue |
| Phenol red | 6.4 | 8.0 | 8.0 | yellow | red |
| Neutral red | 6.8 | 8.0 | red | yellow | |
| Cresol red -step 2 | 7.2 | 8.8 | 8.5 | yellow | reddish-purple |
| Naphtholphthalein | 7.3 | 8.7 | pale red | greenish-blue | |
| Thymol blue - step 2 | 8.0 | 9.6 | 9.2 | yellow | blue |
| Cresolphthalein | 8.2 | 9.8 | colorless | purple | |
| Phenolphthalein | 8.3 | 10.0 | 9.5 | colorless | red-pink |
| Thymolphthalein | 9.0 | 10.5 | 9.2 | colorless | blue |
| Alizarin yellow R | 10.1 | 12.0 | 11.2 | yellow | red |
| Indigo carmine | 11.4 | 13.0 | blue | yellow | |
| Malachite green -step 2 | 11.5 | 13.2 | green | colorless |
My Short List
Related Topics
Properties of gases, fluids and solids. Densities, specific heats, viscosities and more.
Related Documents
Buffer Solutions

Definitions, explanations and examples of how to make buffer solutions.
Strong and Weak Acids and Bases
The most common strong acids and bases, and some examples of weak acids and bases, together with definition of strong and weak acids and bases.
Our Mission
The Engineering ToolBox provides a wide range of free tools, calculators, and information resources aimed at engineers and designers. It offers detailed technical data and calculations for various fields such as fluid mechanics, material properties, HVAC systems, electrical engineering, and more.
The site includes resources for common engineering tasks, such as calculating physical properties (e.g., density, viscosity, thermal conductivity), converting units, and designing systems like heating and water distribution.
With sections on everything from acoustics to hydraulics, it serves as a comprehensive tool for both students and professionals in technical and engineering disciplines.
About the Engineering ToolBox!
Privacy Policy
We don't collect information from our users. More about our privacy policy here.
We use a third-party to provide monetization technology for our site. You can review their privacy and cookie policy here.
You can change your privacy settings by clicking the following button: .
Citation
This page can be cited as
- The Engineering ToolBox (2017). Acid and Base pH Indicators. [online] Available at: https://www.engineeringtoolbox.com/pH-color-change-acid-base-pKa-structure-indicator-d\_1951.html [Accessed Day Month Year].
Modify the access date according your visit.