Lubricating Oil - Densities vs. Temperature (original) (raw)
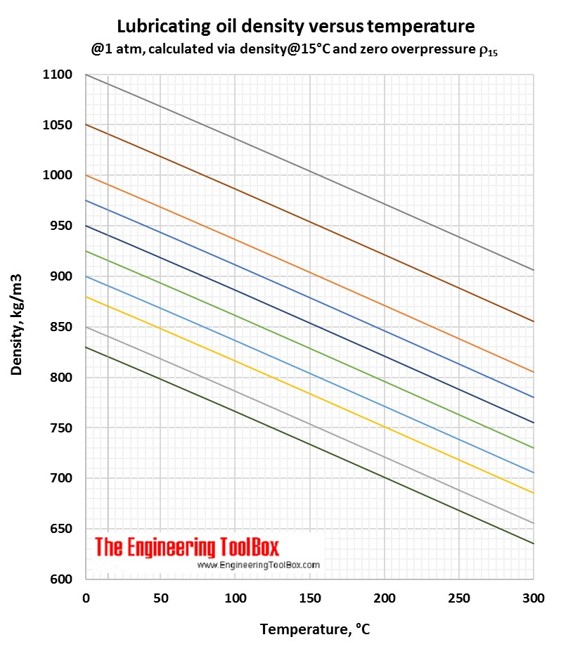
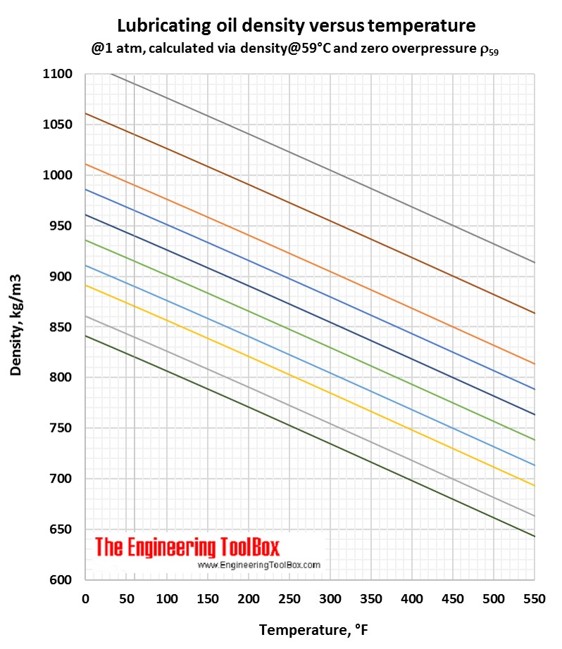
Correlations for lubricating oil density and temperature are calculated by use of tools based on ASTM D 1250-04 and IP 200/04 (API Manual of Petroleum Measurement Standards, Chapter 11- physical properties Data, Section 1:Temperature and pressure volume correction factors for generalised crude oils, refined products and lubricating oils). Each colored line represents a lubricate with a given density at a given temperature. If the temperature changes, the density of the lubricate changes along the colored line.
Examples of the use of the figures are given below the figures.
If you have the lubricating oil density given in °API, use the API-to-gravity converter.
See also similar correlations for fuel oil, crude oil and jet fuel.
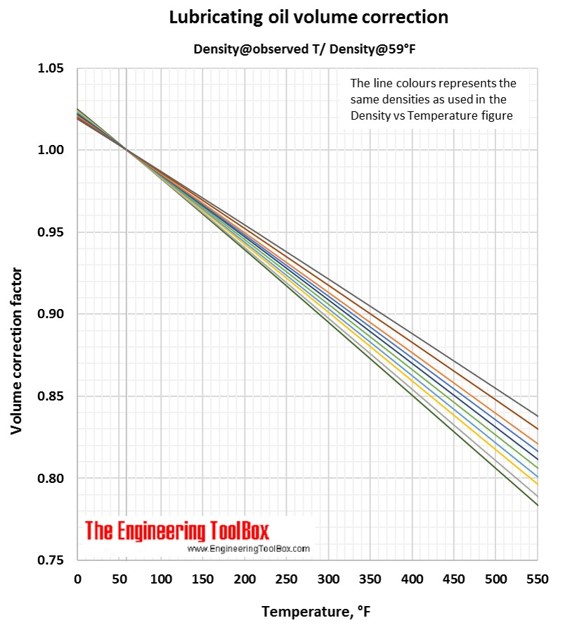
Volume correction factors can be used to calculate the volume of a product at base temperature (15°C/59°F) if you know the density and volume at another temperature. Or, if you know the base volume and density, you can use the volume correction factor to calculate the volume at another temperature. To be sure you have used the correct figure for correction factors, the easy rule is that the volume increases with increasing temperature.
Examples of the use:
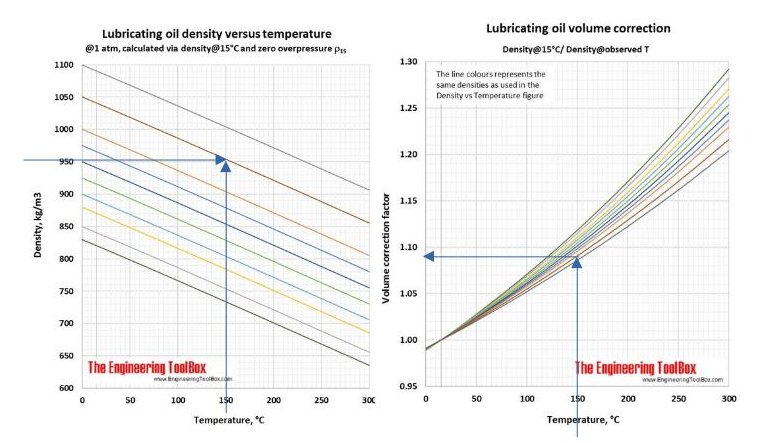
You have 100 liters of a lubricating oil with a density of 954 kg/m3 at 150°C. What is the volume at 15°C?
In the Density vs temperature figure(°C), you see that the brown line represent this lubricating oil.
Then, use the brown line in the Lubricating oil volume correction figure (Density@observed T/Density@15°C). At 150°C the correction factor is 1.09.
The volume of your lubricating oil at 15°C is 100 liters / 1.09 = 92 liters. (Easy check: Lowest volume at the lowest temperature)
You have 10 m3 of a lubricating oil with a density of 941 kg/m3 at 15°C. How will the volume change if you heat it to 200°C?
In the Density vs temperature figure (°C), you see that the dark blue line represent this lubricating oil.
Then, use the dark blue line in the Lubricating oils volume correction figure (Density@15°C/Density@observed T). At 200°C the correction factor is 1.145.
The volume of your lubricating oil at 200°C is 10m3 *1.145 = 11.45 m3. (Easy check: Lowest volume at the lowest temperature)
Related Documents
Densities of Aqueous Solutions of Organic Acids

Changes in density of aqueous solutions with changes in concentration at 20°C. Density of acetic acid, citric acid, formic acid, D-lactic acid, oxalic acid and trichloroacetic acid in water is plotted as function of wt%, mol/kg water and mol/l solution.
Elements of the Periodic System

The elements of the periodic system with names, symbols, atomic numbers and weights, melting and boiling points, density, electronegativity and electron affinity, and electron configuration.
Hydrocarbons - Physical Data
Molweight, melting and boiling point, density, flash point and autoignition temperature, as well as number of carbon and hydrogen atoms in each molecule for 200 different hydrocarbons.
Liquid Densities
Densities of common liquids like acetone, beer, oil, water and more.
Organic Nitrogen Compounds - Physical Data
Boiling and melting points of amines, diamines, pyrroles, pyridines, piperidines and quinolines shown together with their molecular structures, as well as molweights and density.
Organic Sulfur Compounds - Densities
Liquid density of different kinds of organic sulfur compounds with varying carbon number (20°C/68°F). Comparison of thiols, sulfides, disulfides and thiophenes.
Petroleum Products - Average Boiling Points
Definition, explanation and examples of calculation of various types of average boiling point of petroleum products and other mixtures of hydrocarbons: VABP, MABP, WABP, CABP and MeABP.
Yield Structure of Crude Oils with Increasing Density of Crude

Yields of different crude oil distillation cuts are plotted as function of whole crude specific gravity. Fractions based on European and North American markets, and the typical differences in crude oil fractionation in the two markets are also shown.