Clean Missing Data - Find, fill, or remove missing data in the Live Editor - MATLAB (original) (raw)
Find, fill, or remove missing data in the Live Editor
Description
The Clean Missing Data task lets you interactively handle missing data values such as NaN or<missing>. The task automatically generates MATLAB® code for your live script.
Using this task, you can:
- Find, fill, or remove missing data in a workspace variable.
- Customize the method for filling data.
- Define nonstandard missing value indicators.
- Visualize the missing data and the cleaned data.
Open the Task
To add the Clean Missing Data task to a live script in the MATLAB Editor:
- On the Live Editor tab, select > .
- In a code block in the script, type a relevant keyword, such as
missing,NaN,fill, orremove. SelectClean Missing Datafrom the suggested command completions. For some keywords, the task automatically updates one or more corresponding parameters.
Examples
Interactively fill missing values in nonuniformly sampled data.
Create a vector of nonuniform sample points, and evaluate the sine function over the points.
x = [-4pi:0.1:0 0.1:0.2:4pi]; A = sin(x);
Inject missing values into A.
A(A < 0.75 & A > 0.5) = missing;
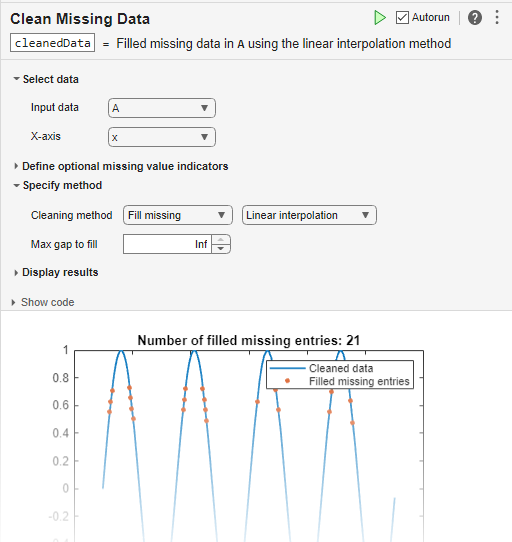
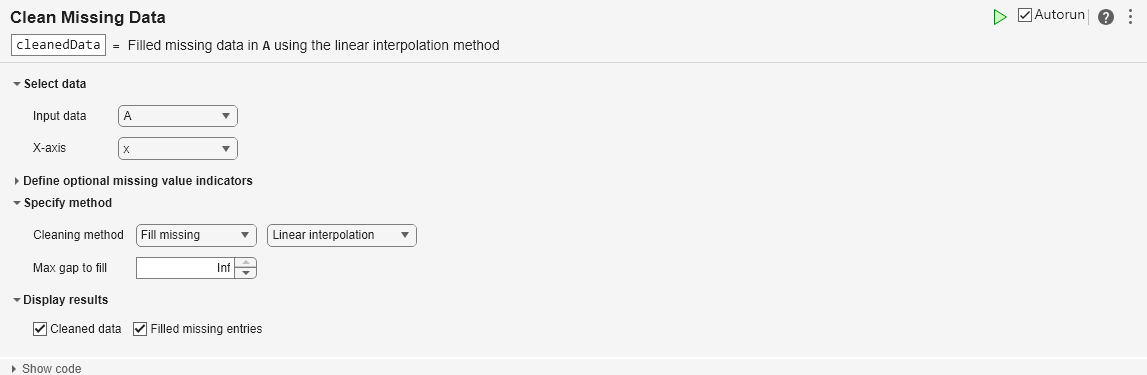
Open the Clean Missing Data task in the Live Editor. To clean the data, select A as the input data and x as the _x_-axis coordinates of the data.
The Clean Missing Data task can fill or remove missing data. To fill the missing entries using linear interpolation of neighboring nonmissing values, use the Cleaning method field to select Fill missing and Linear interpolation.
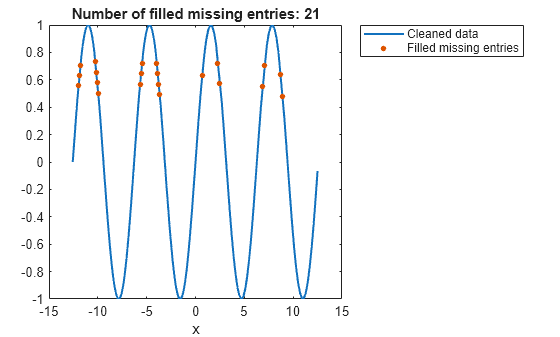
The task plots the cleaned data and indicates that the linear interpolation filled 21 missing entries in the input data.
Because the default legend location covers some filled missing entries, specify the legend location as the outside top-right corner of the axes.
 legend("Location","northeastoutside")
Related Examples
- Add Interactive Tasks to a Live Script
- Clean Messy Data and Locate Extrema Using Live Editor Tasks
- Missing Data in MATLAB
Parameters
This task operates on input data contained in a vector, table, or timetable. The data can be of type single, double,duration, calendarDuration,datetime, categorical,string, char, or cell arrays of character vectors.
When providing a table or timetable for the input data, select All supported variables to clean all variables with a supported type. SelectAll numeric variables to clean all variables of typesingle or double. To choose specific supported variables to clean, select Specified variables and then select the variables individually.
Specify the method for filling missing data as one of these options.
| Method | Description |
|---|---|
| Linear interpolation | Linear interpolation of neighboring, nonmissing values |
| Constant value | Specified scalar value, which is 0 by default |
| Previous value | Previous nonmissing value |
| Next value | Next nonmissing value |
| Nearest value | Nearest nonmissing value as defined by the_x_-axis |
| Spline interpolation | Piecewise cubic spline interpolation |
| Shape-preserving cubic interpolation (PCHIP) | Shape-preserving piecewise cubic spline interpolation |
| Modified Akima cubic interpolation | Modified Akima cubic Hermite interpolation |
| Moving median | Moving median with specified window size |
| Moving mean | Moving mean with specified window size |
| K-nearest neighbors | Mean of nearest neighbors defined by a distance function |
| Custom function | Custom fill method, specified as a local function or a function handle |
Specify the window type and size when the method for filling missing data isMoving median or Moving mean.
| Window | Description |
|---|---|
| Centered | Specified window length centered about the current point |
| Asymmetric | Specified window containing the number of elements before the current point and the number of elements after the current point |
Window sizes are relative to the X-axis variable units.
Version History
Introduced in R2019b
Fill missing entries with the mean of nearby points by using the K-nearest neighbors fill method. Specify the number of neighbors, and define the distance between rows using the Euclidean distance, the scaled Euclidean distance, or a custom function.
Plot nonnumeric data in the display of this Live Editor task. To display a categorical histogram, select a nonnumeric input array or set the field to a nonnumeric table variable containingcategorical, string, cellstr,calendarDuration, or char data types.
In addition, you can simultaneously plot multiple table variables in the display of this task. For table or timetable data, to plot multiple variables in a tiled chart layout, set the field.
Specify the minimum number of missing entries required to remove a row of data. When selecting multiple table variables or a matrix of data for cleaning, select theRemove missing cleaning method, and specify the minimum number of missing entries by using the field.
In addition, you can specify a custom method for filling missing data. First, select theFill missing cleaning method, and then specify a custom fill method by selecting the Custom function cleaning method parameter and the local function or function handle option.
Append input table variables with table variables containing cleaned data. For table or timetable input data, to append the cleaned data, set the field.
This Live Editor task does not run automatically if the inputs have more than 1 million elements. In previous releases, the task always ran automatically for inputs of any size. If the inputs have a large number of elements, then the code generated by this task can take a noticeable amount of time to run (more than a few seconds).
When a task does not run automatically, the Autorun indicator is disabled. You can either run the task manually when needed or choose to enable the task to run automatically.
This Live Editor task can operate on multiple table variables at the same time. For table or timetable input data, to operate on multiple variables, select All supported variables or Specified variables. Return all of the variables or only the modified variables, and specify which variable to visualize.