plotmatrix - Scatter plot matrix - MATLAB (original) (raw)

Syntax
Description
plotmatrix([X](#btrxumd-1-X),[Y](#btrxumd-1-Y)) creates a matrix of subaxes containing scatter plots of the columns of X against the columns of Y. If X is _p_-by-n and Y is _p_-by-m, then plotmatrix produces an _n_-by-m matrix of subaxes.
plotmatrix([X](#btrxumd-1-X)) is the same asplotmatrix(X,X) except that the subaxes along the diagonal are replaced with histogram plots of the data in the corresponding column of X. For example, the subaxes along the diagonal in the _i_th column is replaced byhistogram(X(:,i)). The tick labels along the edges of the plots align with the scatter plots, not the histograms.
plotmatrix(___,[LineSpec](#btrxumd-1%5Fsep%5Fmw%5F3a76f056-2882-44d7-8e73-c695c0c54ca8)) specifies the line style, marker symbol, and color for the scatter plots. The option LineSpec can be preceded by any of the input argument combinations in the previous syntaxes.
plotmatrix([ax](#mw%5F4a154703-783e-424b-9c26-65fe9f667936),___) plots into the specified target axes, where the target axes is an invisible frame for the subaxes.
[[S](#btrxumd-1-S),[AX](#btrxumd-1-AX),[BigAx](#btrxumd-1-BigAx),[H](#btrxumd-1-H),[HAx](#btrxumd-1-HAx)] = plotmatrix(___) returns the graphic objects created as follows:
S– Chart line objects for the scatter plotsAX– Axes objects for each subaxesBigAx– Axes object for big axes that frames the subaxesH– Histogram objects for the histogram plotsHAx– Axes objects for the invisible histogram axes
BigAx is left as the current axes (gca) so that a subsequent title, xlabel, or ylabel command centers text with respect to the big axes.
Examples
Create Scatter Plot Matrix with Two Matrix Inputs
Create X as a matrix of random data and Y as a matrix of integer values. Then, create a scatter plot matrix of the columns of X against the columns of Y.
X = randn(50,3);
Y = reshape(1:150,50,3);
plotmatrix(X,Y)
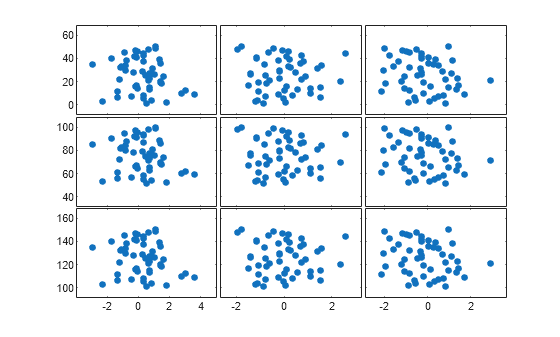
The subplot in the ith row, jth column of the figure is a scatter plot of the ith column of Y against the jth column of X.
Create Scatter Plot Matrix with One Matrix Input
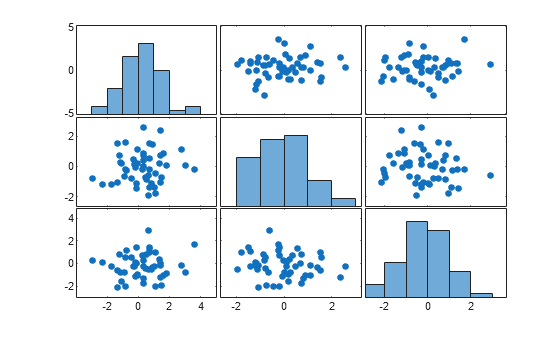
Create a scatter plot matrix of random data. The subplot in the ith row, jth column of the matrix is a scatter plot of the ith column of X against the jth column of X. Along the diagonal are histogram plots of each column of X.
X = randn(50,3);
plotmatrix(X)

Specify Marker Type and Color
Create a scatter plot matrix of random data. Specify the marker type and the color for the scatter plots.
X = randn(50,3);
plotmatrix(X,'*r')

The LineSpec option sets properties for the scatter plots. To set properties for the histogram plots, return the histogram objects.
Modify Scatter Plot Matrix After Creation
Create a scatter plot matrix of random data.
rng default X = randn(50,3); [S,AX,BigAx,H,HAx] = plotmatrix(X);
To set properties for the scatter plots, use S. To set properties for the histograms, use H. To set axes properties, use AX, BigAx, and HAx. Use dot notation to set properties.
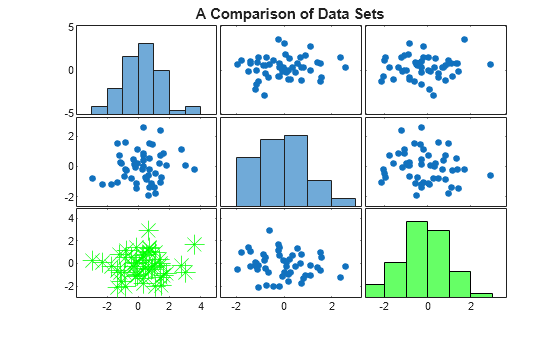
Set the color and marker type for the scatter plot in the lower left corner of the figure. Set the color for the histogram plot in the lower right corner. Use the title command to title the figure.
S(3).Color = 'g'; S(3).Marker = '*';
H(3).EdgeColor = 'k'; H(3).FaceColor = 'g';
title(BigAx,'A Comparison of Data Sets')
Input Arguments
X — Data to display
matrix
Data to display, specified as a matrix.
Data Types: single | double | int8 | int16 | int32 | int64 | uint8 | uint16 | uint32 | uint64 | logical
Y — Data to plot against X
matrix
Data to plot against X, specified as a matrix.
Data Types: single | double | int8 | int16 | int32 | int64 | uint8 | uint16 | uint32 | uint64 | logical
LineSpec — Line style, marker, and color
string scalar | character vector
Line style, marker, and color, specified as a string scalar or character vector containing symbols. The symbols can appear in any order. You do not need to specify all three characteristics (line style, marker, and color). For example, if you omit the line style and specify the marker, then the plot shows only the marker and no line.
Example: "--or" is a red dashed line with circle markers.
| Line Style | Description | Resulting Line |
|---|---|---|
| "-" | Solid line |  |
| "--" | Dashed line |  |
| ":" | Dotted line |  |
| "-." | Dash-dotted line |  |
| Marker | Description | Resulting Marker |
|---|---|---|
| "o" | Circle |  |
| "+" | Plus sign |  |
| "*" | Asterisk |  |
| "." | Point |  |
| "x" | Cross |  |
| "_" | Horizontal line |  |
| "|" | Vertical line |  |
| "square" | Square |  |
| "diamond" | Diamond |  |
| "^" | Upward-pointing triangle |  |
| "v" | Downward-pointing triangle |  |
| ">" | Right-pointing triangle |  |
| "<" | Left-pointing triangle |  |
| "pentagram" | Pentagram |  |
| "hexagram" | Hexagram |  |
| Color Name | Short Name | RGB Triplet | Appearance |
|---|---|---|---|
| "red" | "r" | [1 0 0] |  |
| "green" | "g" | [0 1 0] |  |
| "blue" | "b" | [0 0 1] |  |
| "cyan" | "c" | [0 1 1] |  |
| "magenta" | "m" | [1 0 1] |  |
| "yellow" | "y" | [1 1 0] |  |
| "black" | "k" | [0 0 0] |  |
| "white" | "w" | [1 1 1] |  |
ax — Target axes
Axes object
Target axes that frames all the subaxes, specified as anAxes object. If you do not specify this argument, then plotmatrix uses the current axes.
Output Arguments
S — Chart line objects for scatter plots
matrix
Chart line objects for the scatter plots, returned as a matrix. These are unique identifiers, which you can use to query and modify the properties of a specific scatter plot.
AX — Axes objects for subaxes
matrix
Axes objects for the subaxes, returned as a matrix. These are unique identifiers, which you can use to query and modify the properties of a specific subaxes.
BigAx — Axes object for big axes
scalar
Axes object for big axes, returned as a scalar. This is a unique identifier, which you can use to query and modify properties of the big axes.
H — Histogram objects
vector | []
Histogram objects, returned as a vector or []. These are unique identifiers, which you can use to query and modify the properties of a specific histogram object. If no histogram plots are created, thenH is returned as empty brackets.
HAx — Axes objects for invisible histogram axes
vector | []
Axes objects for invisible histogram axes, returned as a vector or []. These are unique identifiers, which you can use to query and modify the properties of a specific axes. If no histogram plots are created, then HAx is returned as empty brackets.
Extended Capabilities
GPU Arrays
Accelerate code by running on a graphics processing unit (GPU) using Parallel Computing Toolbox™.
The plotmatrix function supports GPU array input with these usage notes and limitations:
- This function accepts GPU arrays, but does not run on a GPU.
For more information, see Run MATLAB Functions on a GPU (Parallel Computing Toolbox).
Distributed Arrays
Partition large arrays across the combined memory of your cluster using Parallel Computing Toolbox™.
Usage notes and limitations:
- This function operates on distributed arrays, but executes in the client MATLAB®.
For more information, see Run MATLAB Functions with Distributed Arrays (Parallel Computing Toolbox).
Version History
Introduced before R2006a
R2015b: H returned as vector of histogram objects
The H output argument is now a vector of histogram objects. In previous releases, it was a vector of patch objects.