Thulium-doped Blue Upconversion Fiber Laser, Numerically Simulated (original) (raw)
![]()
RP Fiber Power — Simulation and Design Software for Fiber Optics, Amplifiers and Fiber Lasers

Figure 1: Level scheme of thulium (Tm3+) ions in ZBLAN fiber.
The short gray arrows indicate multiphonon transitions.
Description of the Model
We numerically simulate a fiber laser with the following properties:
- The fiber is made of ZBLAN glass (→ fluoride fibers) and doped with thulium (Tm3+) ions. Due to the low phonon energies of the ZBLAN glass, the levels 3H4 and 3F2 are metastable (not quenched by multiphonon transitions).
- The thulium ions can be excited to a high-lying electronic level (1G4) by subsequent absorption of three pump photons at 1140 nm. From that level, stimulated emission to the ground state generates blue laser light at 480 nm.
- The left fiber end has a totally reflecting mirror, while the other fiber end has an output coupler mirror with 60% reflectivity.
The model uses spectroscopic data as published in R. Paschotta et al., “Characterization and modeling of thulium:ZBLAN blue upconversion fiber lasers”, J. Opt. Soc. Am. B 14 (5), 1213 (1997).
Note that for this purpose one could also use a nice Power Form, allowing the user to get such results without any own scripting.
Results
Figure 2 shows the power distributions in the fiber, and also the fractional excitation levels of the thulium ions.
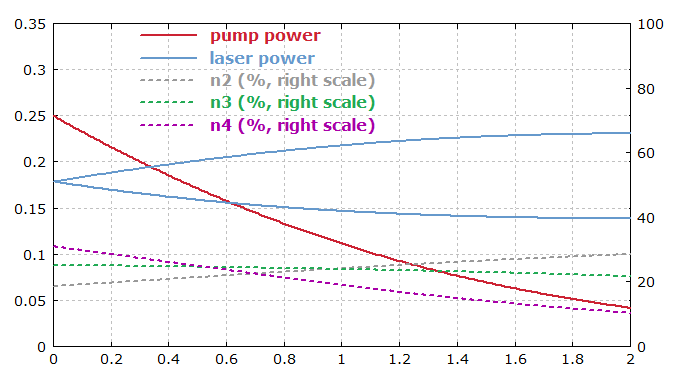
Figure 2: Power distribution in the fiber.
Figure 3 shows the output power as a function of the pump power. Also it shows the degree of excitation of the three metastable levels, averaged over the whole fiber length. Above threshold, the population in the highest level, which is the upper laser level, is clamped to a constant value.
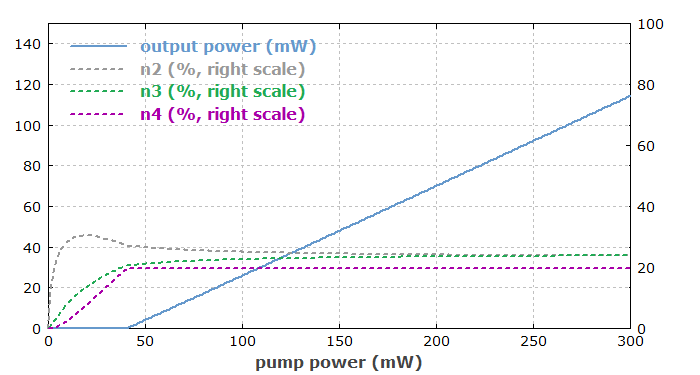
Figure 3: Variation of the pump power.